Anchored VWAP is a volume-weighted average price line calculated from a selected anchor point forward. Instead of resetting automatically at the start of a trading session, it begins from a chosen bar, event, swing, or period and then measures average traded value from that point onward.
The anchor is the key distinction. A standard VWAP reading usually describes the current session or another fixed reset period. Anchored VWAP describes only the price and volume history included after the selected starting point. That makes the line sensitive to the quality of the anchor, not just to the formula.
Key Points
- Anchored VWAP starts from a selected anchor point rather than automatically from the session open.
- The calculation uses cumulative price-volume weighting from the anchor forward.
- The anchor controls which market history is included in the reading.
- A touch, cross, or reaction near the line is an observation, not a complete trade signal.
- Weak, stale, or arbitrary anchors can make the reading misleading.
What Is Anchored VWAP?
Anchored VWAP is a VWAP variant that calculates volume-weighted average price from a user-selected starting point. The selected anchor may be a swing high, swing low, earnings event, gap, news bar, breakout area, session open, or the start of a broader period such as a month, quarter, or year.
Anchored VWAP belongs to the price-volume indicator family because it combines price location with traded volume. A price above or below the line only describes where price sits relative to the volume-weighted average since the anchor. It does not prove that buyers or sellers are in control by itself.
| Classification | Anchored VWAP role | Boundary |
|---|---|---|
| Volume-weighted average | Calculates average price weighted by volume after the anchor. | It is not a standalone forecast. |
| Anchor-dependent reference line | Changes meaning when the starting point changes. | Weak anchor choice can distort interpretation. |
| Context tool | Compares current price with a selected price-volume history. | It still needs market context, liquidity, and structure. |
Anchored VWAP vs Standard VWAP
VWAP usually resets by session or by another fixed calculation period. Anchored VWAP starts from a chosen point and continues forward until the user changes or removes the anchor.
| Feature | Standard VWAP | Anchored VWAP |
|---|---|---|
| Starting point | Usually the session open or a fixed reset period. | A selected bar, event, swing, or period. |
| Main question | Where is price relative to the session’s volume-weighted average? | Where is price relative to the volume-weighted average since the anchor? |
| Interpretation driver | The session or fixed period controls the calculation window. | The selected anchor controls the calculation window. |
| Common misuse | Treating the session line as automatic support or resistance. | Choosing an anchor after the fact to support a desired reading. |
How Anchored VWAP Is Calculated
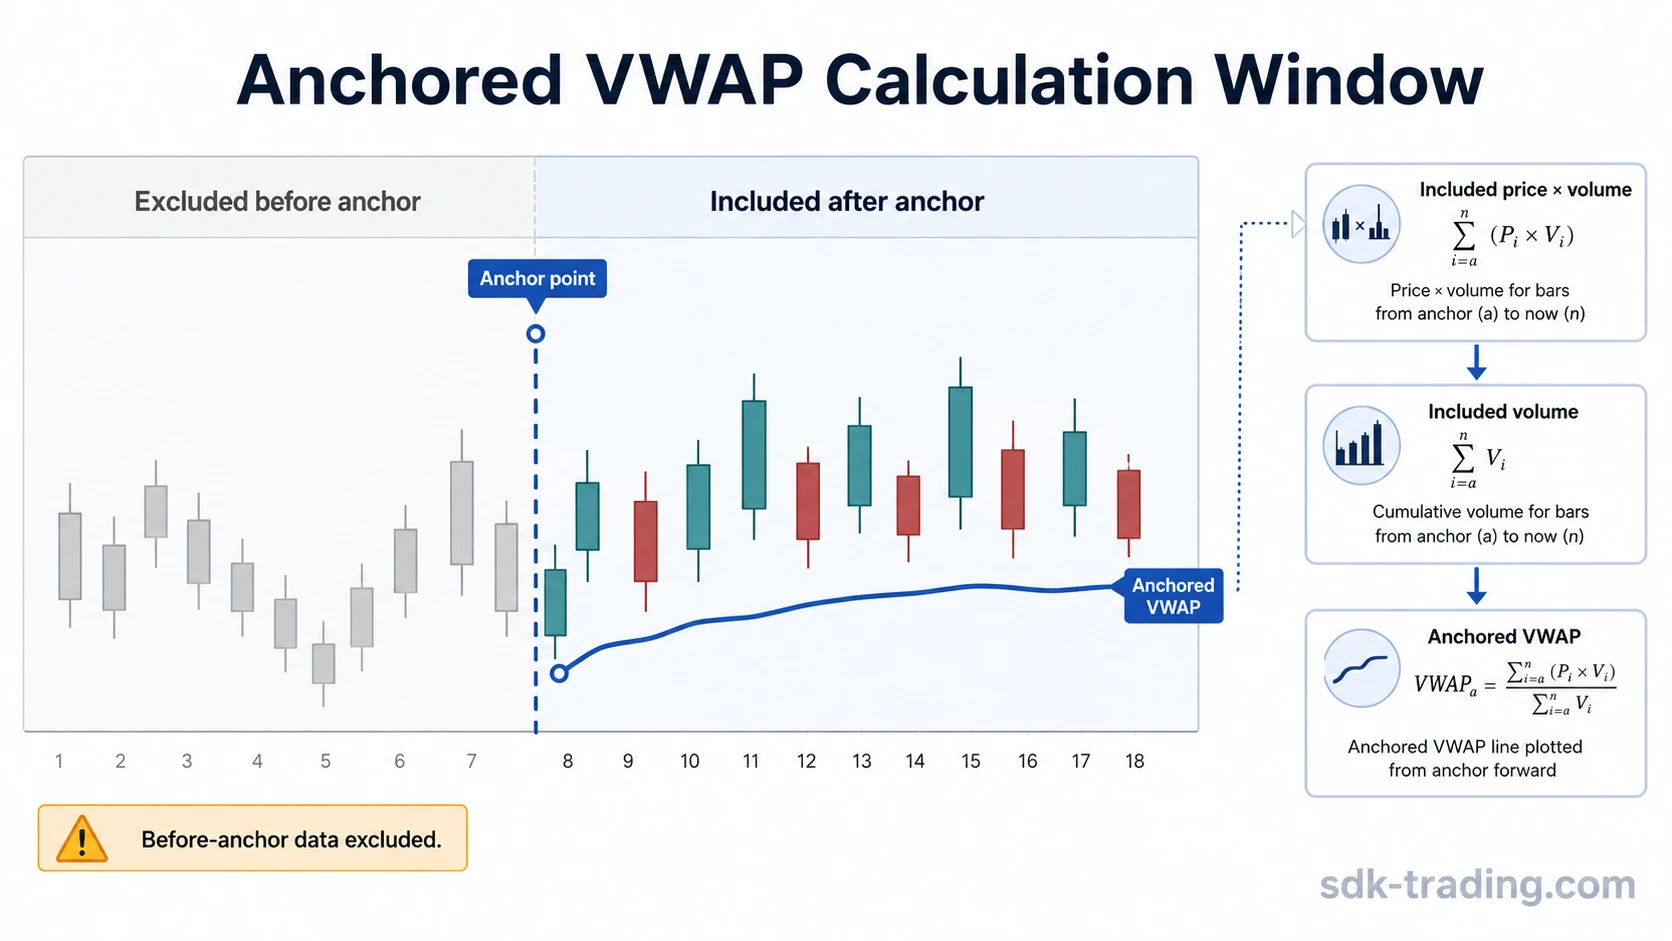
Anchored VWAP uses the same basic weighting idea as VWAP, but the cumulative totals begin at the selected anchor. Each included bar contributes price multiplied by volume. The indicator then divides cumulative price-volume by cumulative volume.
Simple formula: Anchored VWAP = cumulative sum of price x volume from the anchor / cumulative volume from the anchor.
Only bars after the anchor are included. Price and volume before the anchor are excluded from the calculation. This is why two traders can place anchors on different events and see different lines on the same chart.
Many platforms use a typical price input such as high plus low plus close divided by three, although implementation details can vary. The core mechanism remains the same: the line represents a volume-weighted average from the chosen starting point.
Why the Anchor Point Matters
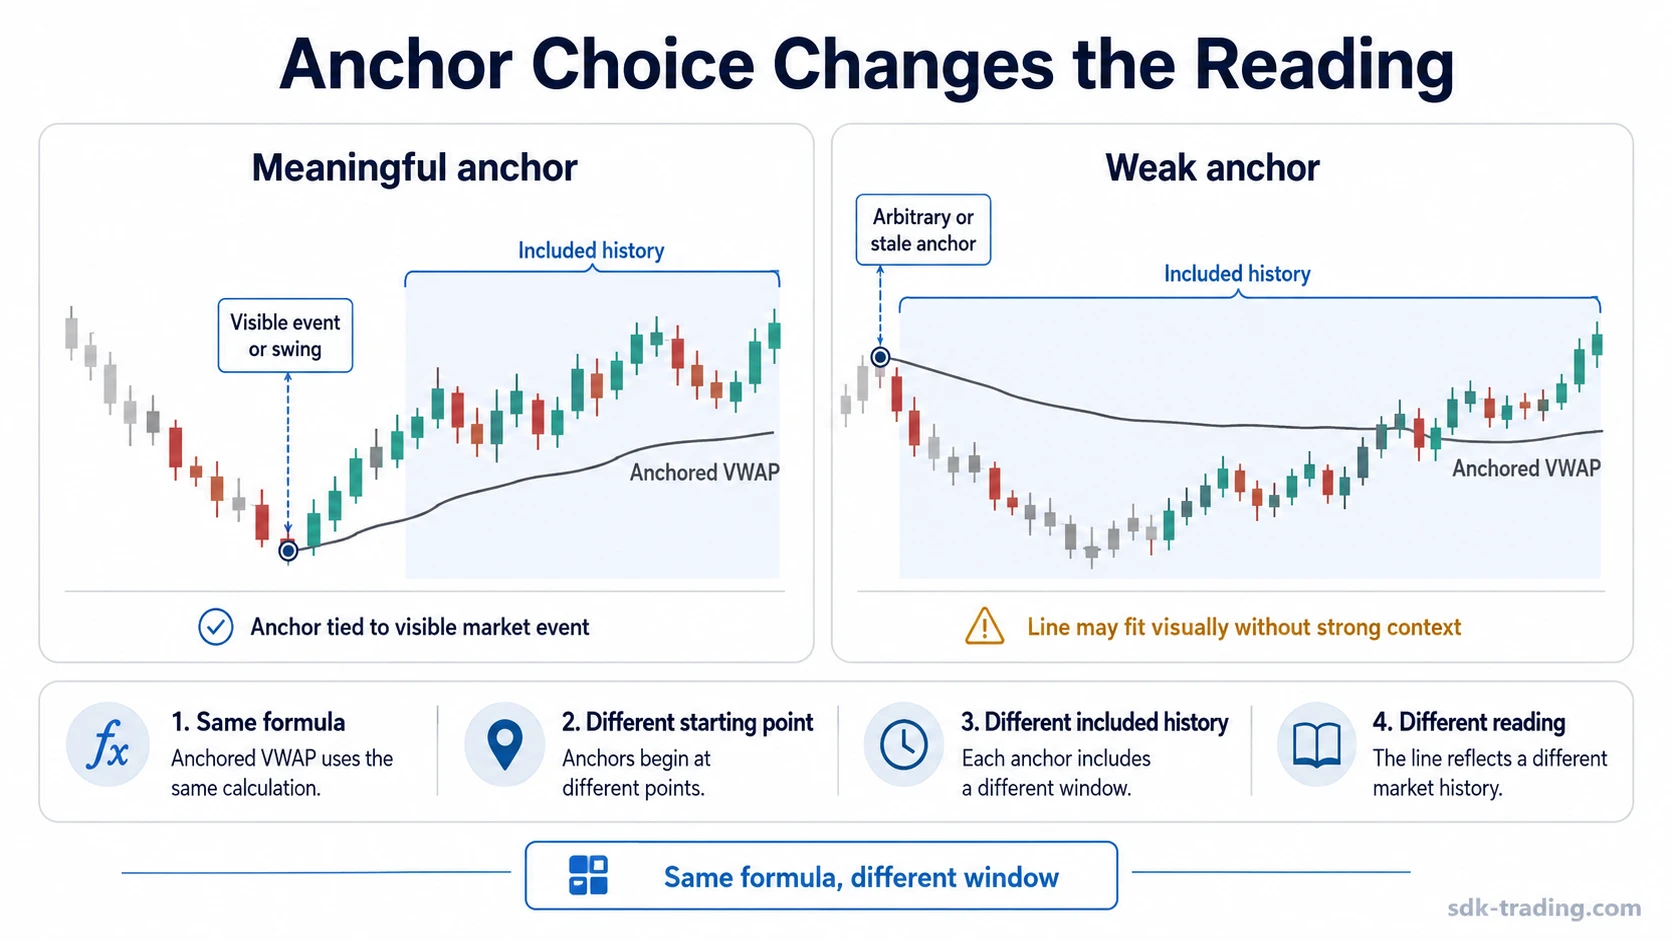
The anchor decides which market history the line represents. A meaningful anchor usually marks a point where market participants may have changed their reference price, such as a major swing, event, gap, breakout, or period boundary. An arbitrary anchor can create a line that looks precise but carries weak interpretive value.
| Anchor type | What it may represent | Main limitation |
|---|---|---|
| Swing high | Average traded value after a visible rejection area or prior high. | The swing must be structurally meaningful, not chosen only because the line fits later price. |
| Swing low | Average traded value after a visible low or recovery point. | A low anchor can overstate significance if later volume is thin. |
| Earnings or news event | Average traded value after new information entered the market. | The event may lose relevance as newer information appears. |
| Gap or breakout bar | Average traded value after a sharp repricing or range expansion. | A single abnormal bar can dominate early readings. |
| Session, month, quarter, or year start | Average traded value from a fixed period boundary. | Calendar anchors may be convenient rather than structurally meaningful. |
Anchor discipline matters because the same formula can support different interpretations when the starting point changes. The line becomes more useful when the anchor is selected before interpretation and represents a visible market event or period.
What Anchored VWAP Can Show
Anchored VWAP can show where current price sits relative to the volume-weighted average price since a selected event or period. If price is above the line, current price is above that selected average. If price is below the line, current price is below that selected average.
| Reading | What it can describe | What still needs context |
|---|---|---|
| Price above anchored VWAP | Price is above the volume-weighted average since the anchor. | Whether participation, liquidity, and structure support the move. |
| Price below anchored VWAP | Price is below the volume-weighted average since the anchor. | Whether the move reflects pressure, drift, or thin-volume behavior. |
| Price near anchored VWAP | Price is close to the selected average cost reference. | Whether the area is being accepted, rejected, or simply crossed without meaning. |
The line is most useful as a reference point. It can organize a chart around a selected event, but the reading remains incomplete without volume quality, liquidity, price structure, and later behavior.
What Anchored VWAP Cannot Prove
Anchored VWAP does not prove buyer control, seller control, support, resistance, reversal quality, trend quality, or trade validity. It only calculates a volume-weighted average from the selected anchor.
A reaction near the line can be visible on a chart, but the line itself does not explain why the reaction occurred. Price may pause near anchored VWAP because participants are watching the level, because liquidity is thin, because a broader range is forming, or because unrelated market conditions are influencing price.
Bands or deviations around anchored VWAP are platform-specific variations. They can describe distance from the anchored line, but they are not part of the core anchored VWAP definition and should not be treated as automatic signals.
Common Anchored VWAP Mistakes
| Mistake | Why it weakens the reading | Safer interpretation |
|---|---|---|
| Using an arbitrary anchor | The line may fit the chart visually without representing a meaningful market reference. | Use anchors tied to visible events, swings, or period boundaries. |
| Keeping a stale anchor | Old information can dominate the reading after market conditions have changed. | Reassess whether the anchor still represents the active market context. |
| Using a too-recent anchor | The line may reflect too little price and volume history to carry much context. | Check whether enough activity has occurred after the anchor. |
| Calling the line support or resistance | A calculated average is not the same as confirmed demand or supply. | Treat interaction with the line as an observation that needs confirmation. |
| Ignoring liquidity and volume quality | Thin or abnormal volume can make the line appear more meaningful than it is. | Check whether volume and liquidity support the interpretation. |
| Confusing bands with core AVWAP | Deviation bands are an added platform feature, not the base calculation. | Separate the anchored average from optional band settings. |
| Re-anchoring to fit a conclusion | Moving the anchor after seeing the result can turn analysis into curve-fitting. | Choose the anchor from a clear market reason before judging the line. |
Simple Anchored VWAP Example
Assume a market makes a visible gap after an earnings report. An anchored VWAP placed on the earnings gap measures average traded value from that repricing event forward. A second anchored VWAP placed on a later swing low measures a different period, because it excludes the earlier gap and the volume traded before the swing low.
Both lines can be mathematically correct, but they answer different questions. The first line describes the average since the information shock. The second line describes the average since the later recovery point. The difference comes from the selected anchor, not from a different indicator.
Related Concepts
Standard VWAP is the closest concept because both indicators use volume-weighted average price. The main difference is the calculation window: standard VWAP usually resets on a fixed period, while anchored VWAP starts from a selected event, bar, or period.
Anchored VWAP FAQ
What is anchored VWAP?
Anchored VWAP is a volume-weighted average price calculated from a selected anchor point forward. The anchor can be a swing, event, gap, session open, or broader period boundary.
How is anchored VWAP different from VWAP?
Standard VWAP usually resets by session or another fixed period. Anchored VWAP begins from a user-selected point and includes only price and volume after that anchor.
Where should anchored VWAP be anchored?
Common anchors include swing highs, swing lows, earnings events, gaps, news bars, breakout areas, session opens, and month, quarter, or year starts. The anchor should represent a meaningful market event or reference period.
Does anchored VWAP act as support or resistance?
Anchored VWAP can be watched as a reference line, but it does not prove support or resistance by itself. A reaction near the line still needs price structure, volume, liquidity, and later behavior for context.
Are anchored VWAP bands part of the core indicator?
Bands or deviations are optional platform variations. The core anchored VWAP reading is the volume-weighted average price from the selected anchor point.
When can anchored VWAP be misleading?
Anchored VWAP can be misleading when the anchor is arbitrary, stale, too recent, or chosen after the chart already shows the desired result. The line also needs volume, liquidity, and price-structure context before it is given interpretive weight.