VWAP and a moving average can both appear as average-price lines near price, but they describe different things. VWAP describes volume-weighted session participation, while a moving average smooths price across a selected rolling lookback.
The useful distinction is not which line is automatically better. It is what each line is built from, how it updates, and what kind of context it can provide when price interacts with it.
Key Points
- VWAP weights price by volume.
- A moving average smooths price over a lookback.
- Session VWAP normally starts fresh at the session open, while moving averages roll forward.
- Similar-looking lines can carry different meaning.
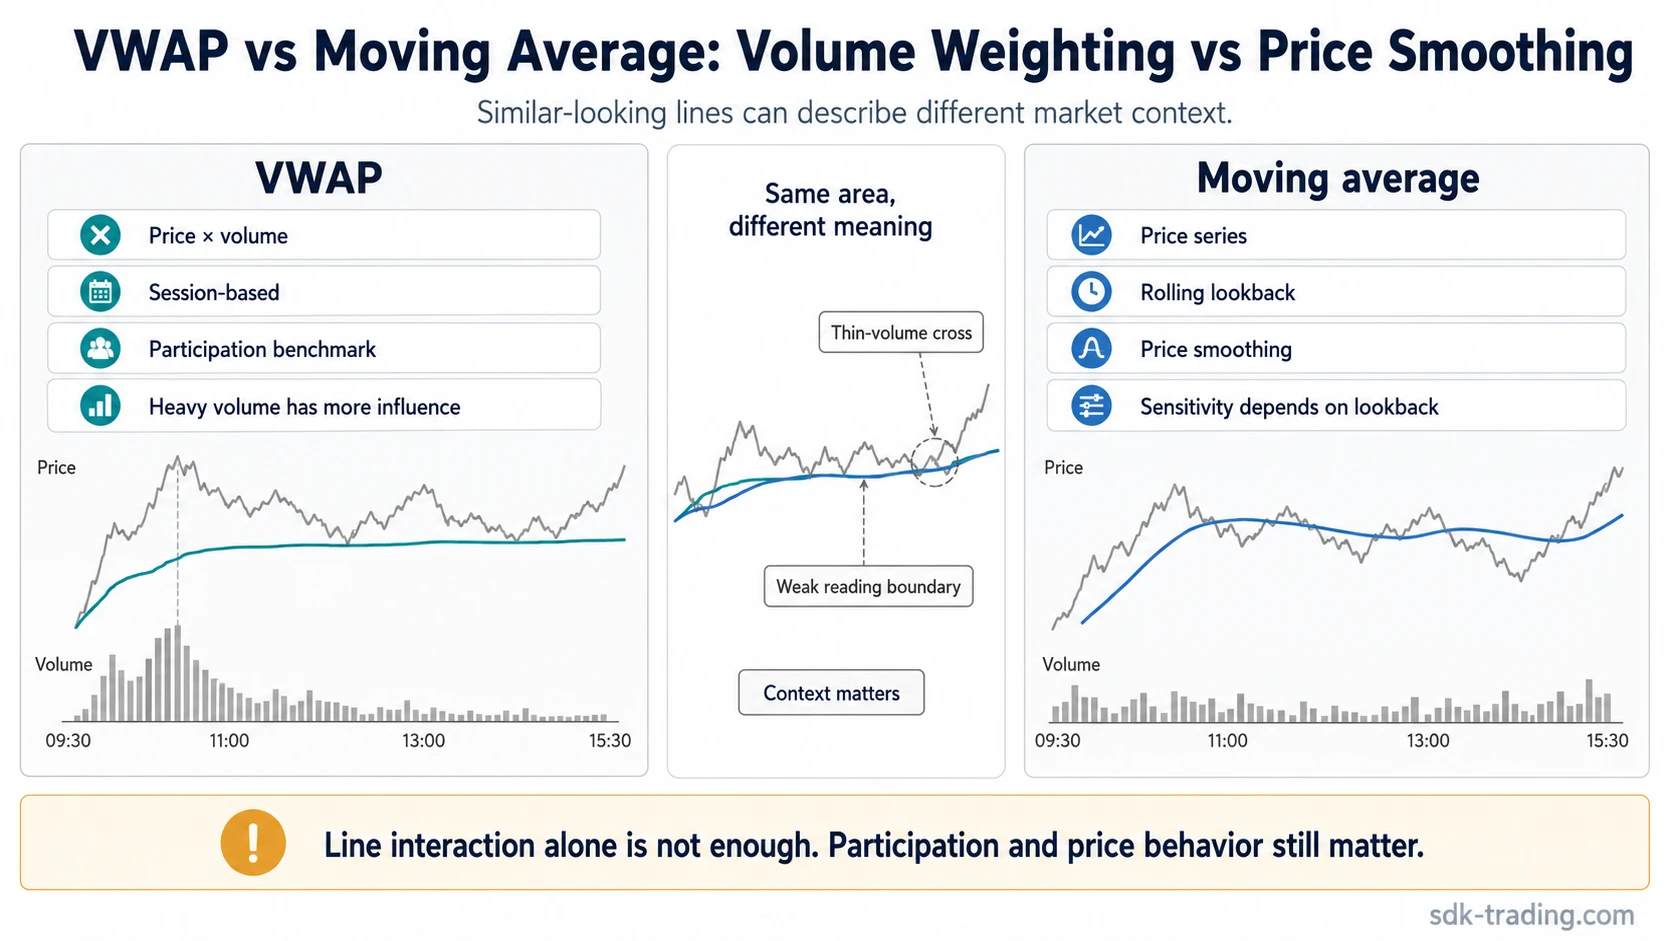
VWAP vs moving average: the core difference
VWAP is a volume-weighted benchmark. It combines price and volume to show the average price at which participation has occurred during the measured period, usually the current trading session.
A moving average is a price-smoothing line. It averages price over a selected number of periods, such as a 20-period SMA or a 50-period EMA, and then rolls forward as new price data replaces older data.
VWAP is tied to participation, while a moving average is tied to price smoothing. Both can help organize chart context, but neither line proves direction, reversal timing, or trade quality by itself.
Why VWAP and moving averages can look similar
VWAP and moving averages can look similar because both convert a sequence of market data into a single line. When price is moving steadily and volume is not changing dramatically, the lines may travel near each other.
The visual similarity creates a false equivalence. VWAP changes according to where volume-weighted participation has accumulated. A moving average changes according to how recent price has moved inside the selected lookback.
Overlap and divergence:
| What overlaps | Where meaning diverges |
|---|---|
| Both can appear as average lines on a chart. | VWAP includes volume weighting; a moving average usually uses price only. |
| Both can sit above, below, or near current price. | VWAP reflects session participation; a moving average reflects rolling price smoothing. |
| Both can react to strong price movement. | VWAP may become harder to move after heavy earlier volume; a moving average keeps replacing older price data. |
VWAP vs moving average comparison table
| Question | VWAP | Moving average | Why it matters |
|---|---|---|---|
| Main input | Price and volume. | Price over a selected number of periods. | VWAP includes participation size; a moving average focuses on price behavior. |
| Weighting | Prices with more volume have more influence. | SMA weights each selected period equally; EMA gives more weight to recent prices. | The same price movement can affect each line differently. |
| Reset / lookback | Session VWAP normally resets at the session open. | A moving average rolls forward through its selected lookback. | VWAP is usually session-specific, while moving averages can carry continuity across sessions. |
| Session relevance | Strong for intraday participation context. | Useful for smoothing price across short, medium, or longer lookbacks. | The right lens depends on whether session participation or rolling price behavior matters more. |
| Sensitivity | Can become less sensitive later in the session after heavy earlier volume. | Sensitivity depends on lookback length and averaging method. | A late move may shift a short moving average more than VWAP if earlier VWAP volume was large. |
| Typical interpretation | Where price stands relative to volume-weighted session participation. | How current price relates to smoothed recent or longer-term price behavior. | The lines answer different questions even when they sit near each other. |
| Weak reading risk | A thin-volume cross can look important while participation remains weak. | A cross or touch can reflect smoothing mechanics rather than meaningful market context. | Line interaction alone is not enough without surrounding price behavior and participation context. |
Calculation boundary: volume weighting vs price smoothing
VWAP is calculated by adding price multiplied by volume, then dividing by total volume over the measured period. In simplified form, it answers where the session’s volume-weighted price activity has averaged.
A moving average calculates an average of price over a selected lookback. A simple moving average uses an arithmetic average of the selected prices. An exponential moving average gives more weight to recent prices, but it is still a rolling price-smoothing tool rather than a volume-weighted participation benchmark.
| Boundary | VWAP | Moving average |
|---|---|---|
| Main input | Price x volume. | Price series. |
| Update driver | New price-volume participation. | New selected price data. |
| Reset / continuity | Usually session-based. | Rolling lookback. |
| Main limitation | Thin late volume can mislead. | A cross or touch can reflect smoothing only. |
Calculation boundary: VWAP changes when price and volume change together. A moving average changes when the selected price series changes. That difference matters most when volume is uneven, when the session has a heavy early activity zone, or when a short late move occurs on thin participation.
Same chart, different meaning
Imagine an intraday chart where price trades near both session VWAP and a 20-period moving average. The lines may sit close together, but the reading is not identical.
VWAP vs moving average example in context:
| Chart condition | VWAP reading | Moving-average reading |
|---|---|---|
| Price trades near both lines after earlier high-volume activity. | VWAP shows where volume-weighted session participation has averaged so far. | The moving average shows how recent price has smoothed across the selected lookback. |
| Price briefly crosses both lines on lighter volume. | The VWAP cross may be weak if participation does not support the move. | The moving-average cross may reflect recent price smoothing rather than a confirmed shift. |
| Price holds near the lines without clear follow-through. | VWAP gives session participation context, not proof of direction. | The moving average gives trend-smoothing context, not proof of trade quality. |
The same chart can therefore produce two different readings: VWAP frames the move against session participation, while the moving average frames it against the selected price lookback.
When VWAP is the better lens
VWAP fits best when the question is about intraday participation. It can frame whether current price is above, below, or near the volume-weighted average price for the session.
| Use VWAP when the main question is… | What VWAP can describe | What it cannot prove alone |
|---|---|---|
| Where session participation has averaged. | Volume-weighted price context for the current session. | Future direction or trade quality. |
| Whether a late price move has participation behind it. | How far price is from the session’s volume-weighted benchmark. | That a cross or touch is meaningful by itself. |
| How heavy earlier volume affects the current benchmark. | Why VWAP can become harder to shift later in the session. | That earlier volume will control later price behavior. |
VWAP works best as a context line for participation, not as a standalone decision rule.
When a moving average is the better lens
A moving average fits best when the question is about smoothed price behavior across a selected lookback. The lookback can be short for recent movement or longer for broader price structure.
| Use a moving average when the main question is… | What a moving average can describe | What it cannot prove alone |
|---|---|---|
| How recent price has smoothed over time. | The average path of price across the selected lookback. | Whether the next move will continue. |
| Whether price is extended from its recent average. | Distance between current price and a smoothed price reference. | That price must revert or continue. |
| How different lookbacks compare. | Shorter and longer smoothing behavior through SMA or EMA variants. | That a moving-average cross is enough for confirmation. |
The moving average lens depends on whether the selected lookback matches the question being asked. A short lookback can react quickly, while a longer lookback filters more noise but responds more slowly.
Common mistake: treating both lines as the same signal
The common mistake is treating line proximity as confirmation. If VWAP and a moving average sit near the same price, that does not mean they carry the same information.
Weak reading boundary: A late thin-volume move through VWAP can be a weak reading when earlier high-volume activity still dominates the session benchmark. A move through a moving average can also be weak when it reflects a short-term smoothing change without broader price acceptance.
Indicator clutter can make the problem worse. Multiple average lines can create the appearance of agreement even when each line is responding to a different input, weighting method, or lookback.
A safer interpretation separates the source of the line from the behavior around it. VWAP asks about volume-weighted participation. A moving average asks about smoothed price behavior. Price reaction, participation, volatility, and broader structure determine whether the reading has enough context to matter.
VWMA and anchored VWAP: related but different
VWMA and VWAP can be confused because both involve volume weighting. A VWMA is usually a rolling volume-weighted moving average over a selected lookback, while VWAP is commonly used as a cumulative session benchmark.
Anchored VWAP is different again because it starts from a selected anchor point rather than simply resetting at each session open. That makes the anchor choice part of the interpretation.
These related tools should not be collapsed into one meaning. The input, reset point, and lookback structure decide what the line can describe.
FAQ
Is VWAP a moving average?
VWAP is an average price, but it is not the same as a standard moving average. VWAP weights price by volume and is commonly measured from the session open, while a moving average smooths price over a rolling lookback.
Is VWAP better than a moving average?
VWAP is not automatically better than a moving average. VWAP is more useful for volume-weighted session participation, while a moving average is more useful for rolling price smoothing. The better lens depends on the question being asked.
Why can VWAP and a moving average look similar?
They can look similar because both produce average-price lines. The similarity is visual, not structural. VWAP is influenced by volume-weighted participation, while a moving average is driven by price across a selected lookback.
What is the difference between VWAP and VWMA?
VWAP is commonly used as a cumulative session benchmark. VWMA is usually a rolling volume-weighted moving average over a selected lookback. Both use volume, but their reset and lookback behavior differ.
How is anchored VWAP different?
Anchored VWAP starts from a chosen anchor point instead of simply starting from the current session open. That makes the anchor point part of the interpretation, while session VWAP usually starts fresh at the session open.