Camarilla pivot points are calculated support and resistance tiers built from the previous session’s high, low, and close, with each level arranged around the prior close. The grid gives a reference structure for intraday or session-based interpretation, but the levels are not a complete trading system by themselves.
Definition: Camarilla pivot points are close-anchored pivot levels that project upper resistance tiers and lower support tiers from the prior session’s range.
The useful reading comes from how price responds around the tiers. A level touch alone is weak information; follow-through, failed follow-through, hesitation, or fast movement through several levels changes the interpretation.
Key Points
- Camarilla pivot points use the previous high, low, and close as calculation inputs.
- The levels form a support and resistance grid around the prior close.
- Inner and outer tiers carry different interpretation roles.
- A Camarilla level is a reference point, not a complete trading signal.
- The grid can mislead when volatility or session behavior changes sharply.
What Are Camarilla Pivot Points?
Camarilla pivot points are a type of support and resistance indicator. They take the previous session’s range and close, then convert that information into a set of upper and lower levels for the next session or chart period.
The method is different from drawing discretionary support and resistance by eye. Camarilla levels are calculated, fixed for the selected session, and usually displayed as horizontal lines above and below the prior close.
The main boundary is important: Camarilla levels describe a price map, not a decision by themselves. A price reaction near one tier may become useful only when later candles show whether the market is respecting the tier or moving cleanly beyond it.
How Camarilla Pivot Points Are Calculated
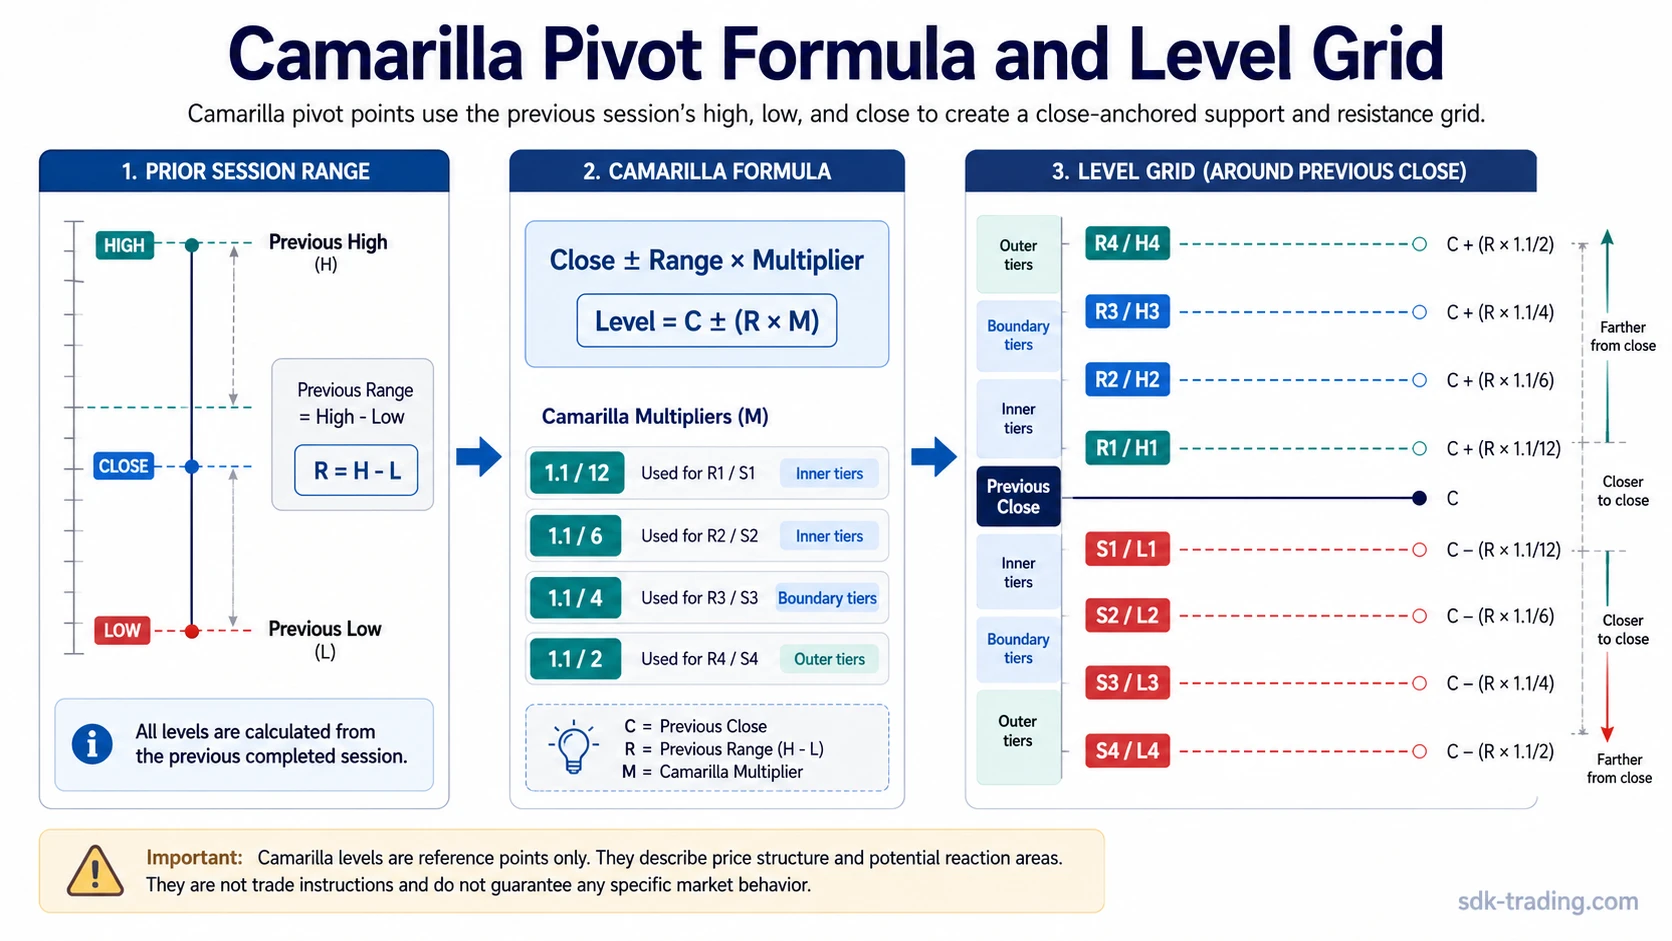
The common Camarilla calculation starts with three inputs from the previous session: high, low, and close. The high-low range is multiplied by fixed fractions, then added to or subtracted from the previous close.
Calculation idea: previous close +/- previous range x Camarilla multiplier.
| Input or term | Meaning | Role in the level grid |
|---|---|---|
| Previous high | The highest price from the prior session | Defines the top of the prior-session range |
| Previous low | The lowest price from the prior session | Defines the bottom of the prior-session range |
| Previous close | The closing price from the prior session | Acts as the central anchor for Camarilla levels |
| Previous range | Previous high minus previous low | Controls how wide the upper and lower tiers become |
| Multiplier | A fixed fraction applied to the prior range | Creates nearer and farther levels around the close |
A widely used four-level version applies 1.1 x range divided by 12, 6, 4, and 2. The upper levels are often labelled R1 to R4 or H1 to H4, while the lower levels are often labelled S1 to S4 or L1 to L4.
Some platforms add extra Camarilla tiers or display the same levels with H/L instead of R/S labels, so the formula, session setting, and displayed level set should be read together.
| Common level | Common formula form | Interpretation role |
|---|---|---|
| R1 / H1 | Close + Range x 1.1 / 12 | Nearer upper tier |
| R2 / H2 | Close + Range x 1.1 / 6 | Second upper tier |
| R3 / H3 | Close + Range x 1.1 / 4 | Commonly watched upper boundary area |
| R4 / H4 | Close + Range x 1.1 / 2 | Outer upper displacement zone |
| S1 / L1 | Close – Range x 1.1 / 12 | Nearer lower tier |
| S2 / L2 | Close – Range x 1.1 / 6 | Second lower tier |
| S3 / L3 | Close – Range x 1.1 / 4 | Commonly watched lower boundary area |
| S4 / L4 | Close – Range x 1.1 / 2 | Outer lower displacement zone |
Platform note: charting platforms may label the same idea with R/S levels or H/L levels, and some tools add extra tiers beyond the basic four-level version. The interpretation should match the formula and session setting used by the platform, not the label alone.
Camarilla Level Anatomy
Camarilla levels can be read as a tiered map around the prior close. The inner levels sit nearer to the close and often help define early balance or hesitation. The outer levels sit farther away and are more closely associated with displacement, range pressure, or a session that is no longer behaving like the prior one.
| Level area | Typical role | Safer interpretation boundary |
|---|---|---|
| R1/R2 or H1/H2 | Nearer resistance tiers above the close | Useful for observing early reaction, but weak without follow-through behavior |
| S1/S2 or L1/L2 | Nearer support tiers below the close | Useful for observing early reaction, but weak without follow-through behavior |
| R3/H3 | Commonly watched upper boundary | Not an automatic reversal area; acceptance above it changes the reading |
| S3/L3 | Commonly watched lower boundary | Not an automatic reversal area; acceptance below it changes the reading |
| R4/H4 | Outer upper pressure zone | Can mark stronger upside displacement pressure if price holds beyond the tier |
| S4/L4 | Outer lower pressure zone | Can mark stronger downside displacement pressure if price holds beyond the tier |
The H3/L3 or R3/S3 area often receives attention because it sits between normal range behavior and stronger boundary testing. The reading still depends on whether price rejects the area, stalls around it, or holds beyond it.
How Camarilla Readings Become Clean, Weak, or False
A Camarilla reading becomes more useful when the calculated tier and the later market response point in the same direction. The grid gives context; price action decides whether the context is being respected.
| Reading type | What appears on the chart | Diagnostic interpretation |
|---|---|---|
| Clean reading | Price tests a Camarilla tier, fails to accept beyond it, and later behavior supports the rejection or respect of that area | The level and the market response are aligned |
| Weak reading | Price pauses near a level but does not clearly accept, reject, or follow through | The level is visible, but the behavior around it is unresolved |
| False-positive reading | Price touches a watched level, but then moves through multiple tiers or accepts outside the expected range | The prior-session grid is no longer describing the current session well |
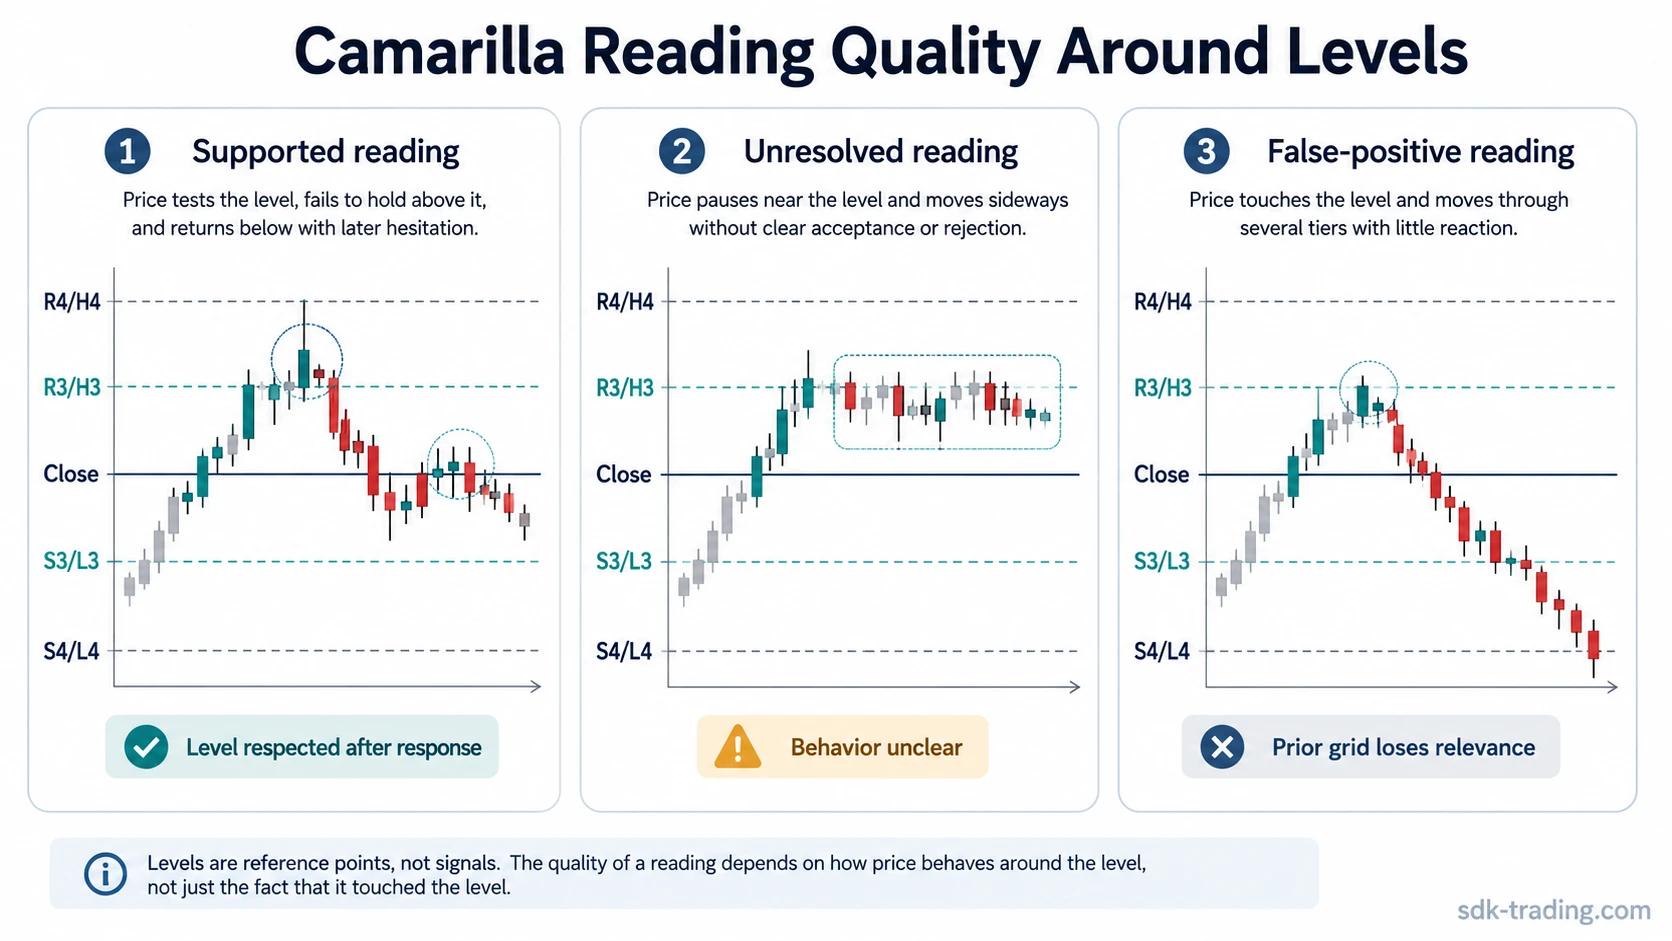
Example of a basic Camarilla reading: Price opens near the prior close and slowly tests the R3/H3 area. The first touch is only an observation. The reading is cleaner when price fails to hold above the tier, returns under it, and later recovery attempts stall near the same area. A weaker reading remains if price only hesitates and then trades sideways without a clear decision. A false-positive reading becomes more likely if the session expands quickly through R3/H3 and R4/H4 with little reaction.
The main mistake is treating the label of the level as more important than the behavior around it. A calculated line can mark a useful observation point, but it cannot confirm whether the current session is balanced, expanding, rejecting, or accepting new prices.
Camarilla Pivot Points vs Classic Pivot Points
Camarilla pivot points and classic Pivot Points both use prior-session price data, but they organize that data differently. Classic Pivot Points start from a central pivot calculation. Camarilla levels are more closely anchored around the prior close and create a denser set of nearby tiers.
| Comparison point | Camarilla pivot points | Classic Pivot Points |
|---|---|---|
| Main anchor | Previous close with range-based offsets | Central pivot based on prior high, low, and close |
| Level structure | Dense upper and lower tiers around the close | Central pivot plus broader support and resistance levels |
| Common focus | Inner/outer tier behavior and boundary testing | Relationship to the central pivot and major S/R levels |
| Main risk | Overreading a level touch as a completed signal | Overreading the central pivot as a complete market bias |
The distinction is practical: Camarilla levels emphasize how the current session behaves around close-anchored tiers, while classic Pivot Points emphasize a broader pivot framework built from the previous session’s price structure.
Where Camarilla Pivots Can Mislead
Camarilla levels are fixed from prior-session data. That makes them clean and easy to observe, but it also creates a limitation: a new session can behave very differently from the session that created the grid.
Limitation: A prior-session grid can become less reliable when volatility expands, session range changes sharply, price accepts beyond several levels, or the platform’s session settings do not match the market being analyzed.
| Failure condition | Why it matters | Safer reading |
|---|---|---|
| Fast movement through several tiers | The market is not respecting the earlier range structure | Treat the grid as stale or incomplete until behavior stabilizes |
| Volatility expansion | Prior range may be too narrow for the current session | Assign less weight to single-level reactions |
| Strong trend-day behavior | Outer levels may not contain the move | Focus on acceptance and failed recovery rather than level labels |
| Different session settings | High, low, and close inputs may change across platforms | Check whether the indicator is using the intended market session |
| Thin or fragmented trading conditions | Individual level reactions may be less reliable | Assign less weight until clearer structure appears |
A Camarilla grid is strongest as a reference structure when price still responds to the earlier range. It is weakest when current movement proves that the prior range no longer describes the active session well.
Related Level Concepts
Camarilla levels are built from the prior session’s range and close. Fibonacci Extension uses a different logic because it projects levels from a measured move rather than anchoring tiers around the previous close.
That difference matters when comparing level tools. Camarilla pivots are session-grid levels, while extension-style levels are projection levels. Mixing the two without separating their calculation logic can make a chart look more precise than the evidence supports.
FAQ
What are Camarilla pivot points?
Camarilla pivot points are calculated support and resistance tiers based on the previous session’s high, low, and close. They create a close-anchored grid for interpreting price behavior around upper and lower levels.
What is the Camarilla pivot points formula?
A common version uses the previous close plus or minus the previous range multiplied by fractions of 1.1. The range is the previous high minus the previous low, and the fractions create nearer and farther support and resistance tiers.
Are H3 and L3 automatic reversal levels?
No. H3 and L3 are commonly watched boundary areas, but they are not automatic reversal levels. The reading depends on whether price rejects, accepts, or moves through the area.
Why can Camarilla levels give false readings?
False readings can appear when current volatility expands, price moves through several tiers with little reaction, or the session settings used for the calculation do not match the market being analyzed.