A Fibonacci extension is a ratio-based projection that extends beyond a measured price swing in technical analysis. It marks possible reference areas beyond the prior swing endpoint, but it does not confirm continuation, reversal, or trade action.
The projection depends on the swing anchors chosen by the analyst. A clear impulse, a clear pullback point, and a coherent swing structure make the extension easier to interpret. Ambiguous anchors, crowded levels, or after-the-fact fitting can make the same tool misleading.
Definition: A Fibonacci extension projects ratio levels beyond a completed swing by measuring the distance from one swing point to another and extending that measurement from a later pullback or retracement point.
Key Points
- Fibonacci extension levels are projected beyond a measured swing endpoint.
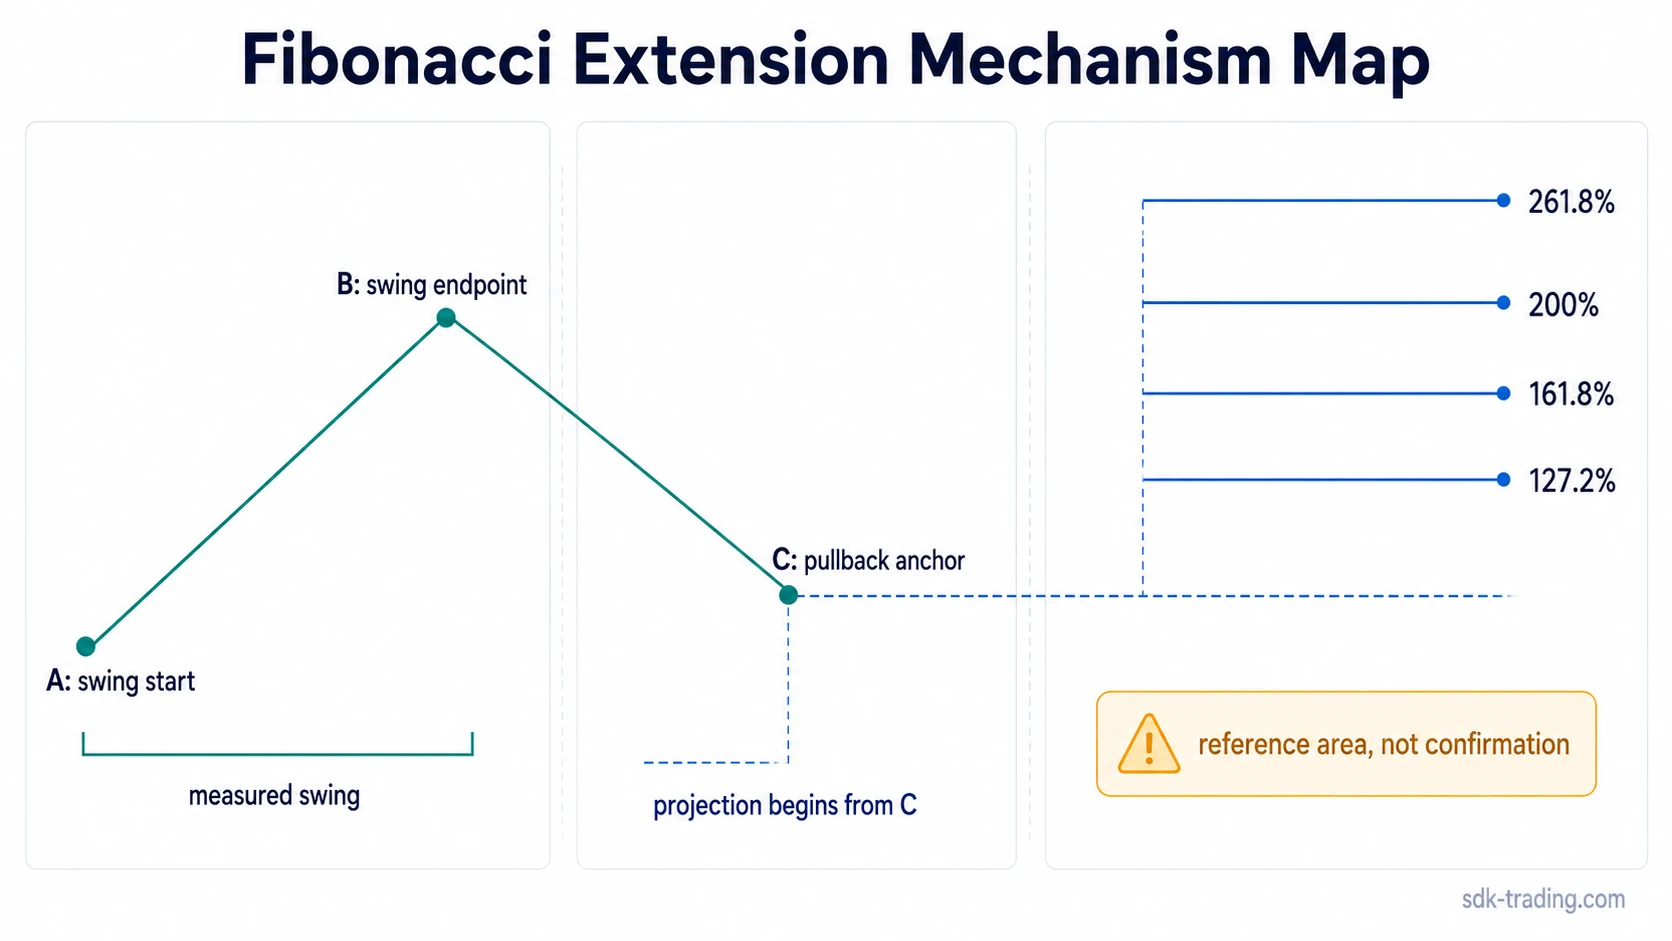
- Common levels include 127.2%, 161.8%, 200%, and 261.8%.
- The projected coordinates change when the swing anchors change.
- Touching an extension level does not confirm the next move.
- Retracement measures inside a prior swing; extension projects beyond it.
What Is a Fibonacci Extension?
A Fibonacci extension is a technical-analysis projection tool used to map proportional levels beyond a prior price swing. It is commonly used to map possible areas where price may react, pause, accelerate, or fail to hold acceptance after moving beyond a previous swing high or swing low.
The common misunderstanding is treating the projected level as a forecast. The extension does not say that price must reach 161.8%, reverse at 200%, or respect any specific coordinate. It only gives a ratio-based reference area that still depends on market structure, volatility, and the quality of the selected swing.
Diagnostic boundary: A Fibonacci extension is a projected coordinate. It is not proof of direction, not a complete strategy, and not a trade decision. The reading is cleaner when the measured swing is obvious and weaker when the anchors are selected only after the move already worked.
Fibonacci Extension Levels and How They Are Projected
Fibonacci extension levels are built from ratios applied to a measured price swing. A common trend-based extension uses three reference points: the start of the swing, the end of the swing, and the pullback point from which the projection begins.
| Extension level | Ratio form | Interpretation boundary |
|---|---|---|
| 100% | 1.0 | A full measured-swing projection from the chosen pullback point. |
| 127.2% | 1.272 | A moderate extension beyond the measured swing. |
| 161.8% | 1.618 | A widely watched extension level, often treated as a major projected coordinate. |
| 200% | 2.0 | A double measured-swing projection from the selected anchor structure. |
| 261.8% | 2.618 | An extended projection that often needs clearer surrounding structure before it carries interpretive weight. |
| 423.6% | 4.236 | An aggressive projection that can become noisy when the swing structure is unclear. |
In a simple upward swing, point A marks the swing low, point B marks the swing high, and point C marks the pullback. Extension levels project beyond B from the C anchor. In a downward swing, the logic is mirrored: the measured decline is projected beyond the prior swing low from the corrective bounce point.
Fibonacci Extension vs Fibonacci Retracement
Fibonacci extension and retracement both use Fibonacci ratios, but they measure different parts of a swing. Fibonacci retracement levels measure how far price pulls back inside a prior move, while Fibonacci extension levels project beyond the prior swing endpoint.
| Tool | Measurement zone | Main use in chart reading |
|---|---|---|
| Fibonacci retracement | Inside the prior swing | Measures a pullback within an existing move. |
| Fibonacci extension | Beyond the prior swing endpoint | Projects proportional reference areas after price moves past the measured swing. |
The distinction matters because a retracement reading asks how much of a prior move has been given back. An extension reading asks where proportional areas may appear after price moves beyond the earlier boundary.
Why Anchor Choice Changes Fibonacci Extension Levels
Fibonacci extension levels are not fixed chart locations. They move when the selected swing anchors move. A trader measuring the largest visible swing may produce different projected coordinates than someone measuring a shorter internal swing.
Anchor dependence is the central limitation of the tool. When the swing structure is clear, the projection can organize possible reaction areas. When several swing highs, swing lows, or pullback points compete for attention, the chart can fill with overlapping extension levels that look precise but add little clarity.
Common mistake: selecting anchors after price has already reacted to a level can make the projection look more accurate than it was in real time. A cleaner reading starts with a visible swing structure first, then checks how price behaves near the projected level.
Clean, Weak, and Invalid Fibonacci Extension Readings
The quality of a Fibonacci extension reading depends less on the ratio itself and more on the structure around it. A 161.8% level drawn from weak anchors is usually less useful than a less famous level drawn from a clear swing.
| Reading type | What the chart structure looks like | Interpretation boundary |
|---|---|---|
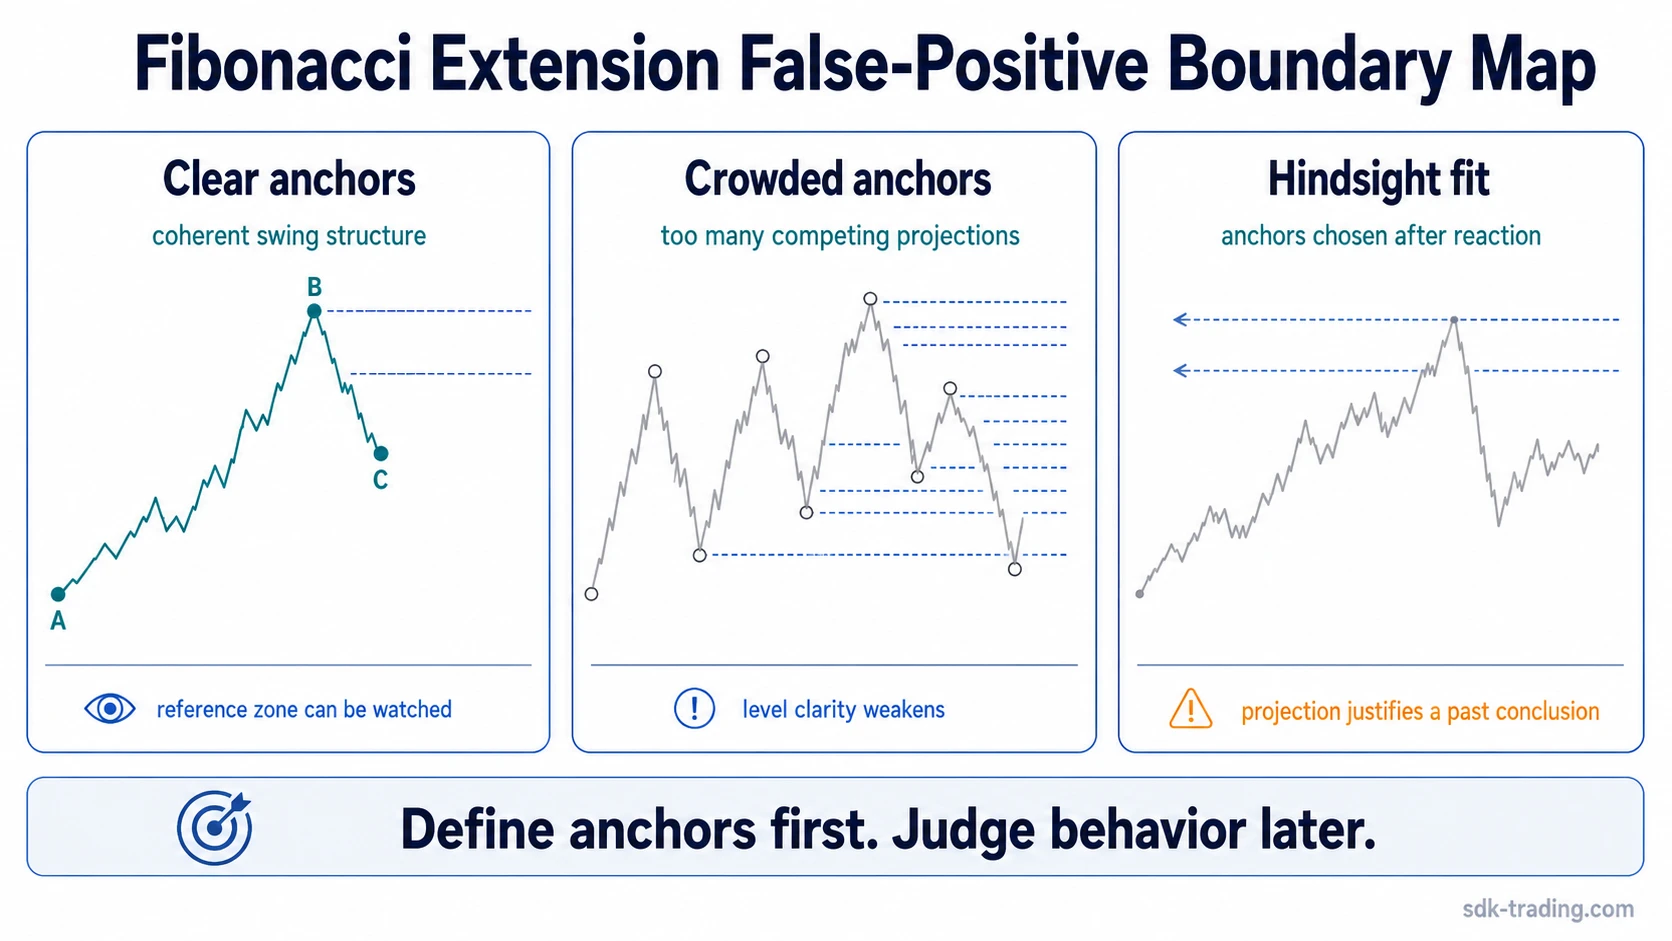
| Clean reading | Clear impulse, clear pullback anchor, and a coherent swing hierarchy. | The projected area can be watched as a reference zone, not as proof. |
| Weak reading | Several possible anchors create crowded projections, or price is moving sideways with no clean swing. | The level may reflect anchor choice more than meaningful structure. |
| Invalid or misread reading | Anchors are chosen after the reaction, or the level is treated as confirmation by itself. | The projection is being used to justify a conclusion rather than test one. |
Common Misunderstanding: Extension Level Is Not the Trade
A Fibonacci extension level is only a projected area. It does not define a trade, confirm a setup, or decide what should happen next. The same level can be accepted, rejected, ignored, or crossed without a clean reaction.
The safer interpretation is conditional. The level carries more interpretive weight when behavior around it fits the surrounding structure. It becomes less useful when the market cuts through the area without reaction, when every swing produces a different projection, or when the level is used as the only reason for a conclusion.
False-positive boundary: Fibonacci extensions can look convincing after the fact because many anchor combinations can be tested until one aligns with a past reaction. Real-time use requires the anchor structure to be defined before the reaction is judged.
Practical Scenario: When a Projection Looks More Useful or Less Useful
Price makes a strong upward swing, pulls back in a controlled way, and then moves beyond the prior swing high. A Fibonacci extension drawn from the swing low to the swing high and then from the pullback point projects several areas above the old high.
The projection looks cleaner if price approaches one of those areas after a clear swing sequence and then shows a visible change in behavior there, such as slowing, rejecting the area, or holding above it after a retest. The reading is weaker if the chart is choppy, the pullback point is hard to define, or several alternative anchors produce competing levels in the same zone.
The projected area still does not decide the outcome. The useful question is whether market behavior near that area respects the measured structure or makes the projection irrelevant.
Fibonacci Extension Limitations
Fibonacci extension levels can help organize chart structure, but they become unreliable when the measured swing is unclear. Choppy markets, sudden volatility, and overlapping swing choices can create levels that appear precise while offering little practical distinction.
| Limitation | Why it matters | Safer interpretation |
|---|---|---|
| Unclear swing anchors | Different traders can draw different projections. | Treat the level as weak unless the swing structure is obvious. |
| Choppy price action | Sideways movement can create many overlapping levels. | Do not treat ratio crowding as meaningful by itself. |
| High volatility | Fast moves can overshoot projected areas without clear reaction. | Focus on behavior around the area rather than the coordinate alone. |
| Hindsight fitting | Anchors selected after the move can make past reactions look cleaner than they were. | Define anchors before judging the projection. |
| Single-tool reliance | A ratio level cannot replace structure, risk, or broader market context. | Use the projection as one chart-reading input, not as a conclusion. |
FAQ
What is a Fibonacci extension in trading?
A Fibonacci extension is a ratio-based projection used in technical analysis to mark levels beyond a measured price swing. It extends the measured move from a later pullback point and creates projected reference areas.
What are the most common Fibonacci extension levels?
Common Fibonacci extension levels include 100%, 127.2%, 161.8%, 200%, and 261.8%. Some traders also watch 423.6%, especially in very extended moves, but the level still depends on the selected swing anchors.
How is a Fibonacci extension different from a retracement?
A retracement measures a pullback inside a prior swing. An extension projects ratio levels beyond the prior swing endpoint, usually from a later pullback or retracement point.
Can different traders get different Fibonacci extension levels?
Yes. Different swing highs, swing lows, and pullback points can produce different projected coordinates. That is why anchor clarity is one of the most important limits of the tool.
Does a Fibonacci extension level confirm a trade?
No. A Fibonacci extension level is a projected reference area, not confirmation. The interpretation depends on anchor quality, surrounding structure, and how price behaves around the projected area.