Fibonacci retracement is a technical-analysis method that maps proportional pullback levels between a swing high and a swing low. The grid can act as a support and resistance reference, but a touch of a ratio is more informative when the swing anchors are clear and price later responds around the area.
Definition: Fibonacci retracement measures how far price has pulled back inside a prior swing. The levels are reference zones inside the measured move, not predictions that price must reverse.
Key Points
- Fibonacci retracement maps pullback depth inside a measured price swing.
- The common levels are proportional reference zones, not guaranteed reaction points.
- Changing the swing high or swing low changes the entire grid.
- A level touch is weak without supportive price behavior around the area.
- Fibonacci extension is a separate projection concept beyond the measured swing.
What Is Fibonacci Retracement?
Fibonacci retracement is a chart-reading tool used to divide a completed price swing into proportional pullback areas. After a market moves from one visible swing point to another, the retracement grid marks where part of that move has been given back.
The main use is interpretation. A retracement level can act as a zone to evaluate possible support during a pullback after an advance, or possible resistance during a rebound after a decline. The level itself does not prove that demand or supply has appeared.
A stronger reading starts with a clean swing. If the selected high and low are arbitrary, crowded inside choppy action, or chosen after the reaction is already obvious, the grid can create a false sense of precision.
Boundary: A retracement level is a zone to evaluate. Structure, anchor quality, and later price behavior decide whether the zone matters.
Fibonacci Retracement Levels
The most common Fibonacci retracement levels are 23.6%, 38.2%, 50%, 61.8%, and 78.6%. The 50% level is widely used by traders, although it is not a Fibonacci ratio. It remains common because many market participants watch the midpoint of a prior swing.
| Level | Common interpretation | Reading caution |
|---|---|---|
| 23.6% | Shallow pullback inside a strong prior move. | Can be too shallow to separate reaction from normal noise. |
| 38.2% | Moderate retracement that often attracts attention during trending moves. | Needs surrounding structure before it can be treated as meaningful. |
| 50% | Midpoint of the measured swing, widely watched even though it is not a Fibonacci ratio. | Can become overemphasized because it looks clean on a chart. |
| 61.8% | Deep retracement often treated as an important reference area. | A deep pullback can also signal that the prior move is losing control. |
| 78.6% | Very deep retracement near the edge of the measured swing. | Often requires extra caution because the original swing may be close to full failure. |
The levels should be read as areas rather than exact price lines. In liquid markets, price may overshoot, undercut, or pause around a level without giving a clean answer immediately.
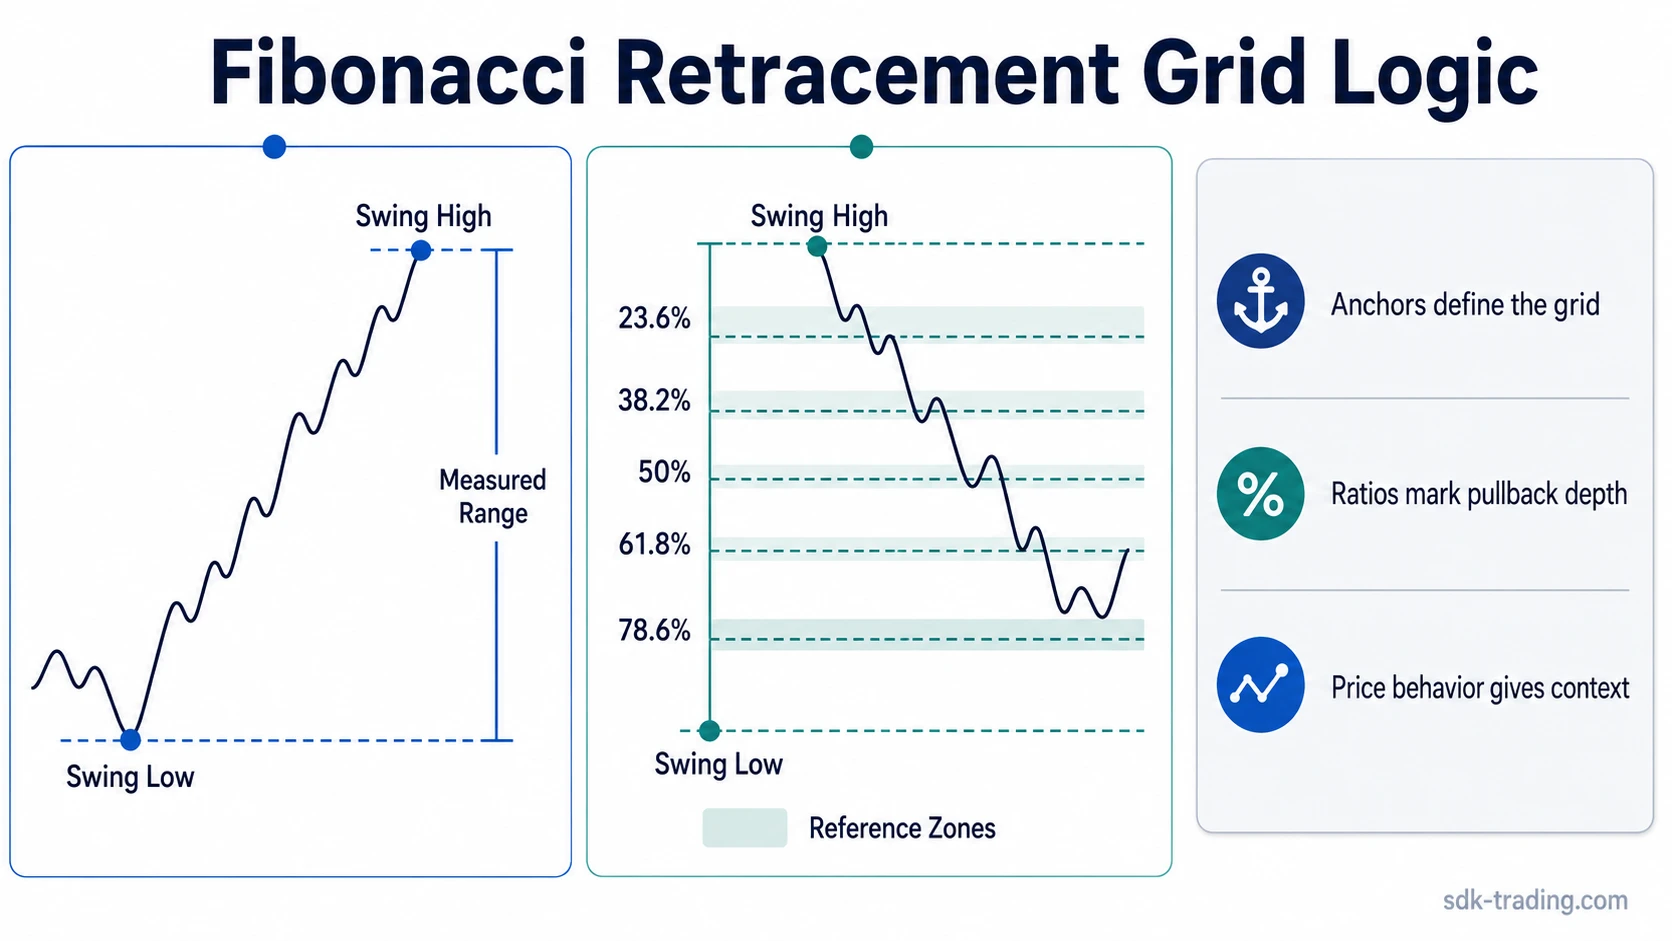
How Fibonacci Retracement Is Calculated
The calculation begins with two anchor points: the swing high and the swing low. The distance between those points is the measured range. Each retracement level is then placed at a percentage of that range.
Calculation logic: Swing range = swing high – swing low. In an upmove, retracement levels are found by subtracting a percentage of the range from the swing high. In a downmove, retracement levels are found by adding a percentage of the range to the swing low.
| Measured move | Level direction | Formula logic |
|---|---|---|
| Advance from swing low to swing high | Levels are drawn below the swing high. | Swing high – (range x retracement percentage) |
| Decline from swing high to swing low | Levels are drawn above the swing low. | Swing low + (range x retracement percentage) |
A simple example is a move from 100 to 150. The range is 50 points. A 38.2% retracement of that advance is 150 – 19.1, or 130.9. That value marks a proportional pullback zone inside the earlier advance.
How Traders Read the Grid
The grid is usually placed after a visible directional move. In an advance, retracement levels sit below the swing high and help organize possible pullback depth. In a decline, the same logic is inverted, and the levels sit above the swing low as possible rebound areas.
The useful question is not whether price touched a ratio. The better question is whether the market treats the area as meaningful. A level that attracts a pause, rejection, failed acceptance, or repeated test has more diagnostic value than a level price crosses without hesitation.
Retracement readings also become more useful when they align with visible market structure. A ratio near a prior support area, prior resistance area, range boundary, or well-defined reaction zone is easier to evaluate than an isolated number in the middle of unclear price action.
Simple Fibonacci retracement example: Price advances from a clear swing low into a clean swing high, then pulls back toward the 38.2% area. The level touch alone is incomplete. The reading becomes more defensible if price pauses near the area, then either holds the zone or fails to reclaim it after a test. The reading weakens if price moves through several levels without any visible reaction, or if the original anchors were chosen from a crowded, unclear swing.
Clean, Weak, and False Fibonacci Readings
A retracement grid can look precise even when the underlying reading is weak. The main difference between a useful reading and a false-positive reading is not the ratio itself. It is the quality of the swing, the location of the level, and the behavior that follows.
A false-positive reading usually begins when the ratio is treated as evidence before the market has accepted, rejected, or repeatedly tested the area.
| Reading type | What it looks like | Interpretation boundary |
|---|---|---|
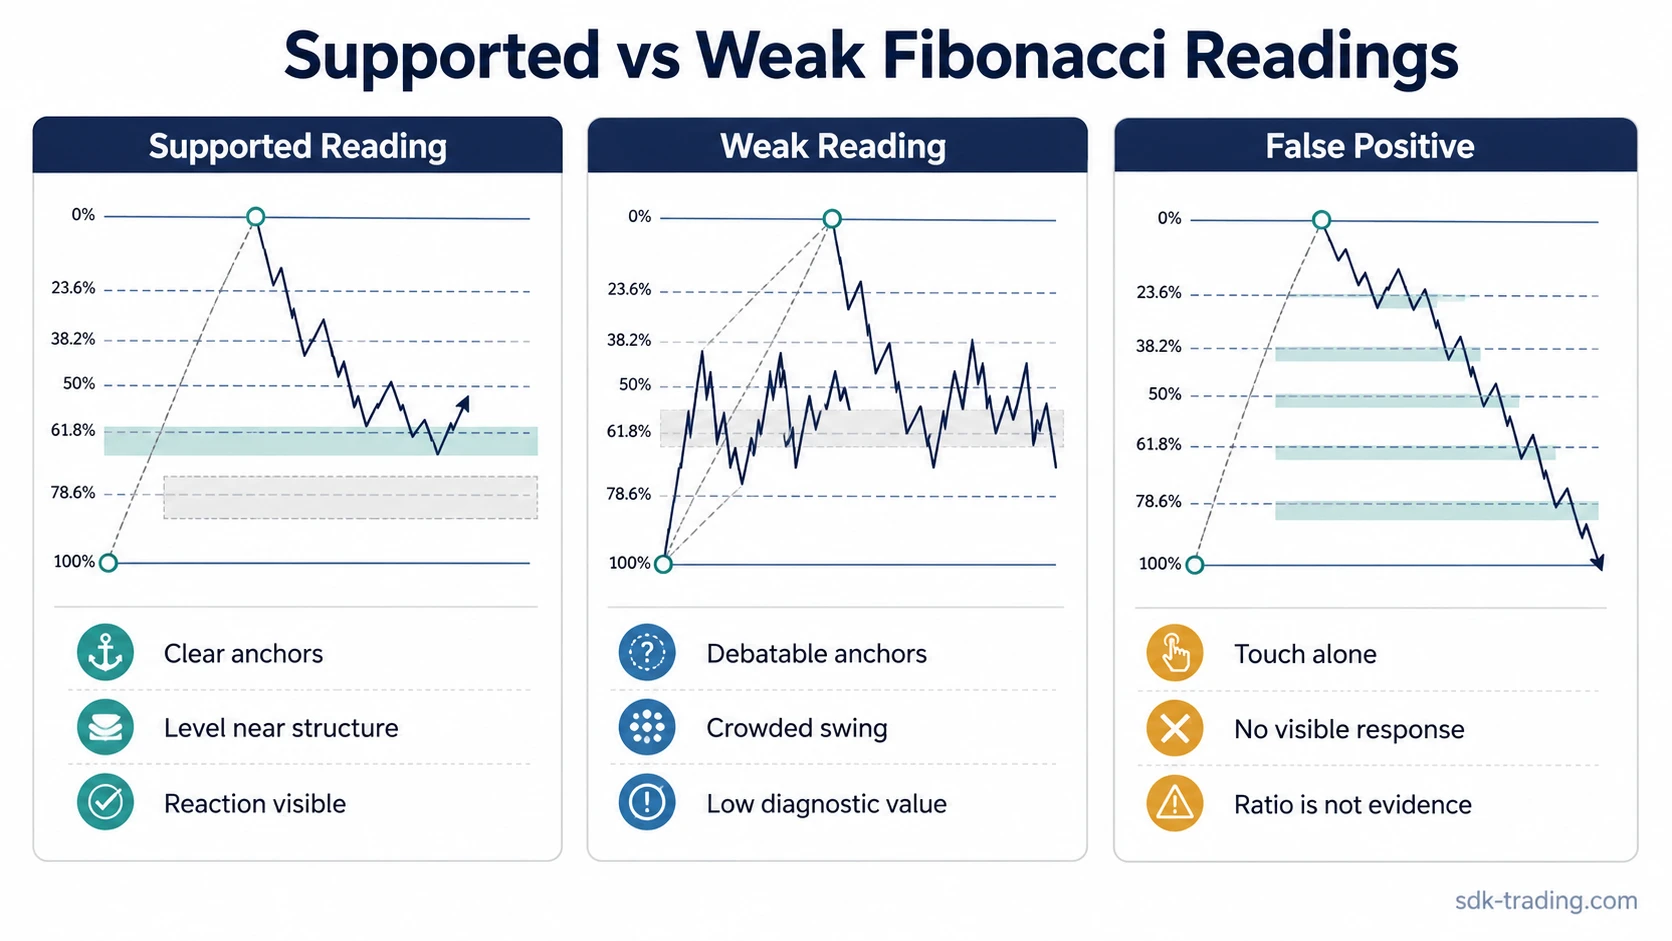
| Clean reading | The swing high and low are obvious, the grid aligns with visible structure, and price behavior changes near a level. | The level is a useful reference zone, but still not a prediction. |
| Weak reading | The anchors are debatable, the swing is crowded, or the level sits in the middle of noisy price action. | The grid may describe the chart, but the reading has limited diagnostic value. |
| False-positive reading | Price touches a ratio, but the market ignores the area or moves straight through several levels. | The ratio touch should not be treated as evidence of support or resistance by itself. |
A common mistake is treating the ratios as magic numbers. The grid can organize the chart, but price behavior around the zone must do the interpretive work.
Fibonacci Retracement vs Fibonacci Extension
Fibonacci retracement measures pullback depth inside a completed swing. Fibonacci extension levels project beyond the measured swing after price moves outside the original range.
The distinction matters because the two tools answer different chart questions. Retracement asks how much of a prior move has been given back. Extension asks where price could be measured after it has already moved beyond the prior swing boundary.
Limitations of Fibonacci Retracement
Fibonacci retracement is sensitive to anchor selection. Two traders can draw different grids on the same chart if they choose different swing highs and lows. This is not a small detail; the entire level structure changes when the anchors change.
Choppy markets create another problem. When price overlaps repeatedly, many swings can appear valid, and several retracement grids can be drawn at once. The result is often level clustering rather than clarity.
Main limitation: Fibonacci retracement is most useful when it organizes a clear swing. It becomes weaker when the swing is unclear, the market is range-bound, or the interpretation depends only on a ratio touch.
Hindsight bias is also common. A grid can be adjusted after the reaction to make the level look more accurate than it was in real time. A safer reading starts with visible anchors first, then evaluates how price behaves around the resulting levels.
FAQ
What is Fibonacci retracement in trading?
Fibonacci retracement is a technical-analysis tool that maps proportional pullback levels between a swing high and a swing low. The levels are used as reference zones for possible support or resistance during a correction.
What are the main Fibonacci retracement levels?
The common levels are 23.6%, 38.2%, 50%, 61.8%, and 78.6%. The 50% level is widely used by traders, although it is not a Fibonacci ratio.
Does Fibonacci retracement predict reversals?
No. A retracement level does not predict that price must reverse. The level becomes more useful only when anchor quality, nearby structure, and later price behavior support the reading.