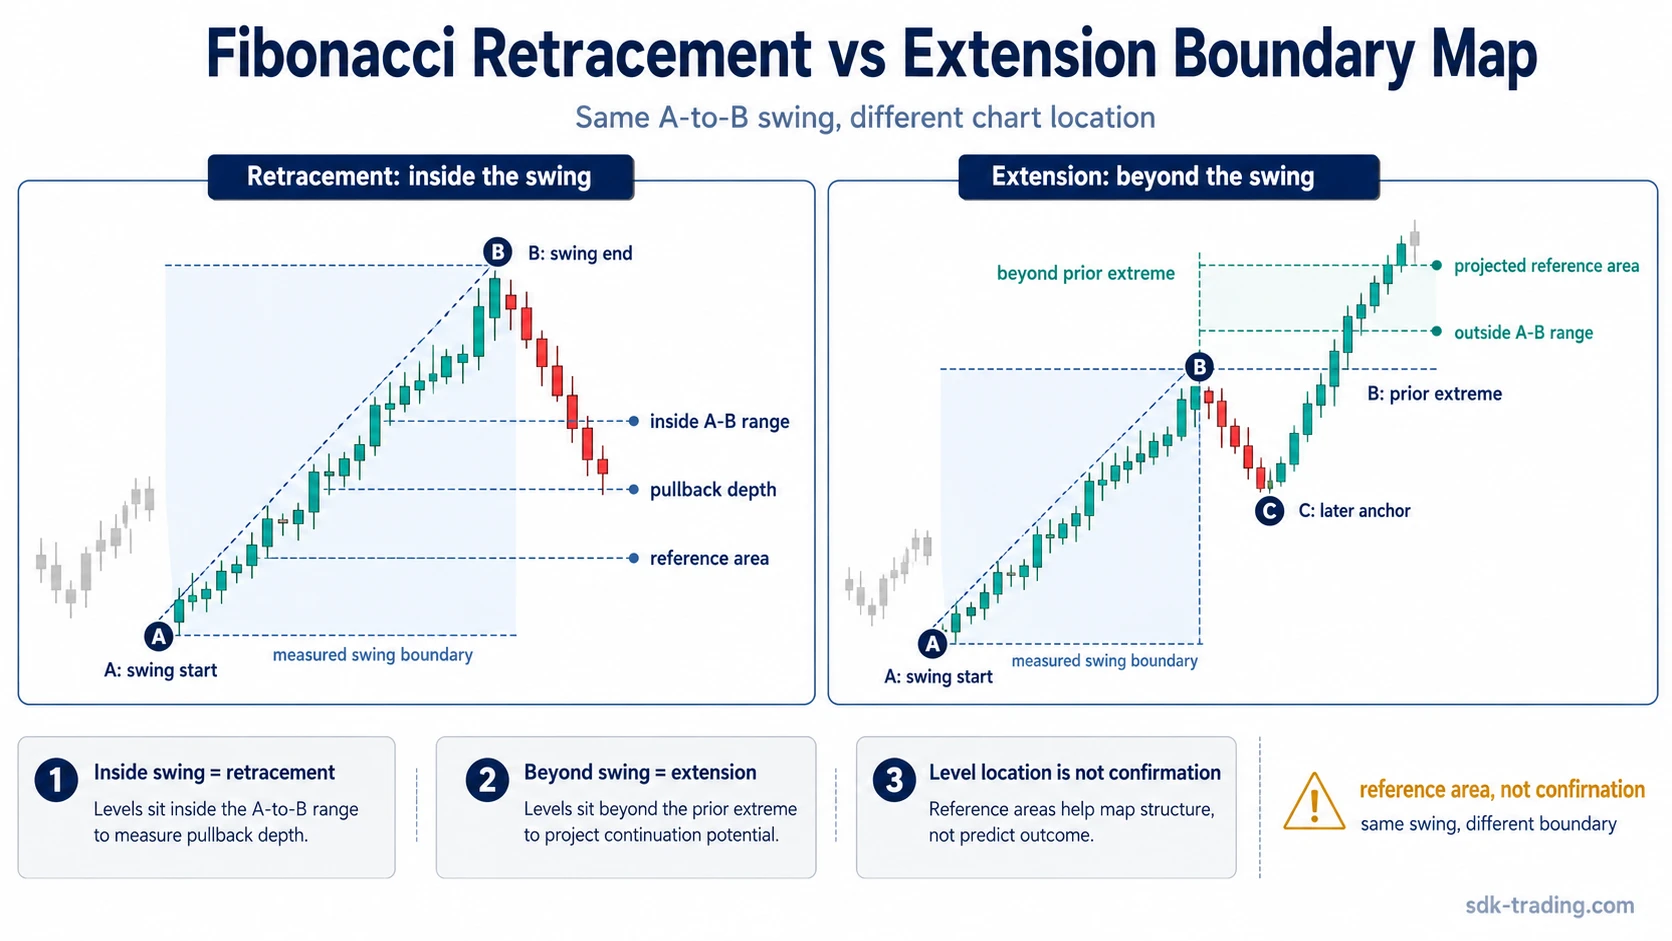
Fibonacci retracement vs extension is mainly a chart-location distinction: retracement measures pullback depth inside a prior swing, while extension projects proportional levels beyond that swing after price moves past the prior extreme.
Definition: A Fibonacci retracement is used inside a measured swing to describe pullback depth. A Fibonacci extension is used beyond a measured swing to describe projected reference areas after expansion beyond the prior extreme.
The confusion comes from the shared ratio family. The same ratio language can appear on both tools, but the chart boundary is different: retracement works inside the A-to-B range, while extension works outside it.
Key Points
- Retracement describes pullback depth inside the measured swing.
- Extension describes projected levels beyond the measured swing.
- Neither tool confirms a reaction by itself; later chart behavior has to support the reading.
Fibonacci Retracement vs Extension: The Core Difference
A Fibonacci retracement starts with a completed swing and divides the distance inside that swing into proportional pullback areas. In an upward swing from A to B, retracement levels sit below B and above A. In a downward swing, they sit inside the measured decline.
A Fibonacci extension starts from a measured swing and projects levels beyond the prior extreme. In an upward expansion, extension levels sit above B. In a downward expansion, they sit below the prior low.
The practical distinction is where the level sits on the chart. Retracement asks, “How deep is the pullback inside the prior move?” Extension asks, “Where might proportional levels sit if price expands beyond the prior move?”
Fibonacci Retracement vs Extension Criteria Table
| Criterion | Fibonacci retracement | Fibonacci extension |
|---|---|---|
| Primary question answered | How far has price pulled back inside the prior swing? | Where might proportional levels sit after price moves beyond the prior swing? |
| Chart location | Inside the measured A-to-B range. | Outside the measured A-to-B range. |
| Anchor relationship | Usually uses the swing high and swing low that define the prior move. | Usually uses a measured swing and a later anchor to project beyond the prior extreme. |
| Typical chart phase | Pullback, pause, or reaction within a prior move. | Expansion, continuation, or movement beyond the prior extreme. |
| What it can suggest | Possible areas where a pullback may be evaluated. | Possible projected areas beyond the prior swing boundary. |
| What it cannot confirm | It cannot confirm that the pullback has ended. | It cannot confirm that price will continue to a projected level. |
| Best follow-up concept | Use the retracement concept when the main question is pullback depth. | Use the extension concept when the main question is projection beyond the prior extreme. |
Same Swing, Different Meaning
Consider a clean upward swing from point A to point B. After B forms, price pulls back into the A-to-B range. That movement is a retracement situation because the chart is still working inside the prior swing boundary.
If price later recovers and trades beyond B, the question changes. The old A-to-B range is no longer only a pullback frame; it can also become a measurement base for extension levels beyond the prior high.
Example: Price advances from A to B, then pulls back toward the middle of that range. A retracement lens compares the pullback against the original swing. If price later reclaims B and expands beyond it, an extension lens compares the new movement against proportional areas beyond B. The same ratio family is involved, but the boundary has shifted from inside the swing to beyond the swing.
This is why a retracement and an extension should not be treated as interchangeable markings. One describes a reaction inside the measured move; the other describes a projection outside it.
When the Distinction Becomes Weak
The distinction weakens when the measured swing is unclear. If several possible highs and lows could be used as anchors, the resulting levels may reflect drawing choice more than a clean market structure.
Crowded levels can also reduce clarity. When several overlapping measurements create many nearby lines, the chart may look precise while the actual reading becomes less useful.
Limitation: Fibonacci levels are reference areas, not confirmation. A reading becomes less reliable when anchors are chosen after the reaction, when levels are crowded, or when price has not shown later acceptance or rejection around the area.
Common Mistakes
| Mistake | Why it creates confusion | Cleaner interpretation |
|---|---|---|
| Treating extension as a guaranteed destination | The projected level can start to look like a certainty instead of an area to evaluate. | Use extension levels as conditional areas, not as proof of continuation. |
| Treating retracement as confirmation | A pullback reaching a ratio does not prove that the prior direction has resumed. | Separate level location from later chart behavior around that level. |
| Drawing the tool after the reaction | Hindsight placement can make almost any level look meaningful. | Prefer clearly defined anchors that were visible before the reaction was complete. |
| Mixing measurements from different swings | Retracement and extension markings can overlap without answering the same question. | Identify which swing is being measured before interpreting the level. |
Which Tool Fits Which Question?
Use a retracement lens when price is still inside the prior measured swing and the question is pullback depth. Use an extension lens when price has moved beyond the prior extreme and the question is where proportional areas sit outside the original swing.
Projected level tools are clearer when the chart question is specific. For example, Camarilla pivots also organize possible support and resistance areas, but they come from a different calculation framework rather than the same A-to-B swing measurement.
Clean decision rule: If the level is inside the measured swing, think retracement. If the level is beyond the measured swing, think extension. If the anchors are unclear, the reading should stay provisional.
FAQ
Can Fibonacci retracement and extension be used on the same swing?
Yes. A retracement can describe a pullback inside the original swing, and an extension can describe projected reference areas beyond the same swing after price moves past the prior extreme.
Is a Fibonacci extension just a retracement above 100%?
No. A level above 100% may look similar on a chart, but the tool’s job is different. Retracement describes movement inside the prior swing; extension projects beyond that boundary.
Which comes first, Fibonacci retracement or extension?
A retracement reading usually comes first when price pulls back inside a completed swing. An extension reading becomes relevant only when price expands beyond the prior extreme or when a projection beyond the measured swing is being evaluated.