SMA vs EMA compares two moving averages that read the same price history in different ways. A simple moving average weights every price in the lookback period equally, while an exponential moving average gives more influence to recent prices.
That weighting difference changes the line on a chart. SMA usually gives a steadier reference, while EMA moves closer to recent price behavior more quickly. The added sensitivity can also make EMA more exposed to short bursts of noise.
The useful question is not which average is universally better. The cleaner question is which reading risk matters more: delayed response from a smoother line, or overreaction from a faster line.
Key Points
- SMA gives equal weight to each price in the selected lookback period.
- EMA leans toward the latest prices, so recent movement affects the line more quickly.
- SMA can provide a steadier trend reference, but it may respond late.
- EMA can highlight recent pressure sooner, but it may react to noise.
- The same period number does not make SMA and EMA interchangeable.
SMA vs EMA: The Short Answer
SMA is the steadier average; EMA is the more reactive average. Both use price history, but they do not summarize that history the same way.
SMA treats each price in the window as equally important. If the average uses 20 periods, the oldest price in that 20-period window still has the same basic weight as the newest price.
EMA places more weight on recent prices. The line can move closer to current price action faster, especially when the latest candles move away from the prior average.
Core distinction: SMA smooths by treating the whole window evenly. EMA adapts faster because recent prices influence the average more heavily.
SMA vs EMA Comparison Table
The main difference is not only speed. The weighting method changes lag, smoothness, noise exposure, and the kind of chart-reading question each average answers best.
| Comparison point | SMA | EMA | Reading implication |
|---|---|---|---|
| Weighting method | Equal weight across the selected period | More weight on recent prices | The same lookback number can produce different line behavior |
| Responsiveness | Usually slower to turn | Usually faster to turn | EMA often reflects recent pressure sooner |
| Smoothness | Usually smoother | Usually less smooth | SMA can reduce short-term chart noise more clearly |
| Lag | More lag in fast changes | Less lag than SMA with the same period | Neither removes lag; EMA only reduces part of it |
| Noise risk | Lower sensitivity to minor moves | Higher sensitivity to minor moves | EMA can overreact when price chops around the average |
| Primary reading role | Broad trend reference | Recent-price pressure reference | The choice depends on whether smoothing or sensitivity matters more |
How SMA Weights Price
A simple moving average adds the selected prices and divides by the number of periods. Because each price carries equal weight, the line changes gradually as old prices leave the window and new prices enter it.
This makes SMA useful as a smoother structural reference. It can help separate a broad directional tendency from a small burst of movement, but that smoothness also means the line can lag when the market changes quickly.
How EMA Weights Price
An exponential moving average updates with greater emphasis on the most recent prices. The older data still matters, but the newest prices have more influence on the next value.
This makes EMA more sensitive to recent pressure. The benefit is faster adjustment. The cost is that quick adjustment can respond to temporary movement that later fades.
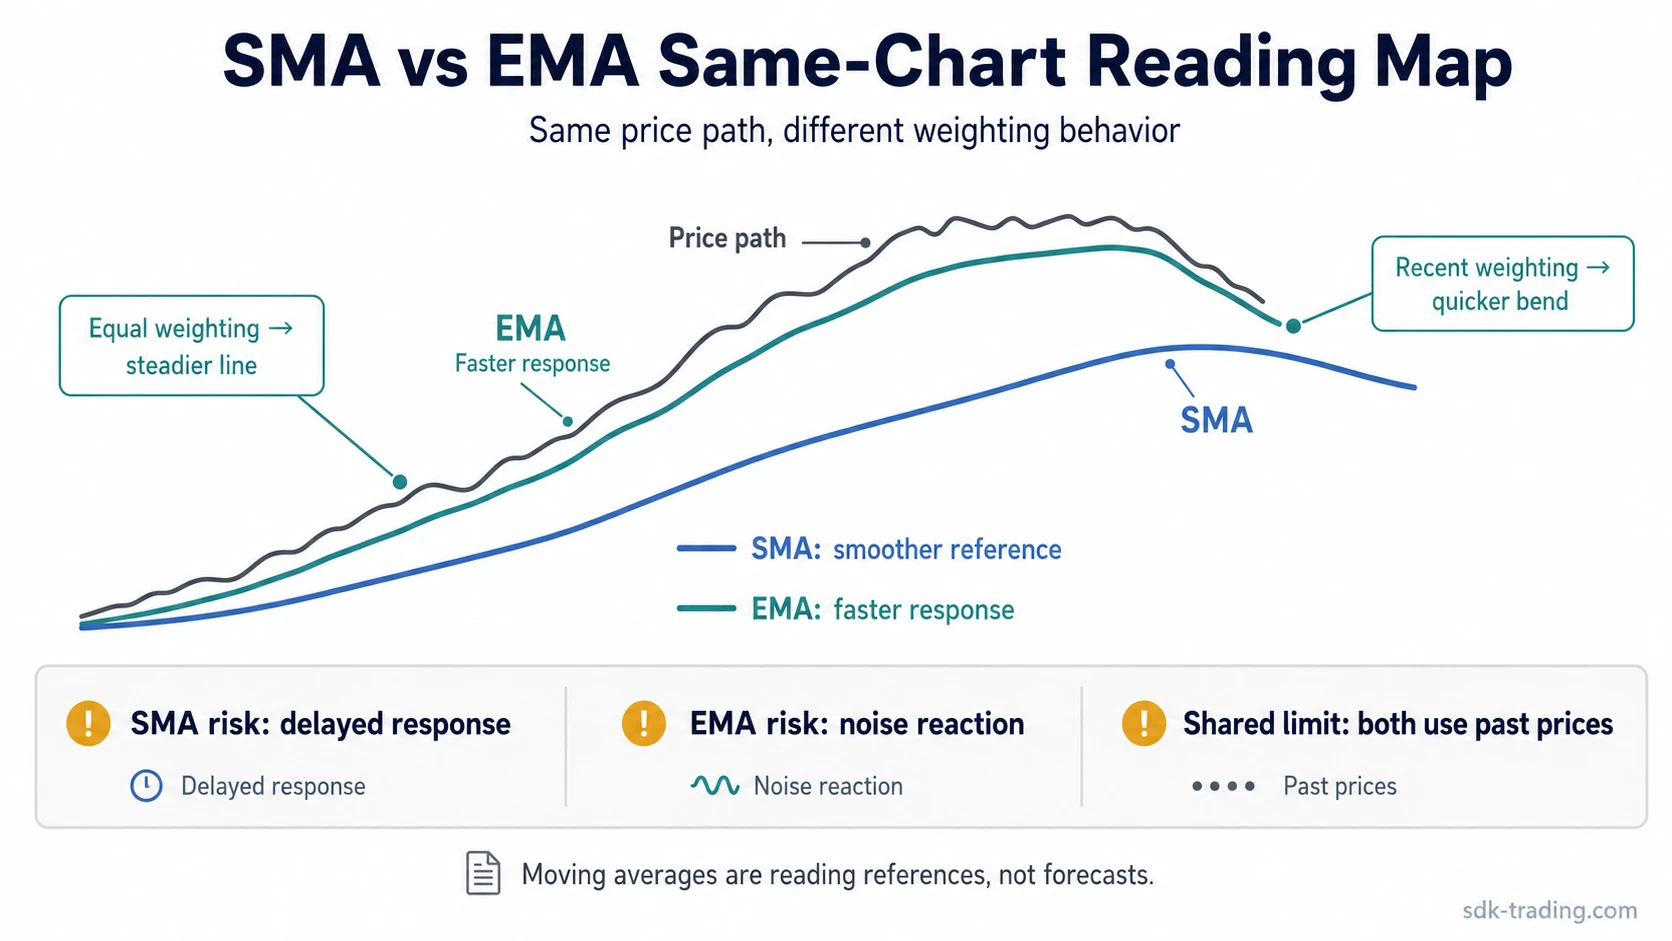
Same Chart, Different Reading
Price can rise in a steady trend, pause, then begin turning lower. On that same price path, SMA may still describe the broader trend as intact because the earlier prices inside the window continue to smooth the line.
EMA may bend sooner because the latest prices carry more weight. That faster bend can highlight recent weakness earlier, but it does not prove that the broader trend has already changed.
Same-scenario example: Price advances above a rising average, then begins closing closer to the line after several weaker candles. The SMA may remain smoother and still point upward because earlier prices continue to shape the window. The EMA may flatten or turn sooner if the latest closes fail to hold the prior push. The difference does not make one line correct and the other wrong; each line is answering a different chart-reading question.
When SMA Can Be Clearer
SMA can be clearer when the main need is a stable trend reference. Because it reacts more slowly, it can filter out some movement that would make a faster average bend too often.
That steadiness is useful only when delay is acceptable. If price changes sharply and the older data inside the lookback window no longer represents current behavior well, SMA can stay too calm for too long.
When EMA Can Be Clearer
EMA can be clearer when the main need is to monitor recent-price pressure. Because it gives more influence to the latest prices, it may adjust faster when the character of the move begins to change.
That speed is not automatically better. In choppy conditions, EMA may bend repeatedly without giving a stable reading. A faster line can reduce lag while increasing the chance of reacting to noise.
Reading Risk: Delay or Overreaction?
The stronger comparison is not “SMA or EMA.” It is the trade-off between a slower, smoother reference and a faster, more sensitive reference.
| Reading need | SMA lens | EMA lens | Risk to watch |
|---|---|---|---|
| Smoother trend reference | Stronger | Weaker | The response may be late |
| Faster recent-price response | Weaker | Stronger | The line may react to noise |
| Sideways market | Weak | Weak | Both can whipsaw around price |
| Same-period comparison | Broad window view | Recent-weighted view | The same number can still mean different information |
Common Mistake: Same Period Does Not Mean Same Information
A 20-period SMA and a 20-period EMA do not tell the same story just because both use the number 20. The lookback number defines the window, but the weighting method defines how the line reacts inside that window.
A 20-period SMA treats the prices in the window evenly. A 20-period EMA leans more heavily toward the latest prices. When price begins moving away from its prior path, that difference can make the EMA shift sooner while the SMA remains closer to the broader average.
Common mistake: Treating SMA and EMA as interchangeable because the period number matches. The period is only one input; the weighting method changes the interpretation.
Limitations of Both SMA and EMA
Both averages are lagging indicators because both are built from past prices. EMA can reduce some lag compared with SMA, but it cannot remove lag entirely.
Both averages can also give poor readings when price moves sideways. In a range, price may cross back and forth around either line, making smoothness and responsiveness less useful than the surrounding market structure.
| Limitation | Why it matters | Safer interpretation |
|---|---|---|
| Lag remains | Both averages use past prices | Treat the line as a delayed reference, not a forecast |
| Period sensitivity | Changing the lookback changes the line | Compare the average with the market condition being read |
| Sideways whipsaw | Price can cross either line repeatedly | Check whether structure is trending or rotating before emphasizing the average |
| EMA noise risk | Recent prices can pull the line quickly | Separate meaningful pressure from temporary movement |
| SMA delay risk | Equal weighting can keep the line slow | Recognize when old data inside the window may be stale |
Which Is Better, SMA or EMA?
SMA can fit better when the chart-reading need is smoothing. EMA can fit better when the chart-reading need is faster sensitivity to recent price behavior.
Neither average is automatically superior. The better fit depends on the market condition, the lookback period, and whether the bigger risk is reacting too late or reacting too quickly.
FAQ
What is the main difference between SMA and EMA?
SMA weights each price in the selected period equally. EMA gives more influence to recent prices, so it usually reacts faster than SMA with the same period.
Is EMA more accurate than SMA?
EMA is more responsive, but more responsive does not always mean more accurate. In choppy conditions, EMA can react to noise while SMA may provide a smoother reference.
Why do SMA and EMA look different with the same period?
The period number defines the lookback window, but the weighting method changes the line. A 20-period SMA and a 20-period EMA can behave differently because EMA gives more weight to recent prices.
Can SMA and EMA both be useful on the same chart?
Yes. SMA can help frame the smoother average path, while EMA can highlight recent-price pressure. The comparison becomes weaker if both lines are treated as identical signals.