Parabolic SAR is a price-and-time trend-following overlay that plots dots above or below price to show where the indicator’s active trailing path is positioned.
The dots usually trail below price during an upward sequence and above price during a downward sequence. As the move extends, the calculation can tighten toward the latest extreme, which makes the dots move closer to price until the SAR path resets.
Parabolic SAR describes a trailing price-and-time path; it does not measure trend strength, momentum, volume, or volatility on its own.
Definition: Parabolic SAR stands for Parabolic Stop and Reverse. In technical analysis, the phrase describes the indicator’s internal switch from one trailing direction to the other when price crosses the calculated SAR level. It should be read as indicator logic, not as a full decision framework.
Key Points
- Parabolic SAR plots dots around price instead of drawing a moving-average line.
- Dots below price reflect an upward trailing sequence; dots above price reflect a downward trailing sequence.
- The calculation accelerates as new extremes appear, which can make the dots tighten toward price.
- Repeated dot flips inside a sideways range usually weaken the reading because the SAR path keeps resetting without directional persistence.
What Parabolic SAR Is
Parabolic SAR is a trend indicator built around a trailing price-and-time path. Its main visual feature is simple: a series of dots appears on one side of price, then can switch to the other side when the calculated trailing level is crossed.
The indicator is called “parabolic” because the trailing path can curve more sharply as the move develops. The acceleration is part of the calculation, not a forecast that price must continue in the same direction.
The cleanest use of the indicator is descriptive. It identifies where the SAR path sits relative to price, how quickly that path is tightening, and whether the dots stay on one side long enough to reflect persistence.
How Parabolic SAR Works
Parabolic SAR updates from the prior SAR value, the most recent extreme point in the active direction, and an acceleration factor. The calculation moves the SAR level closer to price as the directional move extends.
| Mechanism element | What it means | Why it affects the dots |
|---|---|---|
| Prior SAR | The previous calculated SAR level. | It gives the next dot a starting reference instead of recalculating from nothing. |
| Extreme point | The highest high in an upward sequence or the lowest low in a downward sequence. | A new extreme gives the formula a farther point to move toward. |
| Acceleration factor | The multiplier that controls how quickly SAR moves toward the extreme point. | A higher factor makes the dots tighten faster, which increases sensitivity. |
| Maximum acceleration | The cap that prevents the acceleration factor from increasing indefinitely. | It limits how aggressive the tightening can become during an extended move. |
| Reset behavior | The SAR path switches when price crosses the calculated level. | The dots move to the opposite side of price and begin a new trailing sequence. |
A plain-English reading is enough for most chart interpretation: the longer a directional move keeps producing new extremes, the more the SAR path tends to tighten. When price crosses that path, the dots flip to the other side and start a new sequence.
How To Read Parabolic SAR Dots
Dots below price indicate that the active SAR path is trailing underneath the move. Dots above price indicate that the active path is trailing from above. Dot position is the first observation; the quality of the sequence depends on how price behaves around the dots.
| Dot behavior | Possible reading | Boundary |
|---|---|---|
| Dots remain below price while price keeps making higher extremes | The upward trailing sequence is persistent. | Persistence is not the same as trend strength; SAR does not measure strength on its own. |
| Dots remain above price while price keeps making lower extremes | The downward trailing sequence is persistent. | The dots describe the active SAR path, not a guaranteed continuation. |
| Dots tighten rapidly toward price | The acceleration factor is pulling the SAR path closer to the latest extreme. | Tighter dots can make the indicator more sensitive to short reversals or noise. |
| Dots flip from one side of price to the other | The trailing sequence has reset. | A flip is a calculated path change, not a complete reversal argument by itself. |
Distance matters because it changes the margin between price and the trailing path. A wide gap can show that the SAR path is still catching up. A narrow gap can show that the indicator has become more sensitive to a smaller counter-move.
Parabolic SAR Settings and Sensitivity
Many charting platforms expose SAR inputs such as starting acceleration, step or increment, and maximum acceleration. The labels can vary, but the practical trade-off is sensitivity.
| Setting | What it controls | Effect of higher sensitivity | Effect of lower sensitivity |
|---|---|---|---|
| Start | The initial acceleration factor used at the beginning of a sequence. | Dots may begin tightening sooner. | Dots may start with more distance from price. |
| Step / increment | How much the acceleration factor increases when a new extreme appears. | The indicator reacts faster as the move extends. | The indicator adjusts more slowly as the move extends. |
| Maximum | The cap on the acceleration factor. | The SAR path can become more responsive before reaching its cap. | The SAR path is restrained from tightening too aggressively. |
Faster settings can create earlier flips, but they can also increase noise in a compressed market. Slower settings can reduce some flips, but they may trail farther away from price during a real directional change. There is no universal best Parabolic SAR setting that fits every instrument, timeframe, and market condition.
Clean, Weak, and Invalid Parabolic SAR Readings
The quality of a Parabolic SAR reading depends on more than whether dots are above or below price. Persistence, spacing, compression, and reset behavior determine whether the dot sequence is clean, weak, or misleading.
| Reading quality | What appears on the chart | Interpretation boundary |
|---|---|---|
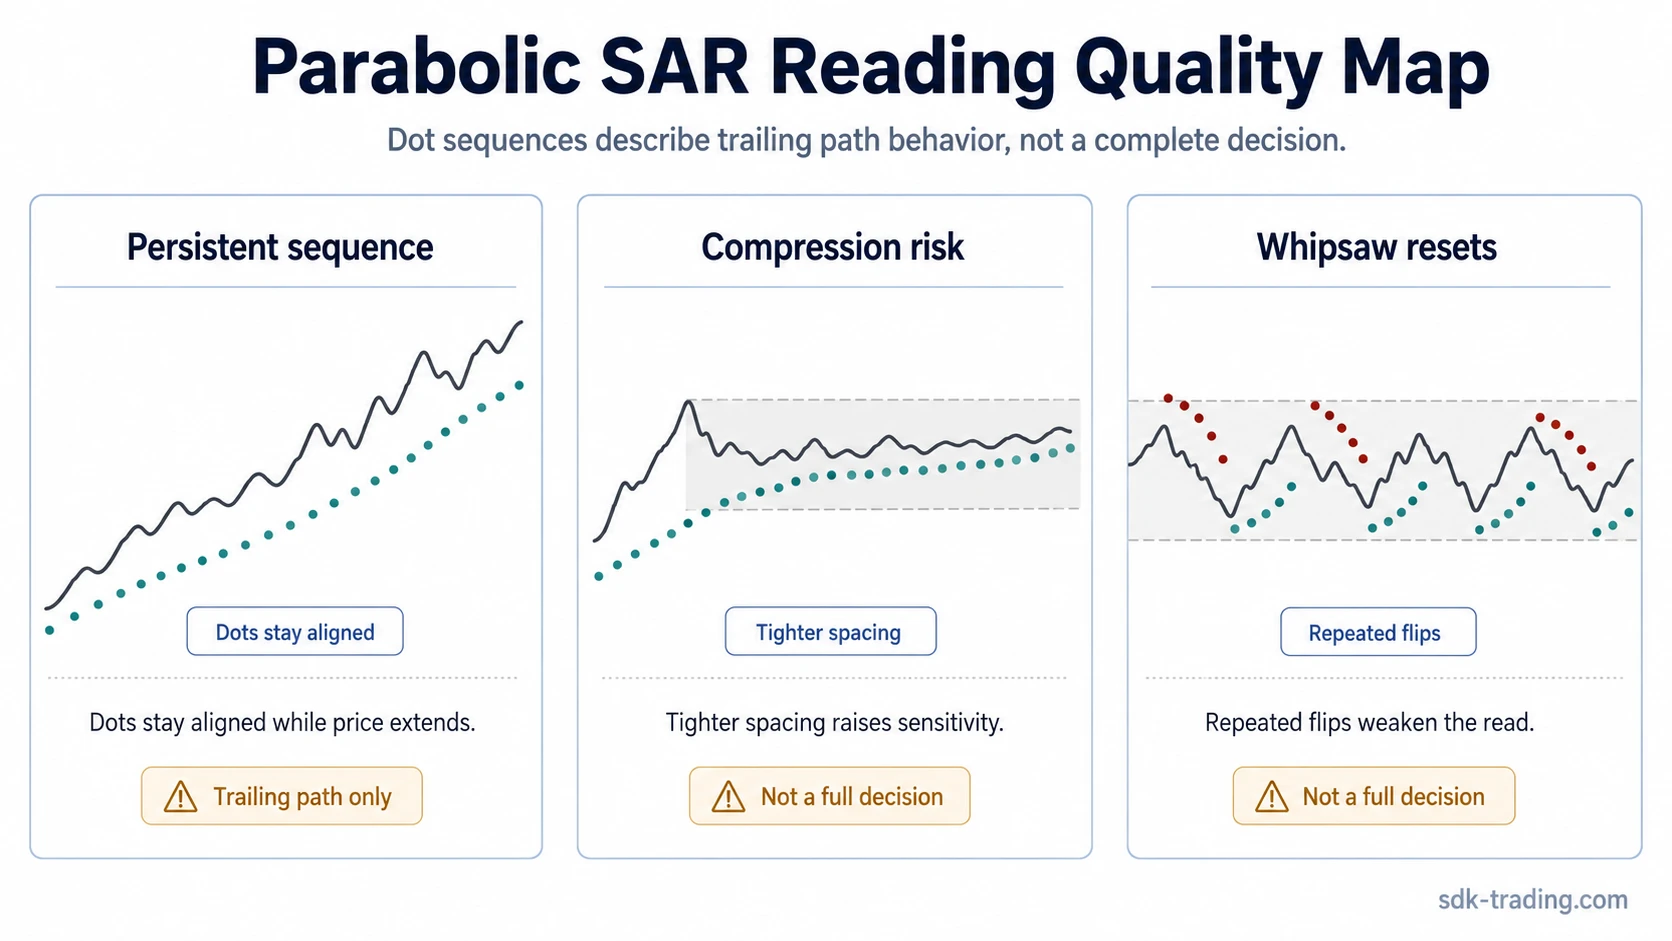
| Clean persistence | Dots stay on one side of price while price continues to extend in the same direction. | The SAR path is aligned with directional persistence, but trend strength still needs separate evidence. |
| Weak compression | Dots move closer to price while price loses range expansion or begins to overlap previous bars. | The indicator is becoming more sensitive while directional quality is becoming less clear. |
| Invalid whipsaw | Dots alternate above and below price inside a sideways or choppy range. | The SAR path is resetting without durable direction, so the dot flips carry lower interpretive value. |
Parabolic SAR example in context: Price moves sideways after a prior directional advance. The first SAR flip places dots above price, but price does not continue lower and soon crosses back above the new SAR path. A second flip then places dots below price, yet price fails to hold above the upper side of the range. The repeated switches show a SAR path caught between failed lower acceptance and failed upper continuation, rather than a clean directional read.
What Parabolic SAR Does Not Measure
Parabolic SAR is not a moving average. An SMA smooths price over a chosen lookback period, while SAR plots a trailing price-and-time path that can accelerate toward an extreme point.
Parabolic SAR is also not a momentum oscillator. MACD works from moving-average relationships and momentum-style convergence or divergence, while SAR focuses on where the trailing path sits around price.
The distinction matters because a dot sequence can look orderly even when momentum is fading or trend strength is uncertain. SAR can describe trailing structure, but it does not measure volume, volatility bands, trend strength, or momentum pressure on its own.
Common Parabolic SAR Mistakes
Mistake 1: Treating every dot flip as a full reversal. A flip only says the SAR path has crossed to the other side of price. Directional persistence still depends on what price does after the reset.
Mistake 2: Searching for one perfect setting. Higher sensitivity and lower sensitivity create different trade-offs, especially when market movement changes from directional expansion to sideways compression.
Mistake 3: Ignoring range-bound conditions. Repeated dots above and below price inside a range often reflect whipsaw behavior rather than a useful directional sequence.
Mistake 4: Confusing trailing behavior with trend strength. SAR can show where the trailing path is positioned, but it does not prove that participation, momentum, or volatility structure supports the move.
Parabolic SAR Calculation Boundary
Parabolic SAR is commonly described through a prior SAR value, an extreme point from the active directional move, and an acceleration factor. The practical point is that the SAR path moves toward the active extreme and can tighten as new extremes appear.
Formula boundary: The calculation is useful for understanding why the dots tighten, but the visual reading should still focus on dot position, persistence, reset behavior, and whether price is trending or compressing.
FAQ
What is Parabolic SAR?
Parabolic SAR is a technical indicator that plots dots above or below price to show a trailing price-and-time model. The dots can switch sides when price crosses the calculated SAR level.
What do Parabolic SAR dots mean?
Dots below price usually reflect an upward trailing model, while dots above price usually reflect a downward trailing model. The dot position describes the active model, not a complete trading decision.
How is Parabolic SAR calculated?
Parabolic SAR uses the prior SAR value, an extreme point from the active move, and an acceleration factor. As new extremes appear, the calculation can move the dots closer to price.
What settings does Parabolic SAR use?
Parabolic SAR settings usually include a starting acceleration factor, a step or increment, and a maximum acceleration factor. These settings change sensitivity rather than creating a universal best reading.
Why does Parabolic SAR whipsaw?
Parabolic SAR can whipsaw when price moves sideways or compresses. In that condition, the dots may flip above and below price without a sustained directional move.
Does Parabolic SAR measure trend strength?
Parabolic SAR does not measure trend strength by itself. It shows a trailing price-and-time model, so strength needs separate evidence such as price structure, momentum, volume, or volatility context.