Combining indicators only adds useful information when each tool measures a different role. Stacking several momentum or smoothing tools can make one market condition look like several independent signals.
Definition: Combining indicators means using technical indicators together only when they add separate analytical roles, such as trend condition, momentum state, volatility context, volume participation, or smoothing behavior.
Key Points
- Strong indicator combinations separate roles instead of repeating the same input.
- Same-family agreement can create redundancy, not stronger evidence.
- Conflicting indicators may reflect lag, sensitivity, or different market dimensions.
What Combining Indicators Should Mean
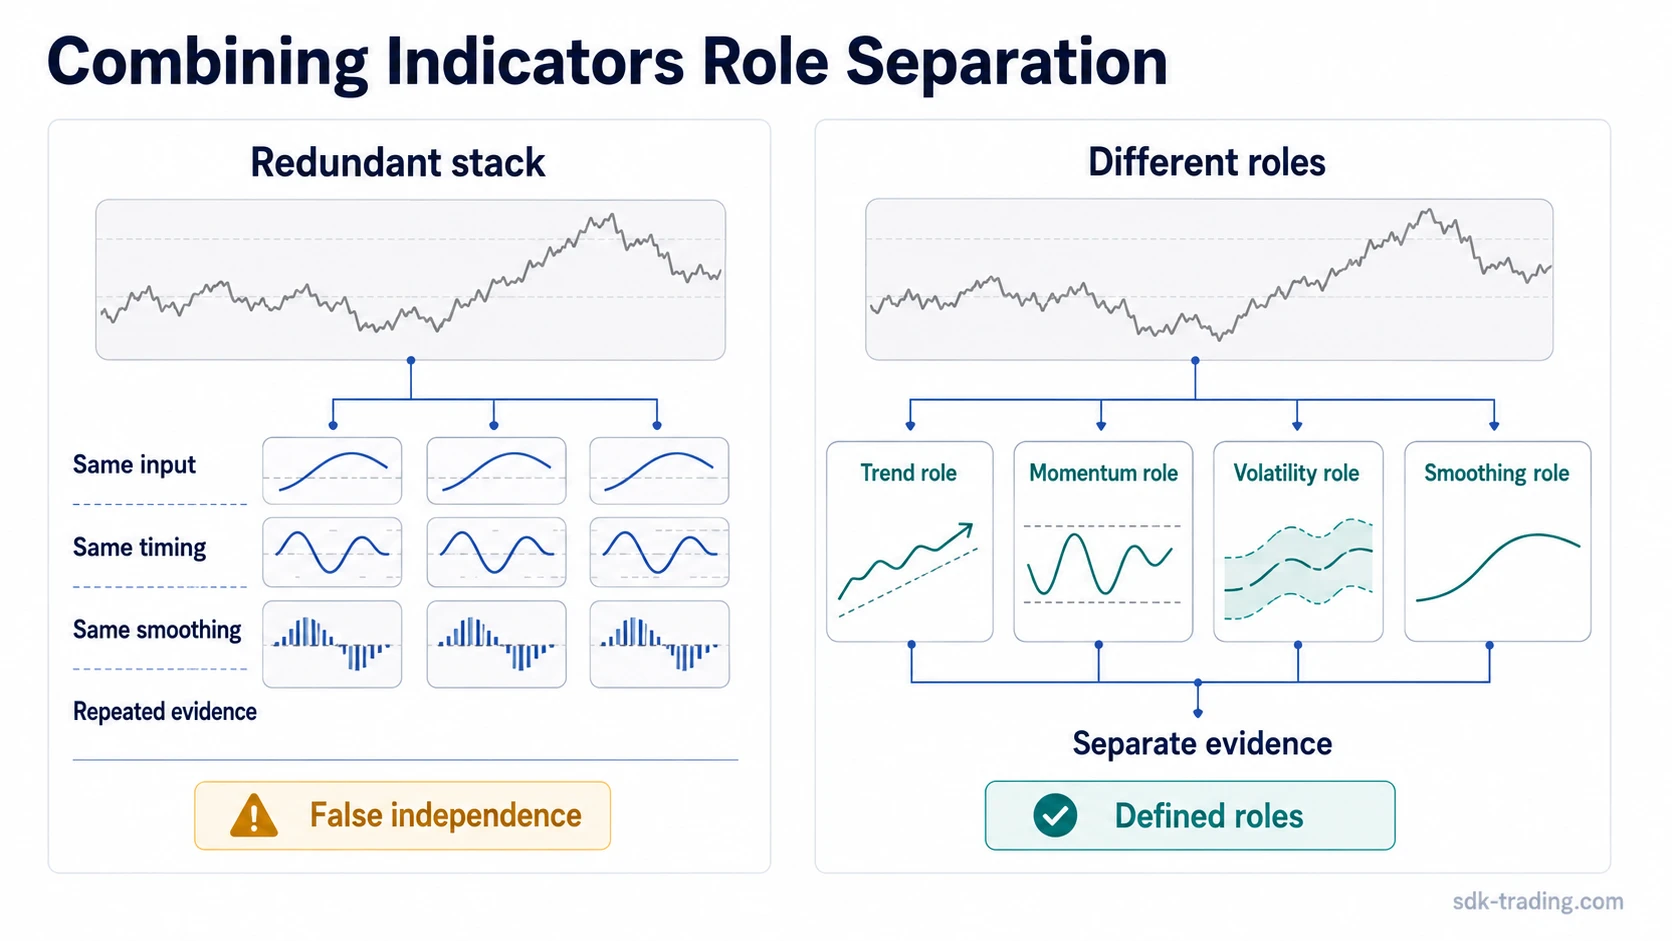
A useful combination starts with the question each tool is supposed to answer. One indicator may describe trend strength, another may describe momentum pressure, and another may frame volatility conditions. The value comes from separating those jobs, not from collecting several similar readings that move together.
Weak combinations often look convincing because the chart becomes visually busy. Three tools can flash similar readings at the same time, but if they all react to the same short-term price acceleration, they may only be repeating one observation through different formulas.
A better stack separates the market state into distinct layers: direction, strength, speed, volatility, participation, and price structure. Agreement matters less than whether each layer adds information that was not already visible from the others.
Not This / Instead This
| Weak combination | Why it can mislead | Stronger interpretation |
|---|---|---|
| Several momentum tools rising together | They may be reacting to the same acceleration. | Separate momentum from trend strength, volatility, or structure. |
| Multiple smoothed trend filters pointing the same way | They can repeat the same lagged price information. | Check whether another tool adds a different role, such as participation or range expansion. |
| Adding more indicators after the reading feels unclear | The chart may gain noise instead of clarity. | Reduce the stack to the specific condition each tool is meant to measure. |
| Treating indicator alignment as proof of direction | Agreement can appear after the move has already expanded. | Compare the indicator reading with price structure and whether the market accepts the new area. |
Indicator Roles That Should Stay Separate
Combining indicators becomes clearer when each tool has a defined role before it appears on the chart. Without that boundary, the stack can turn into a collection of repeated opinions rather than a structured reading.
| Indicator role | What it measures | Combination risk |
|---|---|---|
| Trend condition | Whether the market is directional, range-bound, or losing directional quality. | A trend tool can be mistaken for timing evidence when it only describes state. |
| Trend strength | Whether directional movement is expanding or fading. | A rising strength reading does not automatically describe direction by itself. |
| Momentum state | How quickly price is accelerating or decelerating. | Several momentum tools can overlap because they respond to similar movement. |
| Volatility context | Whether the range is expanding, contracting, or shifting regime. | Volatility expansion can support several interpretations depending on structure. |
| Smoothing / trend filter | How price behaves relative to a smoothed reference. | Smoothing can reduce noise while adding lag. |
| Volume / participation | Whether activity expands, contracts, or diverges from price movement. | Participation adds value only when it changes the read, not when it is used as decoration. |
A trend-strength tool such as ADX is more useful when it is assigned to trend condition rather than treated as a direction call.
A smoothing tool such as the EMA belongs in a different role because it filters price behavior through a moving average and can lag fast changes.
Where Indicator Redundancy Comes From
Redundancy appears when several indicators transform similar price or volume inputs in similar ways. The names may differ, but the information can still be closely related.
Same input family: Indicators built around recent price change can cluster together during fast moves.
Same smoothing logic: Several moving-average-style tools can respond with different speeds while still describing the same underlying price path.
Same timing sensitivity: Fast settings can all react early, while slower settings can all react late.
Same threshold behavior: Multiple tools can cross preset levels after the market has already moved far enough to trigger them together.
The practical problem is false independence. A chart can display three separate indicator panels, but the market may still be offering only one piece of evidence through three related calculations.
When Indicator Agreement Can Still Mislead
Indicator agreement can become weakest when the tools all respond to the same price burst. A momentum cluster may look decisive because every panel turns in the same direction, but that alignment may reflect one shared sensitivity rather than several independent observations.
False-signal scenario: Price accelerates quickly after a quiet range, and several momentum-style indicators react at once. The reading looks stronger than it is because the tools may be responding to the same short-term expansion. A better check asks whether trend strength, volatility behavior, and price acceptance point to the same interpretation from different angles.
Agreement carries more weight when the tools measure different dimensions. It carries less weight when the chart only repeats speed, smoothing, or threshold reactions under different names.
How to Read Conflicting Indicators
Indicator conflict is not always a clean contradiction. A fast momentum tool may turn before a slower smoothing tool because they are designed to react at different speeds. A volatility tool may expand while a trend tool remains unclear because range behavior can change before direction becomes stable.
The safer question is what kind of disagreement exists. Lag-based conflict, sensitivity-based conflict, and role-based conflict mean different things. A slow trend filter may simply be waiting for more price history, while a momentum tool may be reacting to a shorter burst that has not yet changed the broader structure.
Reading boundary: A conflict matters more when two tools are meant to measure the same role but produce different readings. It matters less when each tool is measuring a different dimension of the same market environment.
A Simple Combining Indicators Example
Price has been moving higher, but the advance starts to become uneven near a prior resistance area. A trader sees several momentum tools reacting to the same short-term push. The tempting read is that the agreement adds weight. The weaker possibility is that the tools are repeating the same acceleration.
The important test is whether price holds the newly tested area or quickly slips back into the prior range. Without that acceptance, the indicator stack may be describing acceleration rather than a durable change in structure.
A more structured combination separates the jobs. One tool can assess whether trend strength is expanding, another can frame the smoothed trend path, and a separate volatility or structure check can show whether the market is accepting the new area or only stretching into it.
The diagnostic difference is the source of information. If every tool reacts to the same short-term price speed, the stack is narrow. If the tools separate strength, smoothing, volatility, and structure, the reading becomes more balanced without turning the indicators into a prediction engine.
Common Mistakes When Combining Indicators
Using more indicators to reduce discomfort: Adding tools after the reading feels uncertain can make the chart look more complete while making the decision process less clear.
Stacking similar formulas: Several momentum or smoothing tools can repeat the same information and create false confidence.
Ignoring price structure: Indicator agreement carries less meaning if price is still failing to hold the area the indicators appear to support.
Confusing alignment with independence: Three aligned tools are not automatically three independent observations.
Limits of Combining Indicators
Indicators reorganize market data that already exists. They can make certain conditions easier to see, but they do not create independent proof of future direction. More layers can also add abstraction, especially when each layer introduces smoothing, thresholds, or delayed reactions.
The strongest use is diagnostic. A smaller set of tools with clear roles can be easier to interpret than a large stack where every panel must be reconciled. The aim is not to make every indicator agree. The aim is to know what each tool is measuring and when that measurement stops adding new information.
Limitation: Combining indicators can improve structure in the reading process, but it cannot remove uncertainty, replace price behavior, or turn agreement into certainty.
FAQ
When are combined indicators redundant?
Combined indicators are redundant when several tools react to the same input, smoothing logic, timing sensitivity, or threshold behavior. The chart may look more complete, but the reading may still come from one repeated source of information.
Can too many indicators make analysis worse?
Too many indicators can make analysis less clear when they repeat similar information or create conflicts without a defined role. A smaller role-based set can be easier to interpret.
Why do combined indicators sometimes disagree?
Combined indicators can disagree because they use different inputs, smoothing speeds, thresholds, or sensitivity settings. Disagreement may reflect different measurement roles rather than a simple contradiction.