A moving average strategy is a conditional trading framework that uses an average as a trend filter, price-location reference, and signal-quality check. The average is only one input; the reading depends on trend state, slope, spacing, structure response, and the point where the interpretation would weaken.
The strongest use of a moving average is not prediction. It smooths price so the market’s current position can be compared with its recent path. That comparison becomes more useful when the average agrees with the surrounding structure instead of fighting it.
Definition: A moving average strategy organizes moving-average evidence into a sequence: identify the market state, choose the average type, read slope and spacing, compare price location, check structural response, and define what would make the reading unstable.
Key Points
- A moving average can help frame trend direction, price location, and pullback quality.
- Slope and spacing matter more than a single touch or crossover.
- A flat or crowded average often reflects a market without clear directional structure.
- Price far from the average can signal extension, not automatic continuation.
- Risk boundaries belong to the process because the reading must weaken under specific conditions.
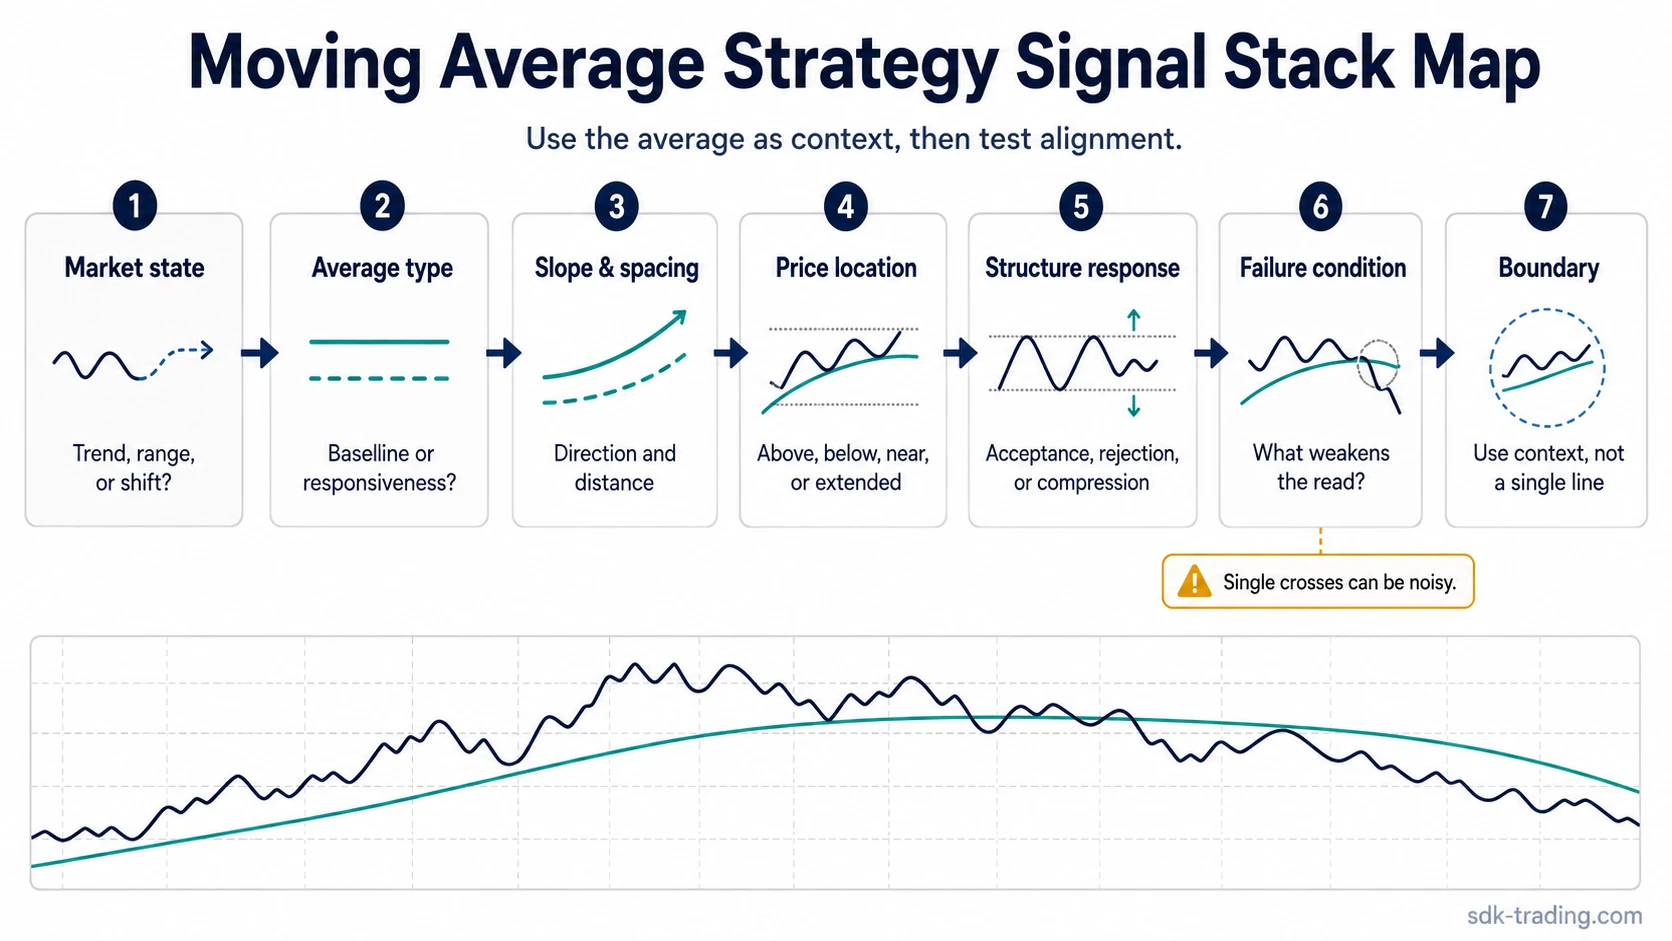
The Moving Average Strategy Signal Stack
The signal stack puts moving-average evidence in order. Each step narrows the interpretation before the average is treated as useful context.
| Step | What it checks | Constraint | Failure mode | Interpretation boundary |
|---|---|---|---|---|
| 1. Market state | Whether price is trending, ranging, or shifting regime | The average should match the visible structure, not replace it | A range can make every touch or cross look important | Treat the reading as weak if price keeps rotating through the average |
| 2. Average type | How smooth or responsive the average should be | The type should fit the purpose: baseline, sensitivity, or responsiveness | A fast average may overreact; a slow average may lag too much | Reduce confidence when the chosen average no longer reflects current volatility |
| 3. Slope | Whether the average is rising, falling, or flattening | Slope should agree with the broader directional read | A flat average often signals compression or indecision | The read loses quality when slope turns sideways while price loses follow-through |
| 4. Spacing | How price and multiple averages separate or compress | Healthy spacing should not become extreme extension | Compressed spacing can show uncertainty; wide spacing can show exhaustion risk | Use caution when distance expands faster than structure can support |
| 5. Price location | Whether price is above, below, near, or far from the average | Location needs structural context, such as a pullback, retest, or failed acceptance | A single touch can be misleading in volatile conditions | The process weakens when price repeatedly fails to hold the relevant side |
| 6. Structure response | Whether price behavior supports the moving-average read | Follow-through, acceptance, rejection, or compression should clarify the signal | A crossover inside a range may create noise instead of direction | The reading remains unresolved until structure confirms or rejects the average |
| 7. Failure condition | What would make the interpretation unreliable | The process needs a visible invalidation condition | Without a failure condition, the average becomes a flexible narrative | Set aside the directional read when regime, slope, or structure breaks alignment. |
Where Moving Averages Help the Reading
Moving averages help most when they simplify a noisy chart without hiding the market’s structure. A rising average with price holding above it may support a trend-continuation interpretation, but the read is cleaner when pullbacks hold structure and the next advance shows acceptance.
Trend strength can also be checked with a separate directional filter such as ADX, especially when price is above a moving average but the move lacks clear expansion.
Slope is often the first quality check. A rising average shows that recent price is generally being accepted at higher levels, while a falling average shows the opposite. A flat average usually needs more caution because price may be moving through the line without establishing control.
Spacing adds another layer. When price moves slightly above a rising average and then holds structure, the average may act as a useful reference. When price stretches far away from the average, the same line may show extension risk rather than a clean continuation condition.
Dynamic support or resistance should be read as a reference area, not a guarantee. The useful question is whether price responds around the average in a way that agrees with the broader structure.
When a Moving Average Strategy Weakens
A moving average becomes less useful when the market stops respecting direction, volatility changes faster than the average can adapt, or price repeatedly crosses the line without follow-through.
| Condition | What it can mean | Why the reading weakens | What to compare next |
|---|---|---|---|
| Flat average | The market may be compressing or moving sideways | Direction is unclear, so touches and crosses can lose meaning | Check whether price is building acceptance above or below the range |
| Choppy movement around the average | Neither side is controlling the structure cleanly | Repeated crosses can create false directional readings | Compare recent highs, lows, and range boundaries |
| Price far from the average | The move may be extended relative to its recent path | The average may lag behind the current risk condition | Check whether continuation is supported by structure or whether momentum is fading |
| Volatility regime shift | The average may no longer match the market’s current rhythm | A setting that looked smooth may become too slow or too sensitive | Compare slope, spacing, and recent candle behavior around the average |
| Fast reversal | Price may change direction before the average clearly turns | The line can confirm late because it is based on prior prices | Check whether structure has already failed before the average responds |
| Standalone crossover | The moving averages have crossed, but the market may still lack structure | A cross inside a range can be noise rather than directional evidence | Compare location, slope, trend strength, and follow-through |
Moving Average Types in the Framework
Average type changes the sensitivity of the framework. A slower average may provide a steadier baseline, while a faster average may react sooner but create more noise.
SMA is often used as a baseline smoothing reference because it treats each price in the lookback period equally.
EMA responds more quickly to recent price changes, which can help when sensitivity matters but can also increase noise in uneven conditions.
WMA changes the weighting of recent prices, so the framework should treat it as a sensitivity choice rather than a separate prediction tool.
HMA is commonly discussed as a more responsive moving-average variant, but responsiveness still needs structure, slope, and failure-condition checks.
Framework note: The type of average should answer one question: what should the line help evaluate? Baseline trend, recent sensitivity, lower-lag responsiveness, and weighting differences are separate choices.
Moving Average Strategy vs Moving Average Crossover
A crossover is one possible input inside a moving average strategy. The broader framework also checks the market state, slope, spacing, price location, structure response, and the condition that would make the reading unreliable.
The distinction matters because two averages can cross while price is still trapped in a range. In that case, the cross may reflect short-term noise rather than a durable change in structure.
Strategy frame: A moving average strategy asks whether the average fits the current structure.
Crossover frame: A moving average crossover asks whether one average has moved above or below another.
Boundary: A crossover becomes more meaningful only when slope, location, structure, and follow-through support the same interpretation.
Example of a Basic Moving Average Strategy Reading
Price advances above a rising average, then pulls back toward it while the average continues to slope upward. The pullback is not enough by itself. The reading is cleaner if price holds above the prior structure, compression resolves in the trend direction, and the next attempt shows acceptance rather than immediate failure.
The same setup becomes weaker if price keeps cutting through the average, the average flattens, or the recovery attempt stalls below the prior high. The process then shifts from trend reference to unresolved structure.
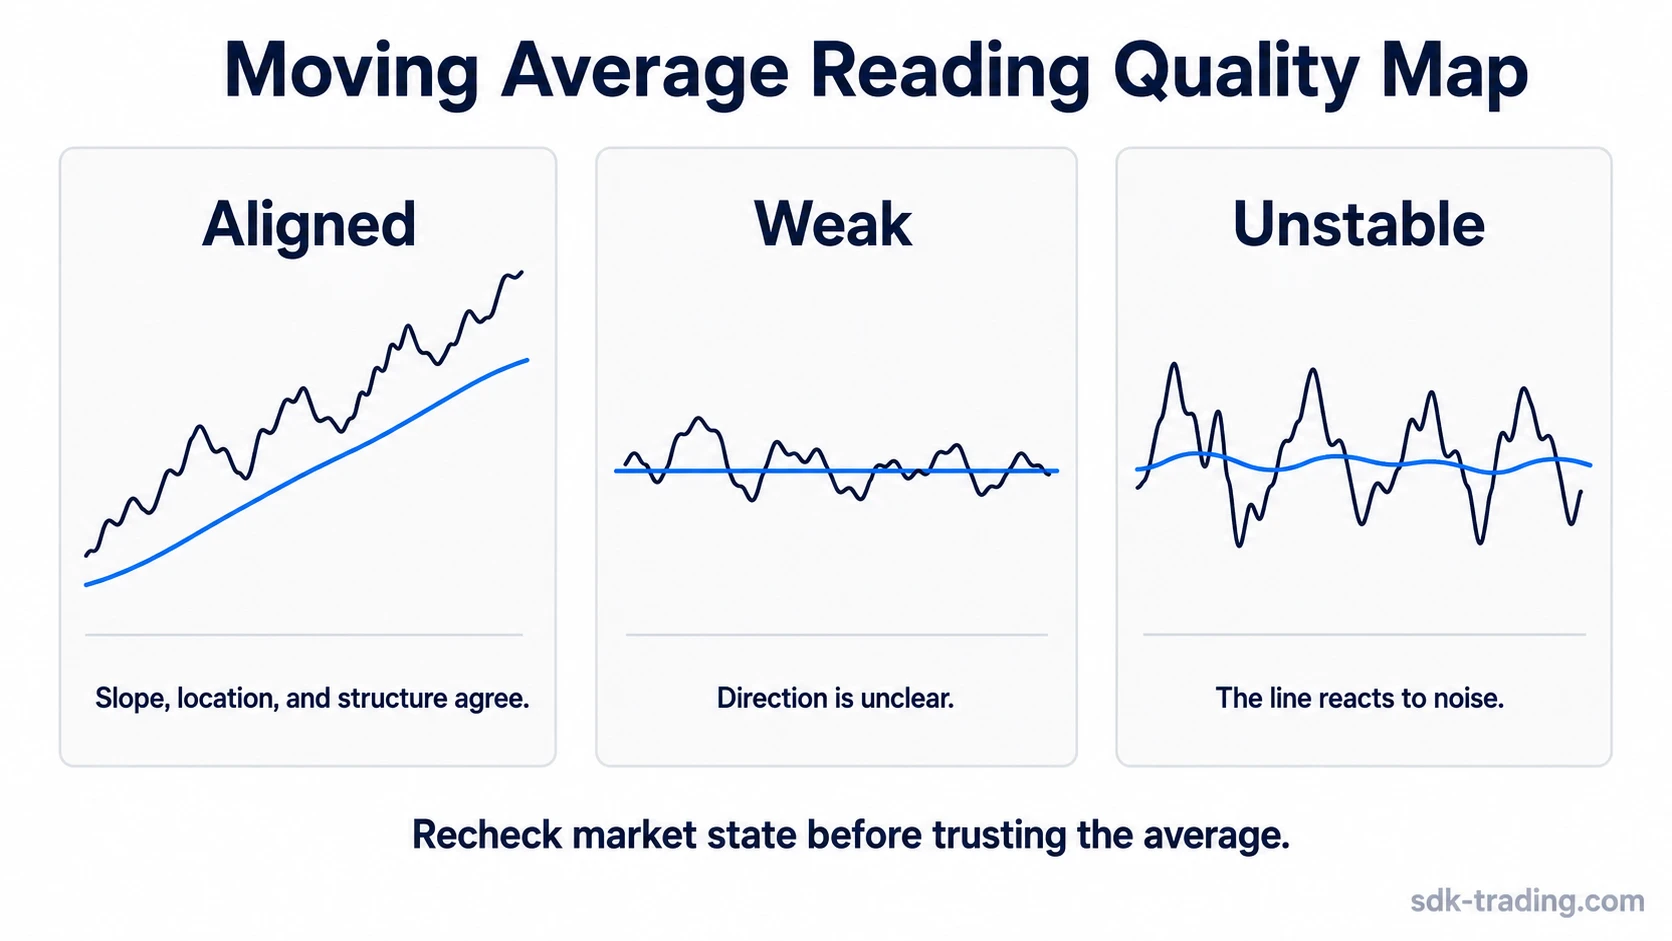
| Reading quality | Chart behavior | Interpretation | What changes the read |
|---|---|---|---|
| Cleaner | Rising average, controlled pullback, price holds structure | The average supports the trend-location read | Follow-through confirms that the area is still being accepted |
| Weak | Average flattens, price compresses around the line | Direction is unclear and the average is losing filtering value | Acceptance above or below the range is needed |
| Unstable | Price whipsaws through the average with no follow-through | The line is reacting to noise rather than clarifying structure | Trend state must be re-evaluated before the average is useful again |
Common Moving Average Strategy Mistakes
A common mistake is treating one line as a complete decision system. A moving average can organize price information, but it cannot define trend quality, volatility, structure, and failure conditions on its own.
Using crossovers without structure: A cross has less value when it happens inside compression or a sideways range.
Chasing extension: Price far above or below an average may reflect distance risk rather than a clean continuation read.
Ignoring slope: A flat average often changes the reading from directional to unresolved.
Using one setting everywhere: Different volatility conditions can make the same average too fast, too slow, or too noisy.
Forgetting lag: A moving average is built from prior prices, so fast reversals can change structure before the line reacts clearly.
Keeping the Moving Average Read Non-Mechanical
The moving average should answer a specific question inside the process. It can help filter trend, frame pullbacks, compare current price with recent behavior, or expose compression. It should not be stretched into a universal rule.
A cleaner sequence separates observation from interpretation. The observation might be that price is above a rising average. The interpretation remains conditional: price still needs structure, acceptance, and a clear failure boundary before the average becomes useful evidence.
Consistency matters most. Use the same sequence of checks before changing the interpretation: market state, type, slope, spacing, location, structure response, and weakening condition.
FAQ
Do moving average strategies work?
Moving average strategies can help organize trend and price-location context, but they are not reliable as isolated mechanical rules. Their usefulness depends on market state, slope, spacing, structure response, and risk boundaries.
What is the main weakness of a moving average strategy?
The main weakness is lag combined with noisy market conditions. A moving average may respond late during sharp reversals and may produce repeated false reads when price moves sideways through the line.
Is a moving average crossover the same as a moving average strategy?
No. A crossover is one possible signal inside the framework. A broader moving average strategy also evaluates trend state, slope, spacing, price location, structure response, and failure conditions.
Can a moving average strategy be used in forex?
Moving averages can be used on forex charts as trend and price-location references, but the same limitations apply. Choppy conditions, volatility shifts, and lag can weaken the reading.