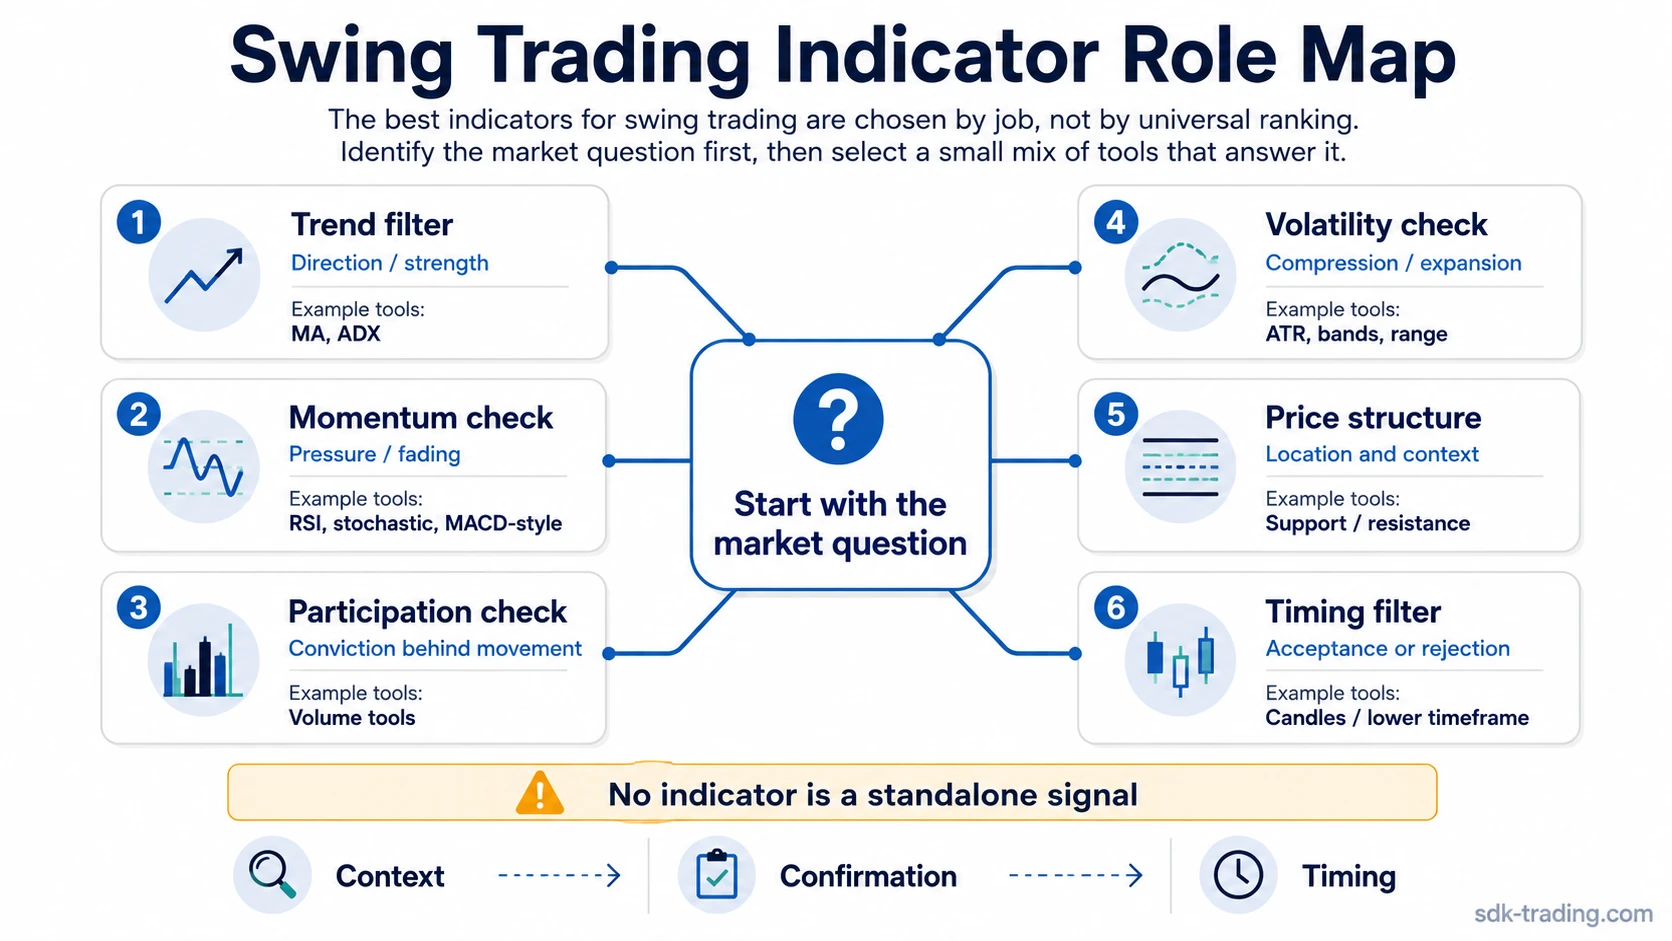
The best indicators for swing trading are best understood by job, not by universal ranking. A trend filter helps define direction, a momentum tool checks pressure, volume or participation helps test conviction, volatility tools frame range conditions, and price structure keeps the reading anchored to context. No indicator should be treated as a standalone entry or exit signal.
Swing trading usually works across several days to several weeks, so the useful question is not “Which indicator is best?” The better question is “What market condition am I trying to read?” One tool may help identify trend direction, another may show that momentum is fading, and another may warn that price is stretched or compressed. The indicator mix should reduce confusion, not create a crowded screen.
Key Points
- There is no single best indicator for every swing-trading condition.
- Trend, momentum, volume, volatility, structure, and timing tools answer different questions.
- Moving averages and ADX belong to trend context, but they still need confirmation from price behavior.
- Too many similar indicators can repeat the same information and make decisions less clear.
- A useful indicator mix separates context, confirmation, and timing instead of turning one reading into a signal.
Best Indicators for Swing Trading by Job
A swing trader usually needs a small set of readings: direction, pressure, participation, range behavior, structure, and timing. These readings can overlap, but they should not all come from the same type of tool. A chart with five trend filters may look thorough while still missing momentum weakness, poor participation, or an unstable range.
| Swing-trading question | Indicator job | Example tools | What it helps read | Main limitation |
|---|---|---|---|---|
| Is price trending or ranging? | Trend filter | Moving averages, ADX | Direction, slope, or trend strength | Lagging and context-dependent |
| Is momentum improving or fading? | Momentum check | RSI, stochastic, MACD-style tools | Pressure, exhaustion risk, and acceleration | Can remain extreme during strong trends |
| Is participation supporting the move? | Volume or participation check | Volume, volume-based tools | Conviction behind movement | Volume alone does not define timing |
| Is the market compressed or extended? | Volatility or range check | ATR, bands, range tools | Expansion, contraction, and stretch | Does not predict direction by itself |
| Where is the reading located? | Price-structure context | Support, resistance, patterns | Whether the reading appears in a meaningful area | Structure still needs confirmation |
| Is timing aligned with context? | Timing filter | Candles, short-term triggers, smaller timeframe checks | Whether the market is accepting or rejecting the move | Can create false precision |
How to Choose the Right Indicator Mix
A useful swing-trading indicator mix starts with the market question. If the problem is trend direction, a trend filter is more relevant than another oscillator. If the problem is whether a move is losing pressure, momentum tools become more useful. If the problem is whether a breakout or continuation attempt has real participation, volume context matters more than another average on the chart.
The mix should also avoid duplication. Two or three moving averages can be useful when each one has a distinct role, but stacking several smoothing tools often repeats the same lagging information. A cleaner layout might combine one trend filter, one momentum check, one participation or volatility check, and a price-structure read. The point is not to collect indicators. The point is to remove the most dangerous blind spots.
Indicators should also be matched to the timeframe. A swing trader may care about daily structure, multi-day momentum, and weekly context, while a short-term timing check may come from a lower timeframe. When those readings conflict, the conflict should be treated as information, not as something to hide with more indicators.
Trend Indicators for Swing Trading
Trend indicators are often the first tools traders consider because swing trades depend heavily on directional context. A baseline average such as the simple moving average can help separate a broader upward or downward bias from short-term noise, but it should not be read as proof that price will continue.
A responsive moving average such as the exponential moving average reacts faster to recent price changes, which can make it useful when a trader wants a less delayed trend filter. The tradeoff is that faster smoothing can also react more sharply to short-lived movement.
Weighted smoothing tools can change how recent prices influence the trend read. The weighted moving average gives more importance to newer data, which can make the trend filter more sensitive to recent movement.
Reduced-lag smoothing such as the Hull moving average tries to make the trend read more responsive without removing the need for context.
Adaptive smoothing can be useful when the chart alternates between clean movement and noise. A tool such as the Arnaud Legoux moving average belongs in that smoothing family, but it still remains a filter rather than a complete decision model.
Trend strength is a separate question from trend direction. The ADX trend strength reading can help identify whether movement has strength, but ADX by itself does not say whether the direction is bullish or bearish. Directional context still has to come from price, slope, structure, or related directional tools.
Momentum, Volume, Volatility, and Structure Checks
Momentum tools help identify whether pressure is expanding, fading, or becoming stretched. RSI, stochastic, and MACD-style tools are often used for this job, but their readings can be misleading when a strong trend keeps momentum elevated for longer than expected. Overbought or oversold should not automatically mean reversal.
Volume and participation tools help test whether price movement is supported by activity. A move that advances on weak participation can be less convincing than one that appears with expanding effort and clean follow-through. Volume still cannot solve timing by itself. It gives context for conviction, not a complete decision.
Volatility tools help frame whether price is compressed, expanding, or stretched. ATR-style readings, bands, and range tools can show that the market environment is changing, but they do not determine direction. A volatility expansion can happen during continuation, reversal, failed breakout, or disorderly movement.
Price structure keeps every indicator reading grounded. A momentum turn near a meaningful level is different from the same reading in the middle of a noisy range. A trend filter is more useful when price is respecting structure than when price is crossing back and forth through the same average.
Common Mistakes When Choosing Swing Trading Indicators
The most common problem is not using the wrong indicator. It is asking one indicator to answer too many questions. A trend tool cannot fully judge momentum quality. A momentum tool cannot prove participation. A volatility tool cannot predict direction. A timing signal cannot replace market context.
| Mistake | Why it fails | Better concept | Useful next check |
|---|---|---|---|
| Looking for one universal best indicator | Different conditions require different readings. | Match the indicator to the job. | Start with trend, momentum, participation, volatility, and structure. |
| Treating a moving average touch as a signal | Averages smooth price; they do not prove acceptance. | Separate trend filter from timing trigger. | Check slope, structure, and follow-through. |
| Reading ADX as direction | ADX measures strength, not bullish or bearish direction by itself. | Trend strength needs directional context. | Compare strength with price direction and structure. |
| Stacking similar averages | Multiple smoothing tools may repeat the same information. | Choose the smoothing style deliberately. | Use one average only if it already answers the trend question. |
| Ignoring volatility and structure | Indicator readings change meaning in ranges, trends, and breakouts. | Context before tool selection. | Ask where the reading appears on the chart. |
Example: When an Indicator Reading Can Mislead
A common scenario is that price closes above a moving average and the reading appears clean at first glance. The problem is that price can sit above an average during a weak range, a late extension, or a temporary reaction after a sharp move. The average shows that recent price is above a smoothed reference line. It does not prove that the market has accepted higher prices.
The reading becomes more useful when other conditions support it. Momentum should not be sharply fading, participation should not be absent, volatility should not be distorting the move, and price should be acting well around relevant structure. If those checks conflict, the moving average reading is still information, but it is no longer a complete explanation of the market condition.
The Best Indicator Is a Role, Not a Ranking
For swing trading, “best” usually means best suited to the specific question. A trend filter can help with direction, a momentum oscillator can test pressure, volume can add participation context, volatility can frame range conditions, and structure can keep the reading tied to the chart rather than to a floating indicator value.
A simple indicator mix often works better than a crowded one because each tool has a clearer job. The final reading should still remain conditional. Indicators can help organize evidence, but they do not remove uncertainty, replace risk planning, or turn a chart into a guaranteed outcome.
FAQ
What is the best indicator for swing trading?
There is no single best indicator for every swing trader. A useful choice depends on whether the trader needs to read trend direction, momentum, volume participation, volatility, price structure, or timing quality.
What are the best technical indicators for swing trading?
Common technical indicator categories for swing trading include moving averages, trend-strength tools, momentum oscillators, volume tools, volatility measures, and timing filters. The best mix is usually small and role-based rather than crowded.
Are moving averages good for swing trading?
Moving averages can help define trend direction and smooth price noise, but they are lagging tools. They work better as context filters than as standalone trade signals.
Is ADX good for swing trading?
ADX can help read trend strength, but it does not show direction by itself. It needs to be paired with directional context from price, structure, slope, or other directional tools.
How many indicators should a swing trader use?
A smaller set is often clearer than a crowded chart. A common starting framework separates one trend filter, one momentum or participation check, one volatility or range measure, and price-structure context.
Do swing trading indicators work for stocks?
They can be used on stocks, but the same limitation applies: indicators should be interpreted through context. Earnings events, gaps, liquidity, sector behavior, and broader market conditions can change how a reading should be understood.
Use the Framework Without Ranking the Tools
Indicator selection becomes more useful when it is tested against market context rather than treated as a fixed checklist. The strongest mix is usually the one that separates trend, momentum, volatility, participation, and structure without asking any single tool to answer the whole market question.