Ichimoku vs moving average is a comparison between a multi-line equilibrium framework and a smoothing line or family of smoothing lines. The confusion happens because parts of Ichimoku use average-like calculations, but Ichimoku adds cloud boundaries, forward spans, line relationships, and lagging context that a single moving average does not provide.
The useful difference is not that one is automatically stronger. A moving average simplifies price into a cleaner trend reference. Ichimoku gives a denser map of where price sits relative to equilibrium, cloud structure, and several related lines. That extra structure can clarify context, but it can also add clutter when the reading is mixed.
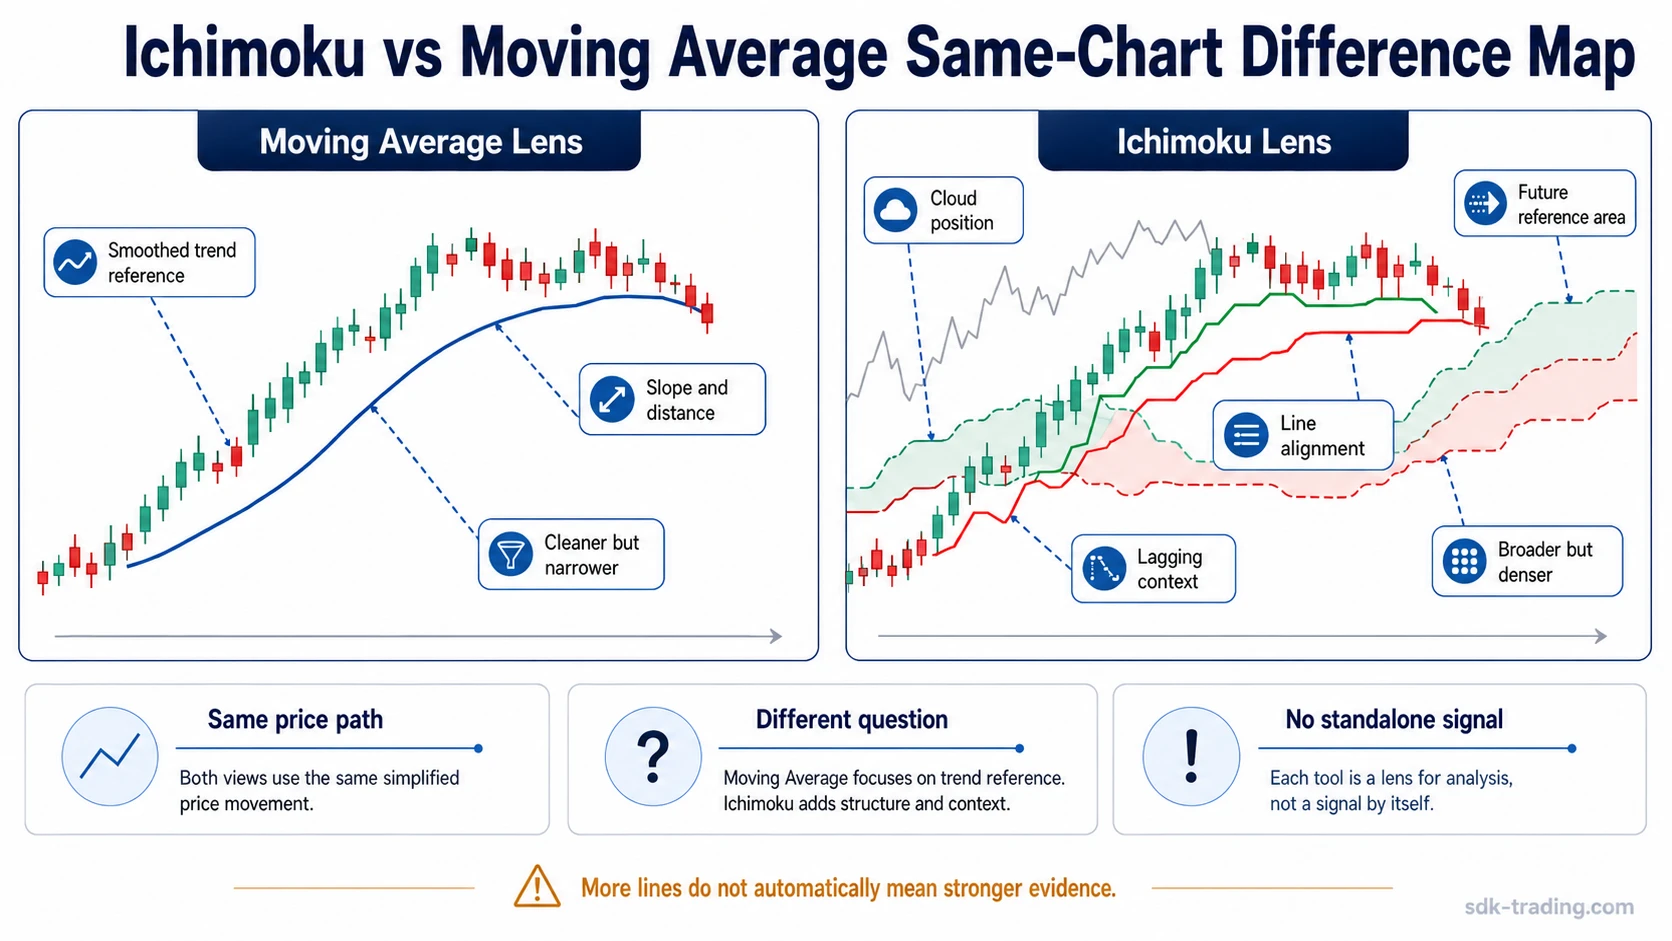
Quick distinction
Moving averages answer: how is price behaving relative to a smoothed trend line?
Ichimoku answers: how aligned is price with a broader cloud, line, and equilibrium structure?
Ichimoku vs Moving Average: The Core Difference
A moving average reduces price data into a smoothed line. Traders can use one moving average or compare several moving averages, but the basic job remains smoothing: reduce noise, show direction, and make price behavior easier to compare across periods.
Ichimoku Cloud is built as a multi-part framework. It includes the Conversion Line, Base Line, Leading Span A, Leading Span B, the cloud area, and the Lagging Span. The reading comes from how these parts relate to price and to each other, not from one line alone.
That makes the comparison uneven by design. Ichimoku is not simply a more complicated moving average. It is a different way of organizing trend, equilibrium, reference areas, and alignment into one visual structure.
Why Ichimoku Can Look Like Moving Averages
Ichimoku can look similar to moving averages because several of its lines are derived from midpoint-style calculations over past price ranges. They can move near price, slope with trend, and react as market structure changes. That visual overlap is enough to create confusion.
The overlap does not make the tools identical. A moving average usually smooths closing prices or another selected price input over a chosen period. Ichimoku uses fixed component relationships and projects part of the structure forward through the cloud. The result is not just a line; it is a map of balance, displacement, and context.
Common false equivalence: Ichimoku contains average-like behavior, but it is not “just several moving averages.” If the cloud, line spacing, projected spans, and lagging context are ignored, the reading collapses into a simplified line comparison and loses the reason Ichimoku exists.
Ichimoku vs Moving Average Comparison Criteria
The cleanest way to compare them is by the question each tool is trying to answer. Moving averages are simpler and easier to isolate. Ichimoku is more complete visually, but that completeness only helps when the parts are readable together.
| Criteria | Ichimoku | Moving average |
|---|---|---|
| Main structure | Multi-line cloud framework | One smoothing line or a family of smoothing lines |
| Core job | Shows equilibrium, line/cloud alignment, and context | Smooths price to make trend direction easier to see |
| Calculation style | Uses fixed component logic based on price-range midpoints and projected spans | Uses a selected averaging method such as simple, exponential, or weighted smoothing |
| Projection | Includes forward cloud spans | Usually has no forward cloud structure |
| Flexibility | Traditional settings are often kept for consistency | Periods and types can be adjusted easily |
| Information density | High; many relationships appear at once | Low to medium; the reading is cleaner but narrower |
| Main risk | Looks complete even when the parts are mixed or contradictory | Looks too clean and can hide choppy or over-smoothed conditions |
| Best question | “How aligned is the whole structure?” | “How is price behaving relative to a smoothed trend?” |
Same Chart, Different Meaning
Imagine price has been rising, then pauses sideways after a fast move. A moving average lens might focus on whether price remains above a chosen average, whether the average is still sloping upward, and whether a shorter average is still above a longer one.
An Ichimoku lens would ask a wider set of questions. Is price above or inside the cloud? Are the Conversion Line and Base Line separated or tangled? Is the future cloud supportive or thin? Is the Lagging Span clear of prior price, or is it running into congestion?
| Same chart condition | Moving average reading | Ichimoku reading |
|---|---|---|
| Price rises, then starts moving sideways | The average may still slope upward, so the trend filter can remain constructive. | The cloud and line relationships may show whether the pause is still structurally clean or becoming mixed. |
| Price pulls back toward the trend reference | The focus is distance from the average, slope, and whether price reclaims or loses the line. | The focus is whether price is above, inside, or below the cloud and whether the Base Line acts as equilibrium. |
| Signals become tangled | Multiple moving averages may cross or flatten, showing weaker trend clarity. | Price inside the cloud, repeated line crosses, and a blocked Lagging Span can all weaken the reading. |
The same chart can therefore produce two different messages. The moving average reading is cleaner and narrower. The Ichimoku reading is broader, but only useful if the extra components add clarity instead of noise.
When a Moving Average Lens Fits Better
A moving average lens fits better when the task is to simplify price behavior. It is especially useful when the trader wants a clean trend reference without reading a full multi-line structure.
| Use a moving average lens when… | Why it helps |
|---|---|
| You want one simple trend reference | A single line can make slope, distance, and direction easier to see. |
| You want to compare short-term and long-term smoothing | Different periods can show whether faster and slower trend views agree. |
| You need low visual clutter | Fewer lines reduce the chance of over-reading small conflicts. |
| You are testing different smoothing styles | The moving average family allows simple, exponential, weighted, and other variants to be compared directly. |
The tradeoff is that simplicity can hide context. A moving average can still slope cleanly while price action becomes unstable around it. The line is a filter, not a complete reading of market structure.
When an Ichimoku Lens Fits Better
Ichimoku is more useful when the question expands beyond price versus one smoothed line into cloud position, line alignment, and equilibrium context. That can matter when price, equilibrium, cloud position, and lagging context need to be read together.
| Use an Ichimoku lens when… | Why it helps |
|---|---|
| You want to judge price relative to a cloud structure | The cloud can show whether price is above, inside, or below a broader equilibrium area. |
| You need more than one line relationship | Conversion Line, Base Line, and cloud position can show whether the reading is aligned or mixed. |
| You want forward context | The forward cloud can show how a future reference area is being shaped visually. |
| You want to detect mixed structure | Inside-cloud price action, flat lines, and blocked lagging context can warn that the chart is not as clean as one line suggests. |
The weakness is the same as the strength. Ichimoku can look authoritative because it contains more information. More information is not the same as better evidence when the components disagree.
Can You Use Ichimoku and Moving Averages Together?
Ichimoku and moving averages can be placed on the same chart, but that does not automatically improve the reading. The risk is duplicate evidence: several lines may repeat the same trend message and make the chart feel more confirmed than it really is.
A cleaner approach is to decide what each tool is meant to contribute. A moving average can act as a simple trend filter. Ichimoku can act as a broader structure map. If both are answering the same question, the extra line may only add clutter.
Combination check: Before combining them, ask whether the moving average adds a separate piece of information or only repeats what the Ichimoku lines and cloud already show. If it repeats the same message, the chart may become busier without becoming clearer.
Common Misreads
The most common mistake is treating Ichimoku as automatically stronger because it has more components. A dense framework can still produce weak information when price is inside the cloud, lines are tangled, or the Lagging Span is blocked by prior price action.
The opposite mistake is treating moving averages as too simple to matter. A simple line can be useful precisely because it removes noise and gives a cleaner trend reference. The problem is not simplicity; the problem is using the line as if it explains everything.
| Misread | Safer interpretation |
|---|---|
| Ichimoku is just several moving averages. | Some components have average-like behavior, but the framework includes cloud structure, projection, and line relationships. |
| Ichimoku is better because it has more parts. | More parts help only when they align clearly and add information rather than clutter. |
| Moving averages are too basic to be useful. | A simple smoothing line can be useful when the goal is clean trend discipline. |
| Using both creates stronger confirmation. | It may create duplicate evidence if both tools are saying the same thing in different visual forms. |
Related Concepts
For a full Ichimoku component breakdown, start with Ichimoku Cloud. For the moving-average side, compare moving average types before treating any one line as a complete trend reading.
FAQ
Is Ichimoku better than a moving average?
Ichimoku is not automatically better than a moving average. It gives a broader structure with cloud, line, and lagging context, while a moving average gives a simpler trend reference. The better lens depends on whether the chart needs more context or less clutter.
Is Ichimoku just a group of moving averages?
No. Some Ichimoku components can look average-like, but the framework is not only a group of moving averages. Its cloud projection, line relationships, and lagging context make it a broader equilibrium map.
Can Ichimoku and moving averages be used together?
They can be used together, but the combination should not duplicate the same evidence. If a moving average only repeats what the Ichimoku cloud and lines already show, it may add clutter rather than clarity.
Why do Ichimoku and moving averages sometimes give different readings?
They ask different questions. A moving average focuses on price relative to a smoothed line. Ichimoku looks at price relative to the cloud, the Conversion Line, the Base Line, future spans, and lagging context.