Moving average type choice is easy to misread when speed is treated as stronger confirmation. In technical analysis, moving average types are different weighting and smoothing methods that change how a line responds to price, how much lag it carries, and how much market noise it may expose.
A faster line can turn earlier, but an earlier turn is not automatically a cleaner trend reading. A faster line shows faster response to price; it does not prove that the move has stronger directional quality. A smoother line can reduce short-term noise, but extra smoothing can also delay recognition of a real change in direction.
Key Points
- Moving average types differ mainly by how they weight recent and older price data.
- Faster averages usually respond sooner, but they can also turn more often in choppy conditions.
- Smoother averages can make trend direction easier to see, but they may react later.
- Type choice helps shape interpretation; it does not confirm trend direction by itself.
What Changes Between Moving Average Types
All moving averages smooth price data, but they do not smooth it in the same way. The difference comes from the weighting method: some types treat each price equally, some emphasize recent prices, some use proportional weighting, and some try to reduce lag while keeping the line visually smooth.
Definition: A moving average type is a method for smoothing price data into a line that updates over time. The type controls how the calculation weights price history, which changes the line’s lag, responsiveness, and sensitivity to noise.
The type does not change the market itself. It changes the way price history is summarized. Period length and moving average type are separate variables, so a comparison becomes cleaner when only one of them changes at a time.
Moving Average Types Comparison
| Type | Weighting logic | Typical line behavior | Useful reading role | Common misread |
|---|---|---|---|---|
| SMA | Equal weight across the selected lookback period. | Smoother and slower than more responsive types. | Helps establish a broad average price reference. | Assuming slower movement means stronger reliability in every market condition. |
| EMA | More weight on recent prices. | Turns faster than an SMA with the same period. | Helps track recent-price response and shorter-term directional change. | Treating early line movement as confirmation rather than a response to recent price change. |
| WMA | Recent prices receive proportionally higher weight. | Responsive, with a more direct weighting structure than an SMA. | Highlights more recent price influence while still smoothing older data. | Reading the weighted response as cleaner trend evidence without checking structure. |
| HMA | Uses weighted averages to reduce lag and smooth the result. | Often appears smoother while still reacting quickly. | Helps compare lag reduction against visual smoothness. | Assuming a cleaner-looking curve removes false turns in low-structure conditions. |
| ALMA | Uses offset and smoothing parameters to balance the weighted response. | Designed to balance smoothness and responsiveness. | Helps examine whether a smoother response still reflects useful recent-price information. | Choosing it for visual neatness instead of checking whether it fits the chart condition. |
The comparison works best when the line is read as a smoothing choice. For example, EMA weighting makes recent price behavior more visible, but that extra responsiveness can also magnify repeated short-term turns.
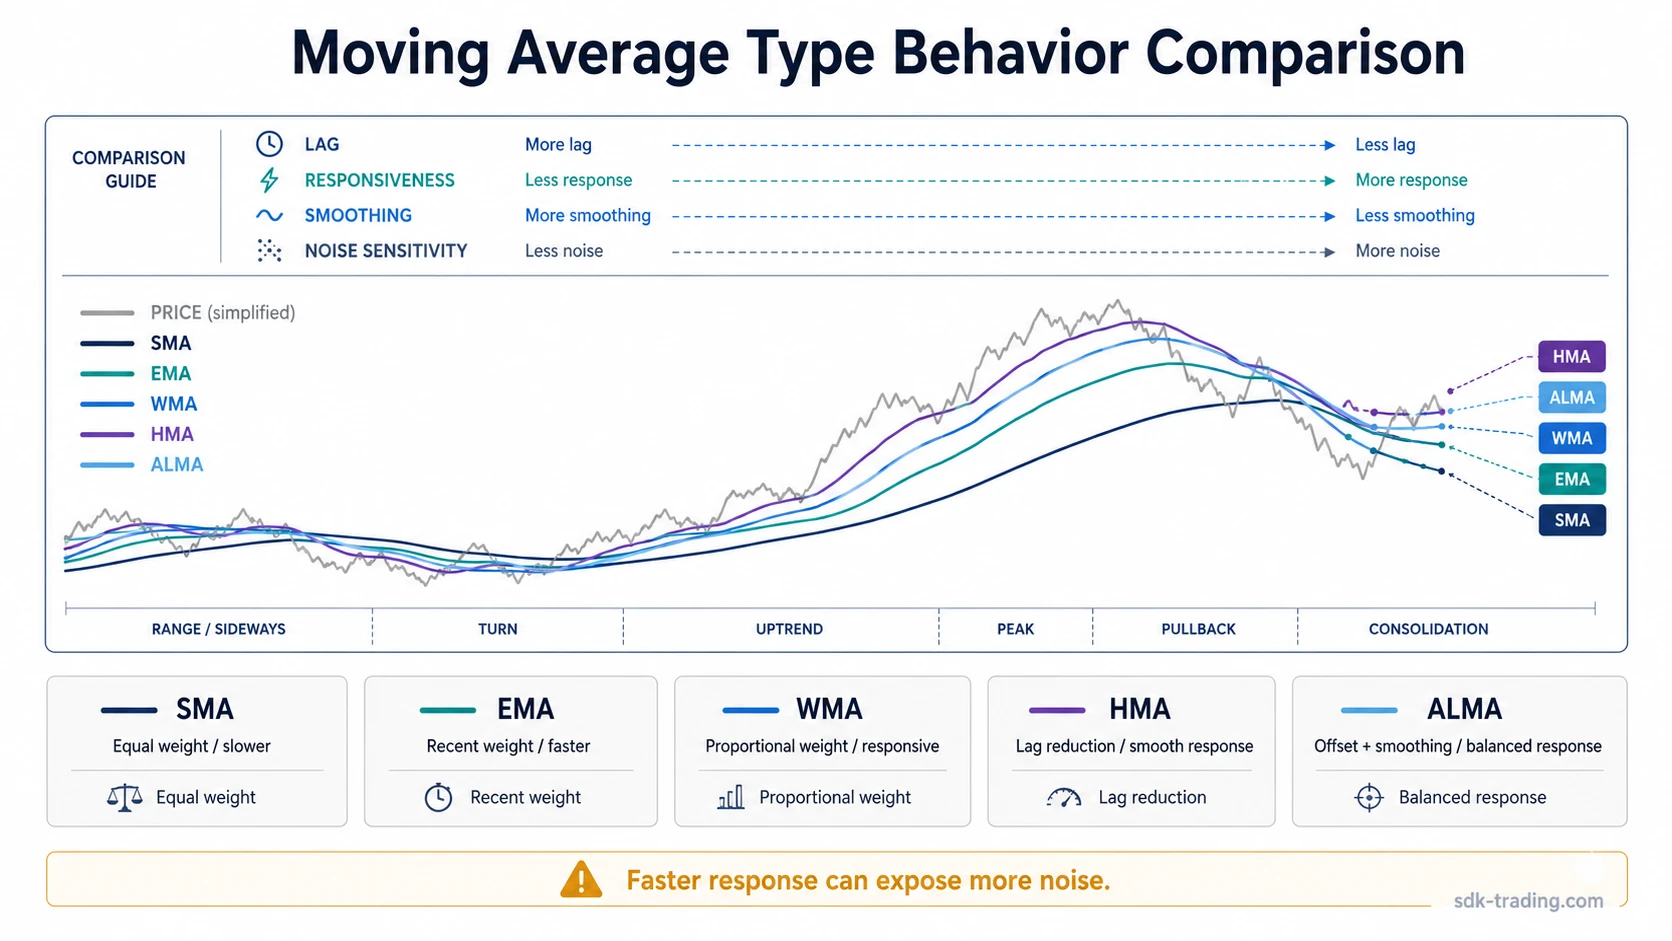
Lag Versus Responsiveness
Lag and responsiveness sit on opposite sides of the same interpretation problem. A slow average may filter out small fluctuations, but it can also respond late when price behavior genuinely changes. A fast average may respond quickly, but it can also bend several times while the market remains directionless.
Lag is not automatically bad. Responsiveness is not automatically good. The line must fit the condition being evaluated. A broad trend reading usually tolerates more lag because the goal is to reduce minor fluctuations. A short-term momentum reading may require more responsiveness, but the interpretation becomes less reliable when the line turns repeatedly without directional follow-through.
Limitation: A moving average can smooth price, but it cannot prove trend strength. When trend strength is the main question, an ADX trend-strength reading belongs to a different interpretation layer than moving average smoothing.
When a Faster Moving Average Creates a Weaker Reading
A faster moving average gives earlier visual response, but earlier response can also mean more noise when price lacks directional structure. The weak condition is not the fast average itself. The weak condition is repeated line movement without a clear price result.
Trigger condition: Price moves sideways or repeatedly fails to hold direction while a short-period moving average turns up and down several times.
Common misread: Each turn is treated as fresh confirmation, even though the market has not shown sustained acceptance in either direction.
Safer interpretation: The moving average is reacting to recent price movement, but the chart condition may still be noisy. The reading improves only when price structure, line behavior, and surrounding evidence stop conflicting.
Type choice should be described as a weighting and smoothing decision, not as confirmation by itself. The interpretation strengthens when the selected type fits the chart condition being evaluated. It weakens when the type is chosen only because it produces a cleaner-looking line after the fact.
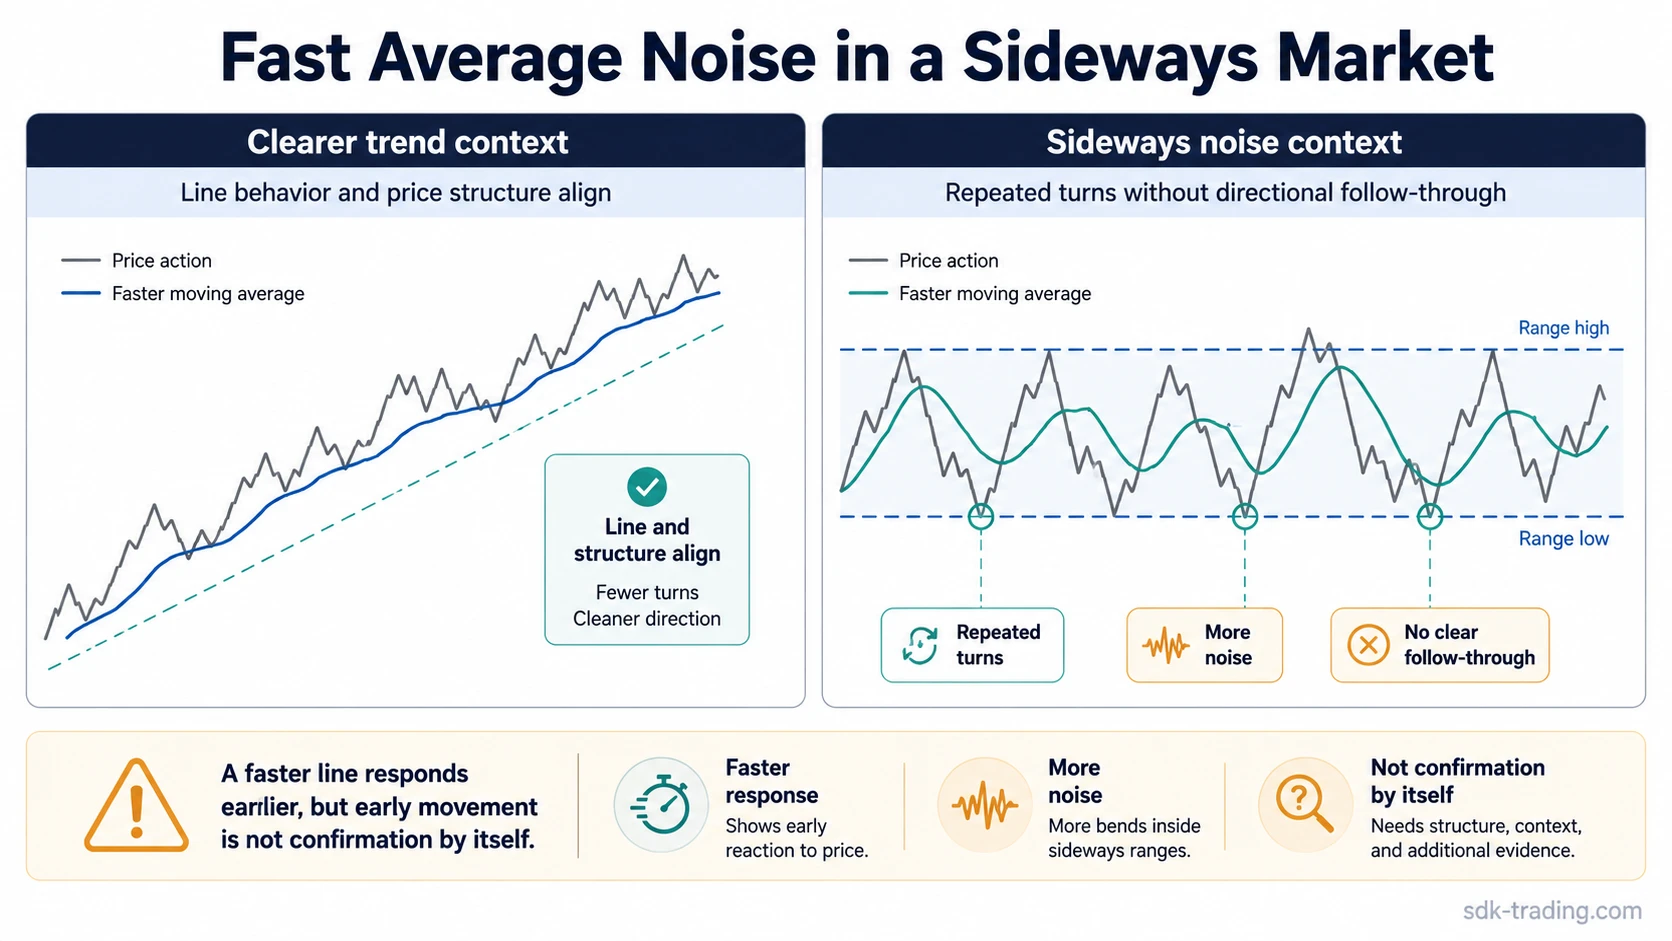
Moving Average Type Example in a Sideways Market
Price trades sideways after a prior advance, and a short-period EMA changes direction several times inside the range. The faster line reacts earlier than a smoother average, but the repeated turns mainly reflect alternating short-term pressure rather than a clear trend reading.
The reading becomes more defensible if price leaves the range and the line response begins to align with that change. If price keeps returning to the middle of the range, the moving average is still describing rotation more than directional quality.
The same condition can also expose the limit of smoothing. A slower average may look calmer during the range, but that calm line may not reveal when short-term pressure is changing. Faster and smoother types both create trade-offs; neither removes the need to compare price behavior against the line.
Type-by-Type Interpretation Notes
SMA: A simple moving average gives each price in the lookback period equal weight. It is useful when the goal is a plain average reference, but its slower response can hide early changes in recent behavior.
EMA: An exponential moving average gives more influence to recent price data. That makes it more responsive, but responsiveness can become a weakness when price rotates without clean directional structure.
WMA: A weighted moving average increases the importance of newer data in a more direct weighted sequence. It can make recent changes more visible, but it still requires comparison with the broader chart condition.
HMA: A Hull moving average is designed to reduce lag while keeping the line relatively smooth. The risk is visual confidence: a clean curve can still turn in unhelpful ways if the underlying market condition remains unstable.
ALMA: An Arnaud Legoux moving average uses offset and smoothing parameters to balance smoothness and responsiveness. Its value depends on whether that balance clarifies the condition being studied or only makes the line look cleaner.
How Moving Average Type Choice Relates to Trend-Strength Tools
Moving averages and trend-strength tools answer different questions. A moving average type changes how price is smoothed. A trend-strength tool focuses on whether directional movement has enough force to matter. Mixing those jobs can create false confidence.
A moving average may slope upward while directional strength remains weak. A Directional Movement Index reading can help separate directional pressure from the smoothing behavior of the moving average line.
The practical boundary is simple: moving average type choice shapes the visual lens; it does not replace trend-strength, price-structure, or volatility context.
Common Moving Average Type Mistakes
| Mistake | Why it happens | Cleaner interpretation |
|---|---|---|
| Choosing the fastest type by default | The line appears to react earlier. | Earlier movement may be useful only when the surrounding price structure supports it. |
| Choosing the smoothest line after reviewing the chart | The line looks cleaner in hindsight. | Visual neatness does not prove that the type will clarify similar conditions later. |
| Comparing types without using the same period | The type difference becomes mixed with a setting difference. | Compare one variable at a time when studying line behavior. |
| Treating slope as trend strength | A rising or falling line can look decisive. | Slope describes smoothed price direction; strength requires additional evidence. |
| Ignoring the market condition | The same moving average type is applied across all conditions. | A range, trend, pullback, and compression area can all change how useful the same type appears. |
FAQ
What are the main moving average types in trading?
The main moving average types often compared in trading are SMA, EMA, WMA, HMA, and ALMA. They differ by how they weight price data and how they balance lag, smoothing, and responsiveness.
Which moving average type reacts fastest?
EMA, WMA, and HMA are generally more responsive than a simple moving average with the same period. Faster response can also create more noise when price lacks directional structure.
Is a smoother moving average always better?
No. A smoother moving average can reduce small fluctuations, but it can also react later when price behavior changes. Smoothness is useful only when it fits the condition being evaluated.
Can moving average type choice confirm a trend?
Moving average type choice cannot confirm a trend by itself. It changes how price history is smoothed, while trend quality still depends on price structure, directional pressure, and surrounding evidence.
How to Read Moving Average Type Choice
Moving average types are best read as different lenses on the same price history. SMA, EMA, WMA, HMA, and ALMA can each make some behavior easier to see and other behavior easier to miss. The strongest use is not choosing the line that looks best after the fact, but matching the weighting and smoothing method to the market condition being evaluated.