Trend indicators become easy to misread when a smoothed, threshold-based, or trailing output is treated as confirmation instead of a processed reading of prior market behavior.
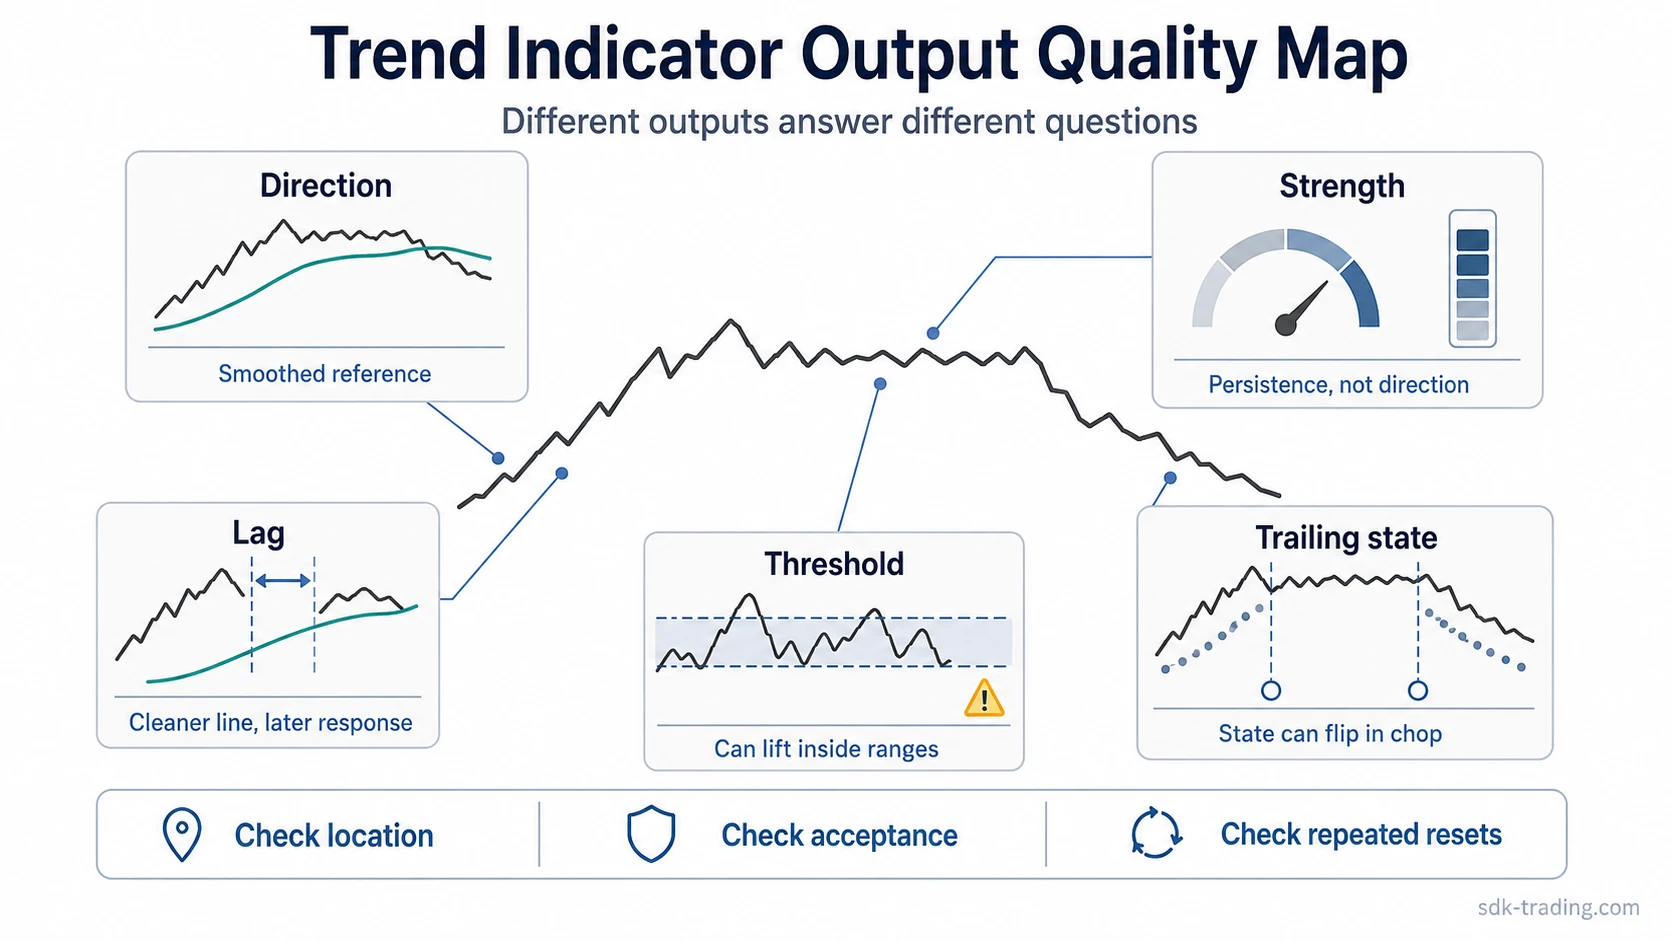
A useful trend-indicator reading starts with a simple distinction: direction, strength, responsiveness, persistence, and trailing state are not the same measurement. Some tools smooth price direction, some estimate trend strength, some track momentum shifts, and some trail price as the move changes state. The output can organize chart reading, but it still has to be compared with market location, range behavior, and whether price is accepting or rejecting the area being tested.
Definition: A trend indicator is a technical-analysis tool that processes price, range, time, or volume-related behavior into a reading about direction, strength, persistence, responsiveness, or trailing state.
Key Points
- Trend indicators can measure different things: direction, strength, smoothing, momentum, and trailing behavior do not always agree.
- Smoothing can reduce noise, but it can also delay recognition after a sharp move or fast reversal.
- Thresholds can make a reading look cleaner than the market actually is, especially inside ranges.
- Several indicators can agree because they reuse similar price inputs, not because the trend evidence is automatically stronger.
What Trend Indicators Actually Measure
Trend indicators are easier to compare when they are grouped by output rather than by popularity. A moving average reading is not the same type of evidence as a trend-strength threshold, and a trailing overlay does not answer the same question as a momentum-derived line.
| Indicator family | Main input | Typical output | Useful reading | Fragile condition |
|---|---|---|---|---|
| Moving averages | Price over a lookback period | Smoothed direction or average price path | Whether price is broadly above, below, or crossing a smoothed reference | Fast reversals, sideways ranges, and late responses after extended moves |
| ADX / DMI-style strength readings | Directional movement and range expansion | Trend strength or persistence | Whether directional movement is becoming more persistent | Confusing strength with bullish or bearish direction by itself |
| MACD-style momentum readings | Relationships between moving averages | Momentum shift around a smoothed baseline | Whether the relationship between faster and slower averages is changing | Choppy markets where repeated crosses do not lead to clean continuation |
| Ichimoku-style structure readings | Multiple price-derived lines and cloud relationships | Trend structure, balance, and relative position | Whether price, lines, and projected areas align or conflict | Overreading one line while ignoring the broader structure |
| Parabolic SAR-style trailing overlays | Price progression and acceleration | Trailing state and reset behavior | Whether the move is maintaining or losing a trailing sequence | Frequent resets during whipsaw or range-bound conditions |
Why Smoothing and Thresholds Can Mislead
Smoothing compresses raw price movement into a cleaner line. That can make direction easier to see, but it also means the indicator reacts after price has already moved. A faster tool is usually more responsive and noisier; a slower tool is usually smoother and later.
An EMA gives more weight to recent prices than a simple moving average, so it can react faster when price changes direction. The trade-off is that faster responsiveness can also create more movement around the line when price is not trending cleanly.
A strength threshold works differently. ADX is commonly read as a trend-strength or trend-persistence tool, but the line itself does not say whether the market is bullish or bearish. Direction still has to come from price behavior, directional components, or surrounding structure.
Calculation note: A cleaner indicator line is not automatically a cleaner market. Smoothing, weighting, and thresholds change how raw movement is displayed; they do not remove lag, range noise, or the need to compare the reading against price location.
Not This / Instead This
The common mistake is treating the indicator output as proof. A safer interpretation treats the output as one processed view of the market, then checks whether price behavior supports or weakens that view.
| Not this | Instead this |
|---|---|
| A crossover proves that a new trend is underway. | A crossover shows a change in the relationship between smoothed inputs; price acceptance and follow-through still matter. |
| A rising ADX line is automatically bullish. | A rising strength reading can reflect stronger movement, but direction must be read separately. |
| Several similar indicators create stronger confirmation. | Several similar indicators may repeat the same underlying price information in different formats. |
| A trailing overlay reset gives a complete trend decision. | A reset can mark a state change, but whipsaw risk remains high when price is rotating inside a range. |
| A trend indicator works the same at every chart location. | The reading changes meaning near prior highs, prior lows, range edges, and failed breakout or breakdown areas. |
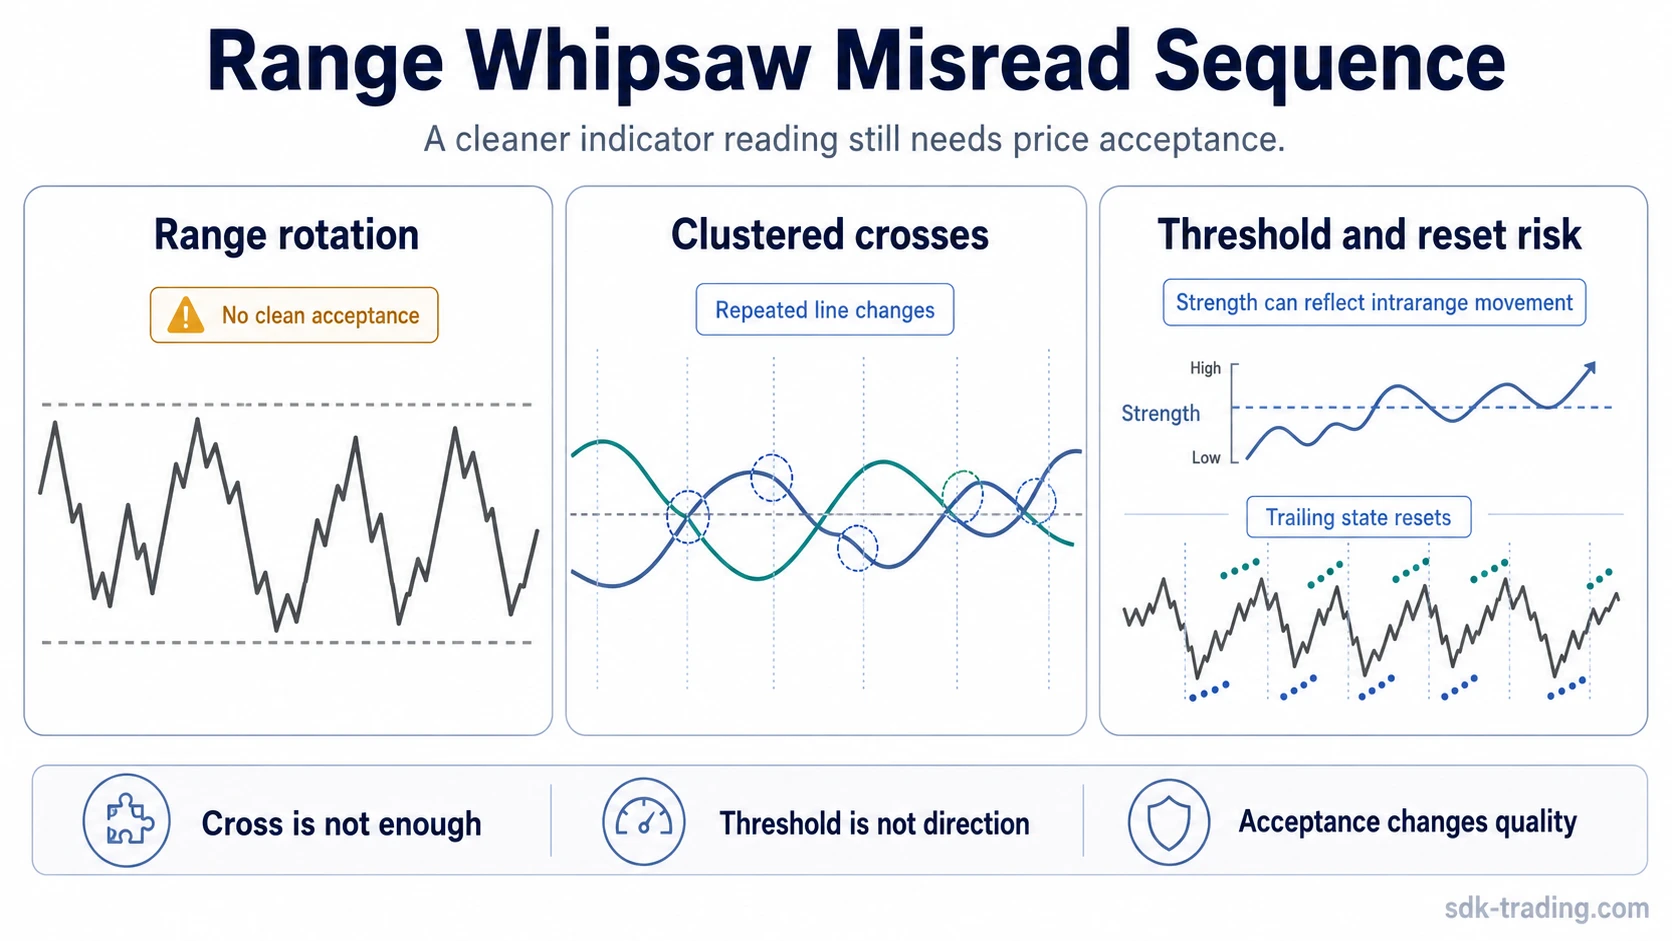
A False-Signal / Threshold Misread Scenario
Price rotates inside a wide range after a prior advance. A faster moving average crosses above a slower one near the upper part of the range, while a strength reading begins to lift from a low level. At first glance, the combination can look like a developing trend reading.
The interpretation loses quality if price cannot hold above the tested area, the next recovery attempt stalls, and the moving averages begin crossing back and forth around the same zone. The strength reading may be reacting to wider intrarange movement rather than a clean directional trend.
Diagnostic reading: The crossover and threshold change are not enough on their own. The condition improves only if price accepts beyond the range boundary, repeated crosses stop clustering around the same area, and trailing resets become less frequent.
Why Trend Indicators Can Disagree
Indicator conflict is not always a problem with the tools. It often happens because each tool compresses a different property of the market. One indicator may show that price is above a smoothed average, while another shows weak trend strength, and another keeps resetting because the move lacks persistence.
Parabolic SAR is a trailing-state reading. Its dot sequence can look orderly when price trends persistently, but repeated flips can appear when the market is unstable or rotating. That behavior is better read as a change in trailing state, not as a complete trading instruction.
| Conflict type | What it may mean | What to compare next |
|---|---|---|
| Price above a moving average, but strength remains weak | Direction may be improving before persistence is visible | Whether price holds above the area instead of only crossing the line |
| Strength rises, but price is still inside a range | Range expansion may be increasing without clean directional acceptance | Whether the move escapes the range or keeps rotating inside it |
| Momentum shifts positive, but trailing overlays reset often | Short bursts may be appearing without stable continuation | Whether resets become less frequent as price accepts in one direction |
| Multiple indicators agree, but all use similar price inputs | The agreement may be redundant rather than independent | Whether a different measurement type adds useful information |
Where Trend-Indicator Readings Become Weaker
Trend-indicator readings become weaker when the market condition does not match the type of output being used. A smoothed line can lag after a sharp move. A threshold can look cleaner than the underlying price action. A trailing overlay can reset repeatedly in choppy conditions.
Common weak spots: lag after sharp movement, whipsaw inside ranges, direction/strength confusion, redundant indicator stacking, and readings taken near important chart locations without checking acceptance or rejection.
The practical distinction is location-sensitive. A trend-like output near a range edge, failed breakout, or fast reversal is more fragile than the same output after price has accepted beyond the tested area.
How to Read Trend Indicators Without Overstating Them
A balanced trend-indicator interpretation separates the measurement from the conclusion. Direction, strength, smoothing, momentum, and trailing behavior are different pieces of information. The interpretation improves when those pieces describe the same market condition without simply duplicating the same input.
A moving average mainly organizes direction around a smoothed reference. A strength threshold measures persistence more than directional bias. A trailing overlay tracks state changes while still remaining vulnerable to whipsaw. Keeping those jobs separate reduces the chance of turning a processed indicator output into a stronger claim than the chart supports.
FAQ
What do trend indicators show in trading?
Trend indicators process market data into readings about direction, strength, smoothing, momentum, or trailing behavior. They help organize chart interpretation, but their output still depends on price location and market condition.
Why can trend indicators give false signals?
False readings often appear when smoothed lines, thresholds, or trailing overlays react to noise inside a range. The reading becomes weaker if price cannot accept beyond the area being tested.
Is ADX a bullish or bearish indicator?
ADX is usually read as a trend-strength or persistence indicator, not as bullish or bearish direction by itself. Direction has to be read from price behavior or other directional information.
Why do different trend indicators disagree?
Different trend indicators can disagree because they measure different properties, such as smoothing, strength, momentum, or trailing state. Conflict often means the market condition is not clean enough for one simple reading.