EMA and WMA are both moving averages that give more importance to recent prices, but EMA uses exponential weighting while WMA uses a fixed linear weighting structure. That difference affects responsiveness, lag, smoothness, and how each line reacts when price accelerates, pauses, or rotates. Neither is universally better: EMA is often more reactive to recent change, while WMA gives a more controlled fixed-weight reading across the selected lookback.
EMA vs WMA definition: EMA stands for exponential moving average and weights recent price through exponential smoothing. WMA stands for weighted moving average and applies a fixed linear weight sequence across the chosen period.
The practical comparison is not whether one average is always superior. The practical question is what changes when the same price data is filtered through exponential weighting instead of a fixed weighted ladder.
Key Points
- EMA uses exponential weighting; WMA uses fixed linear weighting.
- EMA often reacts faster to recent price changes, but faster response can also increase noise.
- WMA can be easier to interpret mechanically because its weight sequence is fixed, but that does not make it automatically more accurate.
- Both EMA and WMA are calculated from past prices, so both can lag and neither should be treated as a standalone trading instruction.
EMA vs WMA Comparison Table
The main difference between EMA and WMA is the way each average distributes weight across the lookback period. That weighting choice changes how the line bends, how much it lags, and how sensitive it can become when price changes quickly.
| Comparison point | EMA | WMA |
|---|---|---|
| Full name | Exponential Moving Average | Weighted Moving Average |
| Weighting method | Uses exponential smoothing, so recent data receives stronger emphasis while older data fades gradually. | Uses a fixed linear weighting ladder, usually giving the newest price the largest fixed weight and older prices progressively smaller weights. |
| Recent-price emphasis | Recent changes can affect the line strongly because the newest data is blended into an exponentially smoothed series. | Recent prices receive more weight, but the weight sequence remains fixed inside the chosen period. |
| Responsiveness | Often more responsive to fresh price changes, especially when the period length is shorter. | Responsive as well, but the response follows the fixed weighting structure of the lookback window. |
| Lag behavior | Can reduce some lag compared with slower averages, but it still trails price because it is based on past data. | Also lags price, with the amount of lag shaped by the period length and fixed weight distribution. |
| Smoothness | Can bend quickly when price changes, which may make the line feel less smooth in noisy conditions. | Can feel more mechanically stable because the weights are fixed, though it can still react sharply if the lookback is short. |
| Noise sensitivity | Higher when the EMA period is short or price is choppy. | Higher when the WMA period is short or the newest weighted prices rotate quickly. |
| Choppy-market risk | May bend repeatedly around price during range-bound movement. | May also rotate around price when the weighted window keeps replacing older data with newer but directionless data. |
| Best interpretive use | Useful when the main question is how quickly the average is adapting to recent price change. | Useful when the main question is how a fixed weighted window is translating the latest prices into a smoother reference line. |
The Core Difference: Exponential vs Linear Weighting
An EMA keeps part of the previous average and blends in the latest price through an exponential smoothing process. Because the newest data changes the smoothed series directly, EMA can bend sooner when price begins moving faster.
A WMA applies a fixed weight sequence inside the selected lookback. In a simple 5-period WMA, the newest price may receive the largest weight, the previous price a smaller weight, and so on until the oldest price receives the smallest weight.
Practical distinction: EMA adapts through exponential smoothing across the ongoing series. WMA updates through a fixed weighting ladder inside the chosen window. Both emphasize recent price, but they do not do it in the same way.
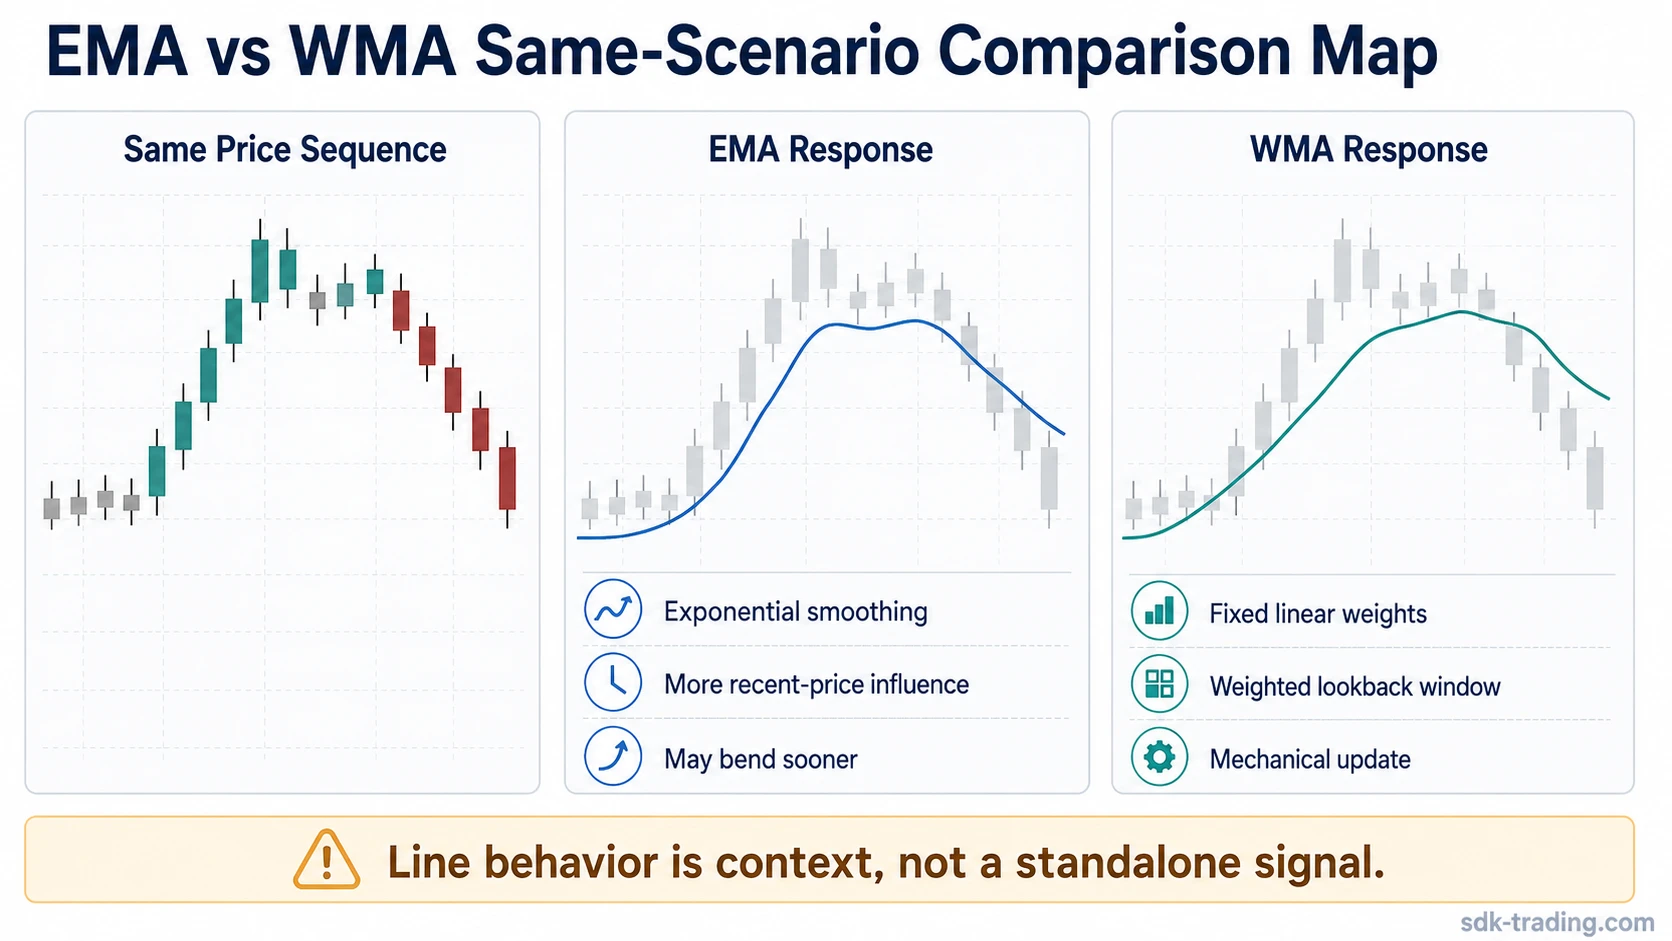
Same Chart, Different Reading
Consider a simple price sequence: price rises quickly, pauses, then rotates back into the prior range. The EMA may bend sooner during the acceleration because the newest price changes the smoothed line more aggressively. When price pauses, the EMA may also flatten or turn sooner if the recent change loses force.
The WMA reads the same sequence through its fixed weight ladder. As new prices enter the window and older prices drop out, the line updates in a more mechanical way. That can make the WMA feel more controlled, but it does not mean the WMA is more correct.
| Price behavior | EMA interpretation | WMA interpretation |
|---|---|---|
| Price accelerates | The line may bend sooner because recent change has strong influence. | The line rises as the newest prices receive the highest fixed weights. |
| Price pauses | The line may flatten quickly if recent pressure fades. | The line changes as the weighted window replaces older prices with newer paused prices. |
| Price rotates back | The line may react earlier, but that reaction can also reflect short-term noise. | The line may update more orderly, but it can still lag the turn or whipsaw in a range. |
The difference helps explain line behavior. It does not create a complete trading decision by itself.
Is WMA Better Than EMA?
WMA is not universally better than EMA, and EMA is not universally better than WMA. The better choice depends on the reading job: fast adaptation, controlled weighting, smoother context, or reduced noise.
EMA may be clearer when recent price change matters more than the older part of the lookback. This can make it useful for judging whether a moving average is adapting quickly, but the same sensitivity can make the line more reactive during choppy movement.
WMA may be clearer when the trader wants a fixed weighting structure. Because the weights are known inside the selected period, the line can feel more transparent mechanically. That does not make it a prediction tool, and it does not remove lag.
No universal winner: EMA usually emphasizes responsiveness. WMA usually emphasizes a fixed weighted structure. The practical choice depends on the market condition being interpreted, not on a permanent ranking.
Common Misreads
A common mistake is treating EMA and WMA as interchangeable because both give more importance to recent prices. The shared recent-price emphasis hides the important difference: EMA uses exponential smoothing, while WMA uses a fixed weighted sequence.
| Misread | Safer interpretation |
|---|---|
| “Both weight recent price, so they mean the same thing.” | Both emphasize recent price, but the weighting structure is different. |
| “Faster means better.” | Faster can mean more responsive, but it can also mean more noise. |
| “Smoother means more accurate.” | Smoother can reduce noise, but it may also react later. |
| “A crossover confirms direction.” | A crossover is only line interaction. It needs context from price structure, volatility, and broader conditions. |
Formula and Calculation Note
EMA is commonly calculated with a smoothing multiplier, often expressed as 2 / (period + 1). The current EMA uses the latest price, the prior EMA, and that multiplier to update the smoothed line.
In the common linear WMA form, WMA is calculated by multiplying each price in the lookback by a fixed weight, adding those weighted values, and dividing by the total of the weights. In a simple linear WMA, the newest price receives the highest weight and the oldest price receives the lowest weight.
Formula boundary: The calculation difference matters because it explains behavior. It does not mean a formula can decide market direction on its own.
EMA vs WMA in Choppy or Ranging Conditions
EMA and WMA can both become less useful when price rotates inside a range. A faster line may bend repeatedly without producing a clear directional message. A smoother line may reduce some noise but react later when the range finally changes.
In a choppy market, repeated touches, crosses, or small line turns can reflect unresolved rotation rather than a completed directional shift. The moving average becomes more useful when it is read with price structure, range boundaries, volatility, and the broader context of the move.
Limit: Both EMA and WMA are derived from past prices. They can help organize trend context, but they do not confirm direction, predict price, or replace risk control.
Related Moving Average Pages
EMA and WMA each have mechanics that are easier to study separately after the comparison is clear. Use the individual EMA and WMA references for deeper calculation details; keep this comparison focused on how the two weighting methods change interpretation.
| Related concept | Use it for |
|---|---|
| EMA | Exponential smoothing, recent-price responsiveness, and how the EMA line adapts as price changes. |
| WMA | Fixed linear weighting, weighted-window behavior, and how the WMA line reacts as new prices enter the lookback. |
FAQ
Is WMA better than EMA?
No. WMA is not universally better than EMA. WMA uses fixed linear weighting, while EMA uses exponential weighting, so the better choice depends on whether the comparison needs a more controlled fixed-weight line or a more responsive recent-price line.
Is EMA always faster than WMA?
EMA often reacts more strongly to recent changes because of its exponential weighting, but period length and market conditions still matter. Faster response can also increase noise, especially when price is choppy.
Do EMA and WMA both lag price?
Yes. Both are moving averages calculated from past price data, so both can lag current price. The difference is how each average distributes weight across the selected lookback.
Final Takeaway
EMA vs WMA is mainly a weighting comparison. EMA changes through exponential smoothing, while WMA changes through a fixed linear weighting ladder. That difference can change responsiveness, lag, smoothness, and the meaning of line behavior on the same chart.
Use the comparison as a reading aid: EMA and WMA can clarify how a line is responding, but price structure, volatility, and risk context still decide whether the reading is meaningful.