Trading chart types are different ways of segmenting, compressing, smoothing, or displaying market price data. A chart type changes how price history is represented on screen; it does not change the transactions that created that history.
Line, bar, candlestick, Heikin Ashi, Renko, Kagi, and line break charts answer different reading needs. Some charts preserve time and the full open, high, low, and close range. Others simplify the view, smooth the candles, or filter movement so that smaller fluctuations become less visible.
Core distinction: A chart type is the display method. A chart pattern is a price-structure formation that may appear inside that display method.
Key Points
- Chart types change representation, not the underlying price history.
- Line charts simplify price movement by focusing on closing prices.
- Bar and candlestick charts preserve more intraperiod range information.
- Heikin Ashi smooths price action through averaged candle construction.
- Renko, Kagi, and line break charts reduce the role of fixed time intervals.
- Chart type selection is not a trade signal, trend proof, or prediction method.
Main types of trading charts
The main types of trading charts can be grouped by how they handle time, price range, smoothing, and movement filtering. A close-only chart keeps the view simple. An OHLC chart preserves more range detail. A smoothed chart changes candle construction to reduce visual noise. A movement-based chart prints new structure only after enough price movement occurs.
The most common starting point is the difference between line, bar, and candlestick charts. A line chart usually connects closing prices. A bar chart shows the open, high, low, and close for each period. A candlestick chart also shows open, high, low, and close, but uses candle bodies and wicks to make range and close location easier to scan.
More specialized chart types change the reading process. Heikin Ashi modifies candle calculation to create a smoother visual sequence. Renko, Kagi, and line break construction reduce the emphasis on fixed time intervals and focus more on price movement thresholds or directional change.
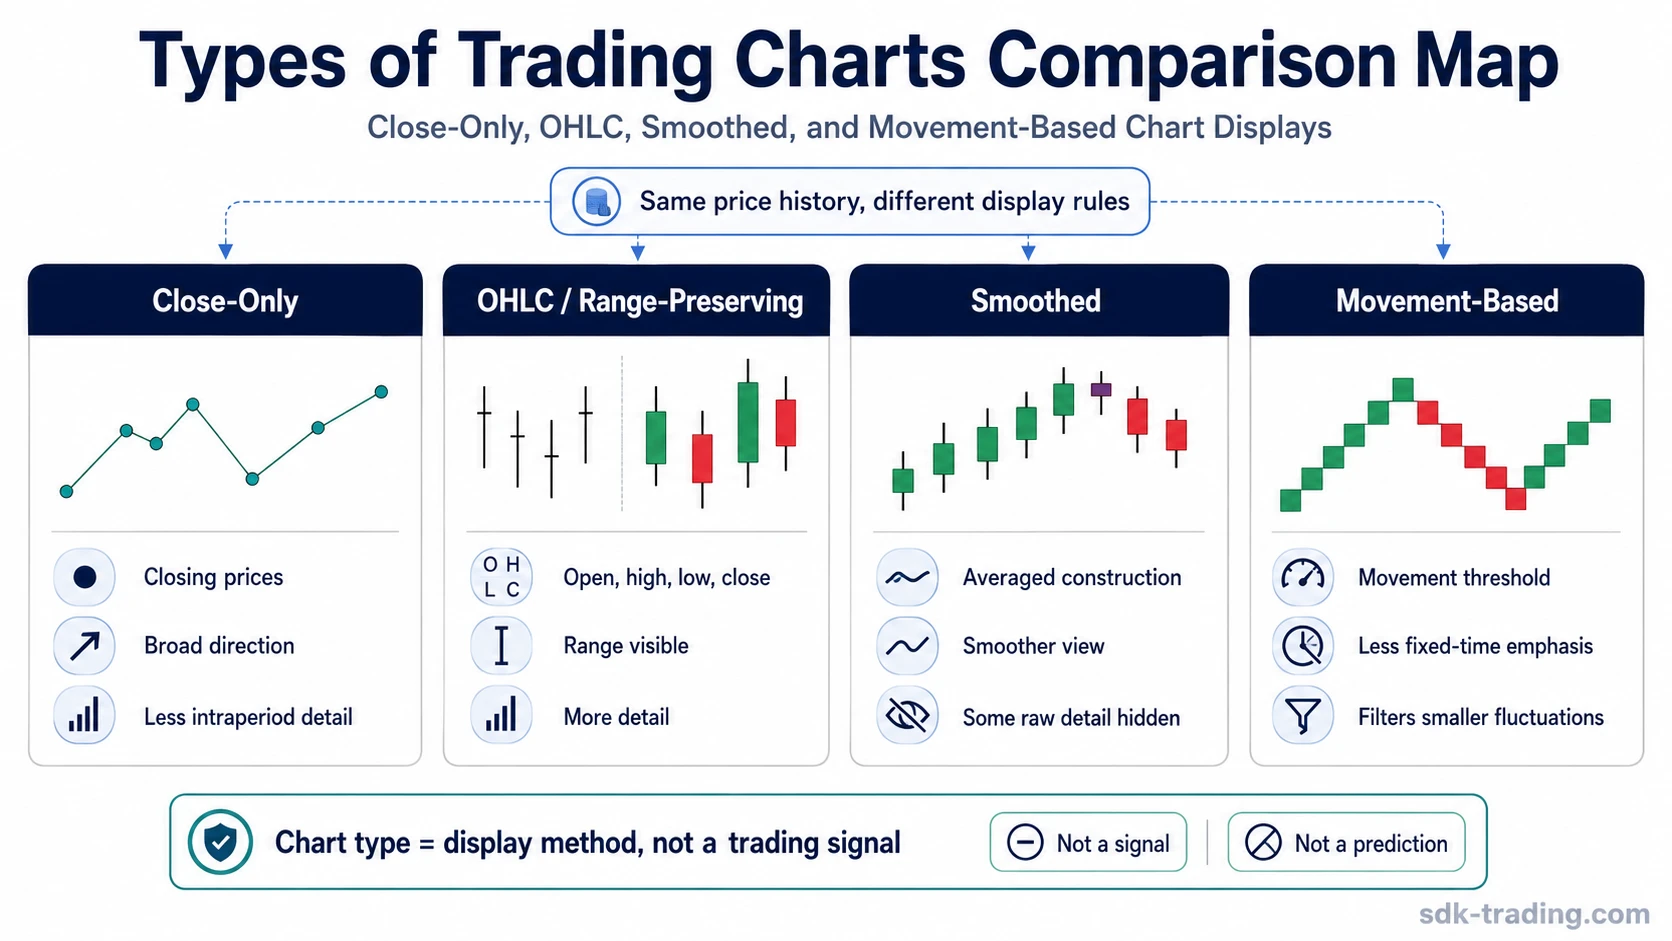
Chart Type vs Chart Pattern
A chart type is the format used to display price data. A chart pattern is a recognizable price formation that may appear after price has been plotted. The two ideas are related, but they are not the same.
| Term | What it means | What it does not mean |
|---|---|---|
| Chart type | The display method used to organize price data. | It is not a trading setup, entry rule, or pattern label. |
| Chart pattern | A price-structure formation that appears inside a chart. | It is not the same as the chart format used to draw the data. |
For example, a head and shoulders pattern can appear on a candlestick chart, but candlestick charting itself is not a head and shoulders pattern. The chart type controls the display. The pattern label describes a structure inside the displayed price history.
How Chart Types Preserve or Compress Price Data
Every chart type makes a tradeoff. It keeps some information visible and compresses other information. The useful question is not which chart type is universally better. The useful question is what information the chart keeps clear and what information becomes less visible.
| Chart construction family | What it preserves | What it compresses or filters |
|---|---|---|
| Close-only charts | Closing-price direction and broad movement. | Open, high, low, intraperiod range, and wick behavior. |
| OHLC charts | Open, high, low, close, range, and close location. | Less than close-only charts, but visual density can increase. |
| Smoothed charts | Directional flow after recalculation or averaging. | Some raw price detail and exact candle-to-candle change. |
| Movement-based charts | Price movement that meets the chart construction rule. | Equal time spacing and smaller fluctuations below the threshold. |
This is why the same market can look different across chart types. The underlying price history has not changed. The chart has changed the way that history is grouped, filtered, or emphasized.
Trading Chart Types Compared
The chart type that fits best depends on the reading task. A trader studying raw candle behavior needs different information than a trader comparing broad directional movement or filtering noise from a trend sequence.
| Chart family | Common examples | What it shows | What it hides or compresses | Best next chart topic |
|---|---|---|---|---|
| Close-only | Line chart | Broad closing-price direction with minimal visual detail. | Open price, intraperiod high and low, wick behavior, and candle body structure. | Line chart basics before moving into range-preserving charts. |
| OHLC / range-preserving | Bar chart, candlestick chart | Open, high, low, close, price range, and close location inside each period. | It can become visually noisy when many bars or candles overlap in a choppy area. | Bar and candlestick construction before using pattern labels. |
| Smoothed / averaged | Heikin Ashi | A smoother directional sequence built from recalculated candle values. | Some raw open, close, and gap information from the original price series. | Heikin Ashi |
| Smoothed candle interpretation | Heikin Ashi doji | A possible slowdown or balance point inside a smoothed candle sequence. | It does not show the same raw candle hesitation as a standard candlestick doji. | Heikin Ashi doji |
| Smoothed reversal context | Heikin Ashi reversal | A change in smoothed candle behavior after a directional sequence weakens. | It can delay raw reversal detail because smoothing changes the candle calculation. | Heikin Ashi reversal |
| Movement-based | Renko | Price movement through bricks after a defined movement threshold is met. | Fixed time spacing and smaller fluctuations that do not meet the brick condition. | Renko chart |
| Movement-based | Kagi | Directional shifts and line changes based on price movement and reversal rules. | Standard time intervals and some smaller price movement between directional changes. | Kagi chart |
| Movement-based | Line break | Directional continuation and reversal structure through line break construction. | Fixed time spacing and smaller price reactions that do not alter the line sequence. | Line break chart |
Which chart type to study next
Start with the information that matters for the reading task. If the goal is broad direction, a line chart can keep the view simple. If the goal is candle-level structure, bar charts and candlestick charts preserve more detail. If the goal is to reduce visual noise, Heikin Ashi or movement-based charts may be useful, but the filtered view needs careful interpretation.
For smoothed candle construction, move into Heikin Ashi first. Heikin Ashi doji belongs to the narrower question of hesitation inside a smoothed sequence, while Heikin Ashi reversal belongs to the question of how a smoothed sequence can weaken or change direction.
For movement-based construction, Renko focuses on price movement through bricks rather than equal time intervals. Kagi focuses on directional line change. Line break construction focuses on how price continuation and reversal are represented through line sequences.
Limits of Chart Type Selection
Limitation: A chart type can improve readability, but it does not validate a trade, predict direction, prove trend quality, or replace confirmation, risk definition, and market context.
The same price history can appear smoother on one chart and more volatile on another. That difference comes from representation. A filtered chart may reduce noise, but it may also remove details that matter for timing, range behavior, and raw price acceptance.
Chart type selection should therefore be treated as a reading choice, not a conclusion. The chart format can help organize price information, but interpretation still depends on context, structure, confirmation, and the limitations of the chosen display method.
FAQ
What is the difference between a chart type and a chart pattern?
A chart type is the display method used to show price data. A chart pattern is a price-structure formation that may appear inside that display method.
Are candlestick charts and bar charts both OHLC charts?
Yes. Both can show open, high, low, and close data for each period. The difference is visual presentation: bar charts use bars, while candlestick charts use bodies and wicks.
Do Renko, Kagi, and line break charts ignore time?
They reduce the role of fixed time intervals by building structure around price movement rules. Time still passes in the market, but the chart display is not organized as a standard equal-time sequence.
Is a smoother chart type better for trading decisions?
A smoother chart can make directional flow easier to scan, but it is not automatically better. Smoothing can also hide raw price details, so interpretation still needs confirmation and context.