A Renko chart is a technical-analysis chart built from bricks that appear only after price moves enough to satisfy the selected brick-size rule.
Unlike a time-based candlestick chart, a Renko chart does not print a new visible unit just because a minute, hour, or day has passed. The visible structure changes only when the price movement is large enough for the chosen construction setting.
Core definition: A Renko chart converts price movement into a sequence of bricks. Each brick represents a completed price-displacement threshold, not a fixed time interval.
- A Renko brick appears only when price satisfies the selected brick-size threshold.
- The same market can look different when fixed, percentage, or ATR-based sizing is used.
- Smaller moves are hidden from the Renko display, not removed from the market itself.
What Is a Renko Chart?
A Renko chart is a non-time-based charting method that shows price movement as a series of same-sized bricks. The chart emphasizes completed price movement and reduces the visual presence of smaller fluctuations that do not meet the selected brick rule.
The useful boundary is that Renko simplifies the display. It does not make price action cleaner in the market itself, and it does not prove that a trend is strong. It only changes what is visible after the chosen construction rules are applied.
Reading boundary: A smooth Renko sequence can make movement look more orderly than the underlying time-based price path. The missing movement may still matter for risk, volatility, liquidity, and execution context.
How Renko Bricks Are Built
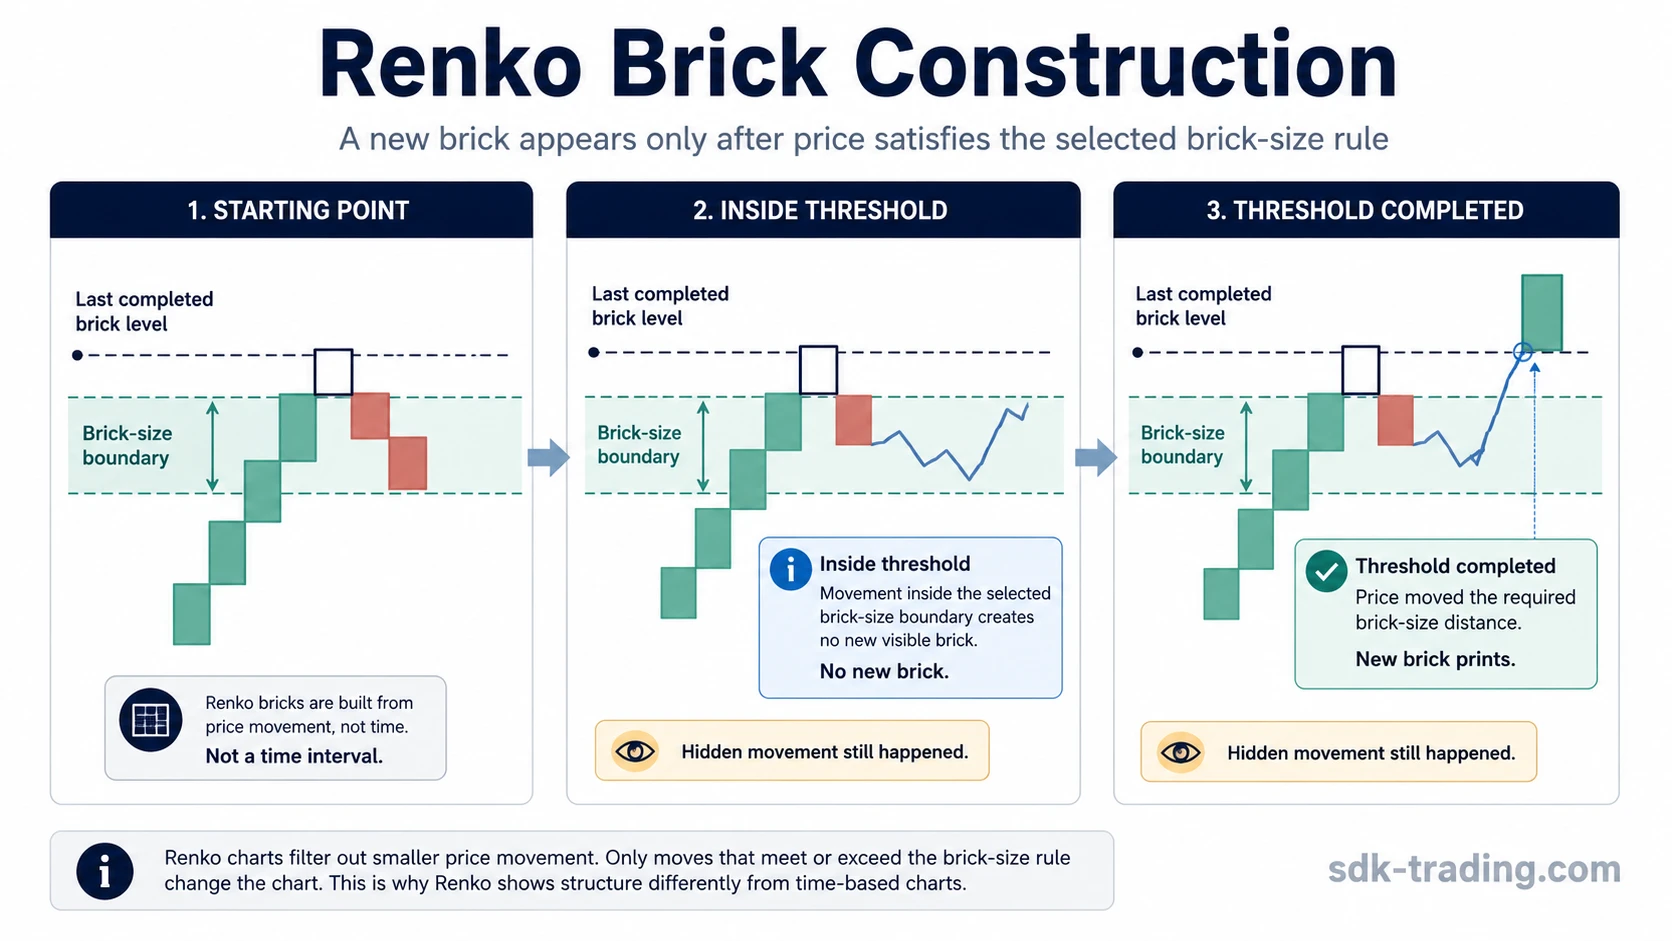
Renko construction starts with a price input and a selected brick size. When price moves far enough to complete that brick size, the chart can print a new brick. If price moves inside the boundary but does not complete the required threshold, the visible Renko structure may not change.
For example, if the brick size is 2 points, a move that remains inside that 2-point boundary may create no new brick. A completed move beyond the threshold can create the next brick. The example is only a construction illustration; it is not a trade setup or directional rule.
Illustrative threshold example: If a chart is using 2-point bricks and price moves 1.4 points from the last completed brick level, the Renko display may remain unchanged. If price completes the required 2-point movement, a new brick can appear. The hidden 1.4-point movement still happened; it simply did not qualify for a new visible brick under that setting.
Reversal behavior also depends on the chart’s construction settings. A reversal is not created by every opposite tick. It usually requires price to move far enough in the opposite direction to satisfy the relevant brick rule. That is why Renko reversals can appear later than reversals on time-based candles.
Renko Chart Components
A Renko chart is easier to interpret when the input, rule, visible result, and limitation are separated. The chart is not just a drawing style; it is a rule-based transformation of price movement.
| Component | What it controls | Visible result | Interpretation limit |
|---|---|---|---|
| Price input | The price series used to construct the chart, often based on closing prices or platform-defined inputs. | The source path from which bricks are calculated. | Different data inputs or platform rules can change the displayed structure. |
| Brick size | The minimum price movement required for a new brick. | Larger bricks show fewer swings; smaller bricks show more detail. | Changing size changes the chart’s visible story without changing the actual market path. |
| Calculation method | Whether the brick size is fixed, percentage-based, ATR-based, or otherwise configured. | The same market may print different brick sequences under different methods. | The setting can affect comparisons across charts, assets, and platforms. |
| Threshold rule | The condition that decides whether price movement is large enough to print a brick. | No qualifying movement means no new visible brick. | Movement inside the threshold can be hidden from the Renko display. |
| Visible brick sequence | The simplified structure after the rules are applied. | Trends, pauses, and reversals may look cleaner than on candles. | The sequence is an interpretation aid, not proof of direction or strength. |
Fixed vs ATR Brick Size
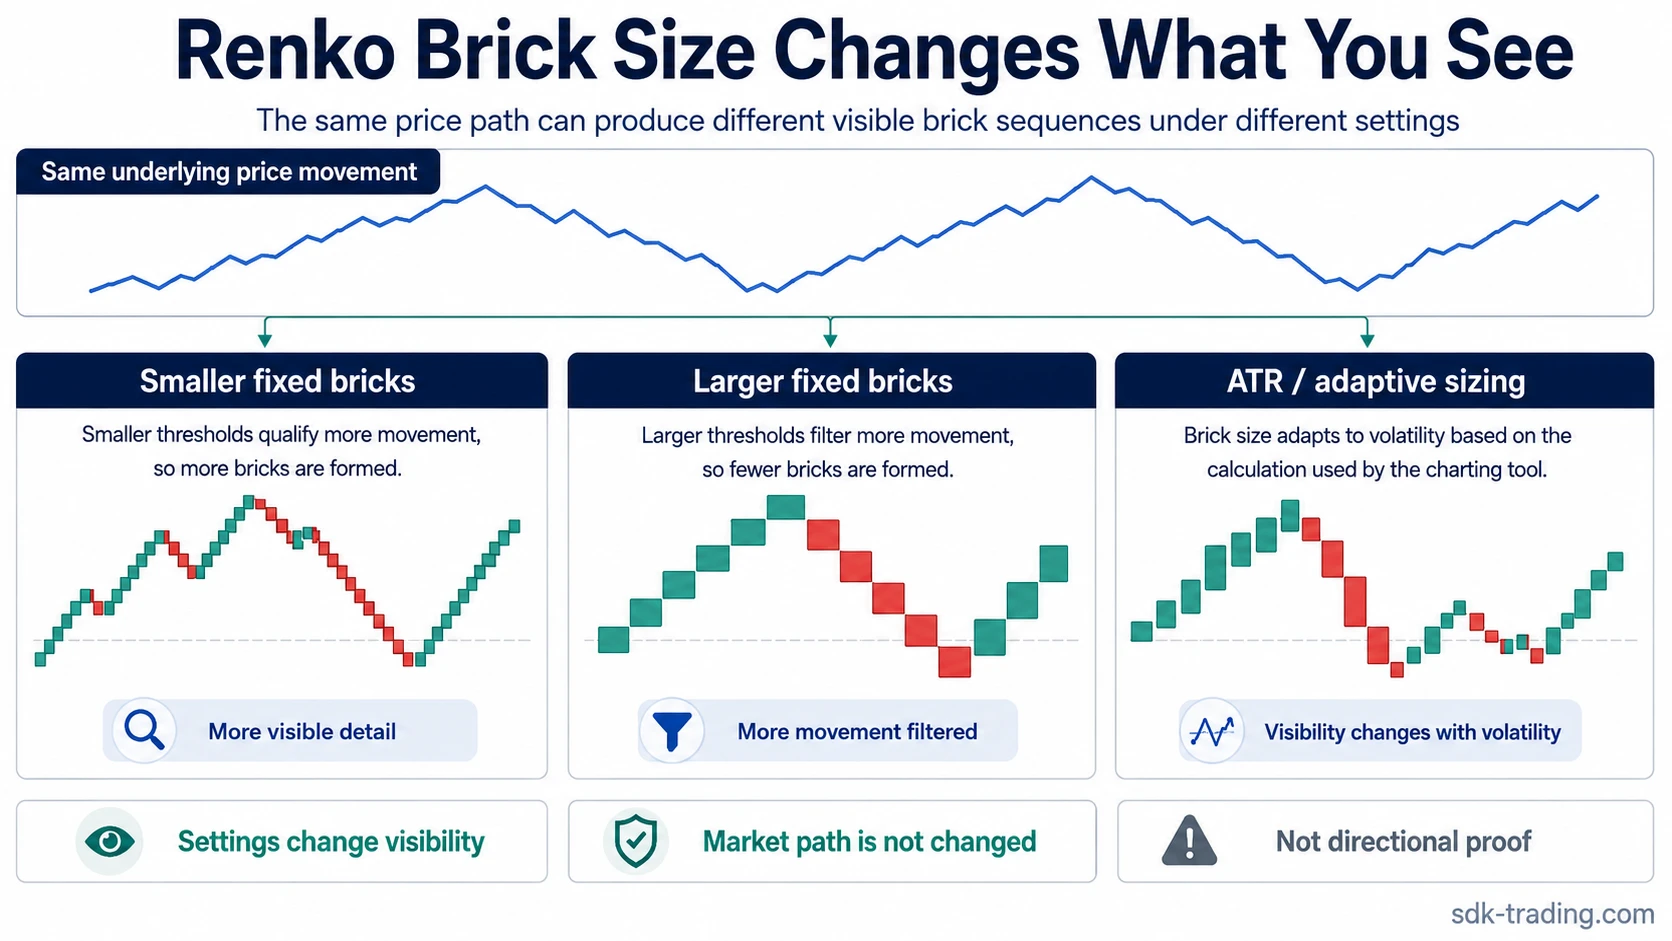
Brick size is the main setting that controls how sensitive a Renko chart is. A fixed brick size uses the same selected price amount across the chart. An ATR-based setting uses average true range as a volatility-based input, so the effective brick size can respond to the volatility calculation used by the charting tool.
A smaller fixed brick size usually shows more visible bricks because less movement is needed to create each brick. A larger fixed brick size usually hides more smaller movement and prints fewer bricks. ATR-based Renko charts can change the displayed structure when the underlying volatility input changes.
| Brick-size method | How it works | What it can show | Main caution |
|---|---|---|---|
| Fixed brick size | Uses a constant price amount for each brick. | Consistent visual thresholds across the chart. | The selected size may be too sensitive or too coarse for the current market. |
| Percentage brick size | Uses a percentage-based movement threshold. | A relative threshold that can scale with price level. | Charts may differ from fixed-size versions even on the same market. |
| ATR brick size | Uses average true range as a volatility-based sizing input. | A brick size that reflects the volatility calculation used by the platform. | ATR settings can change historical appearance depending on the tool’s calculation method. |
Setting sensitivity: Renko settings change the visible chart. They do not change the actual price path. Comparing Renko charts without checking brick size and calculation method can lead to false conclusions.
Renko Chart vs Candlestick Chart
A Renko chart and a candlestick chart can describe the same market differently because they are built from different rules. A candlestick chart normally prints bars or candles based on time intervals. A Renko chart prints bricks only when price movement satisfies the selected brick-size rule.
| Feature | Renko chart | Candlestick chart |
|---|---|---|
| Main construction basis | Price movement threshold. | Time interval plus open, high, low, and close data. |
| Visible time flow | Uneven; time can pass without new bricks. | Regular; each candle represents a selected time period. |
| Small fluctuations | Can be hidden if they do not meet the brick rule. | Usually remain visible within the candle structure. |
| Primary use | Simplifying completed price movement. | Showing time-based price behavior and intraperiod range. |
| Main limitation | Can hide timing and smaller movement details. | Can appear noisy when many small movements are shown. |
What Renko Charts Can and Cannot Tell You
Renko charts can help show how price movement looks after a selected noise-filtering rule is applied. They can make directional movement, pauses, and reversals easier to see because minor movement below the threshold is not printed as new bricks.
That filtering also creates the main limitation. A Renko chart can remove visible time flow, hide smaller volatility, and delay reversal recognition. The chart may look clean because the construction method filtered information out, not because the market became simple.
Important limitation: A Renko chart should not be read as a standalone signal. Brick sequences can describe filtered movement, but they do not remove execution risk, slippage, volatility, or the need to understand the broader market context.
Common Renko Chart Misreadings
Many Renko mistakes come from treating the filtered chart as if it were the full market record. The chart is useful only when the construction rule is understood first.
| Misreading | Why it happens | Safer interpretation |
|---|---|---|
| Assuming clean bricks prove a clean trend. | The display removes smaller movement below the threshold. | Read the brick sequence as filtered structure, not proof that volatility disappeared. |
| Comparing two Renko charts without checking settings. | Different brick sizes can produce different visible sequences. | Check brick size, calculation method, data input, and platform rules before comparing. |
| Treating every new brick as a trade signal. | A new brick can feel like confirmation because it is visually clear. | A new brick only means the construction threshold was met. |
| Ignoring hidden movement. | Movement inside the threshold does not create a visible brick. | Remember that unprinted movement still occurred in the underlying price path. |
FAQ
What does a Renko chart show?
A Renko chart shows price movement as bricks that appear only after the selected brick-size rule is satisfied. It emphasizes completed price displacement rather than fixed time intervals.
Is a Renko chart based on time?
No. A Renko chart is not based on fixed time intervals. Time can pass without a new brick if price does not move enough to satisfy the selected construction rule.
Does a new Renko brick mean a trade signal?
No. A new brick means the construction threshold was met. It does not automatically confirm direction, create an entry, or prove that a trend will continue.
Why can two Renko charts of the same market look different?
Two Renko charts can look different when they use different brick sizes, calculation methods, data inputs, or platform construction rules. The setting controls the visible structure.