Non-time-based charts build chart units from conditions such as price movement, volume, tick count, or rule-based thresholds instead of fixed clock intervals. The result is a different view of market movement, not a confirmation of direction, trade quality, timing, or outcome.
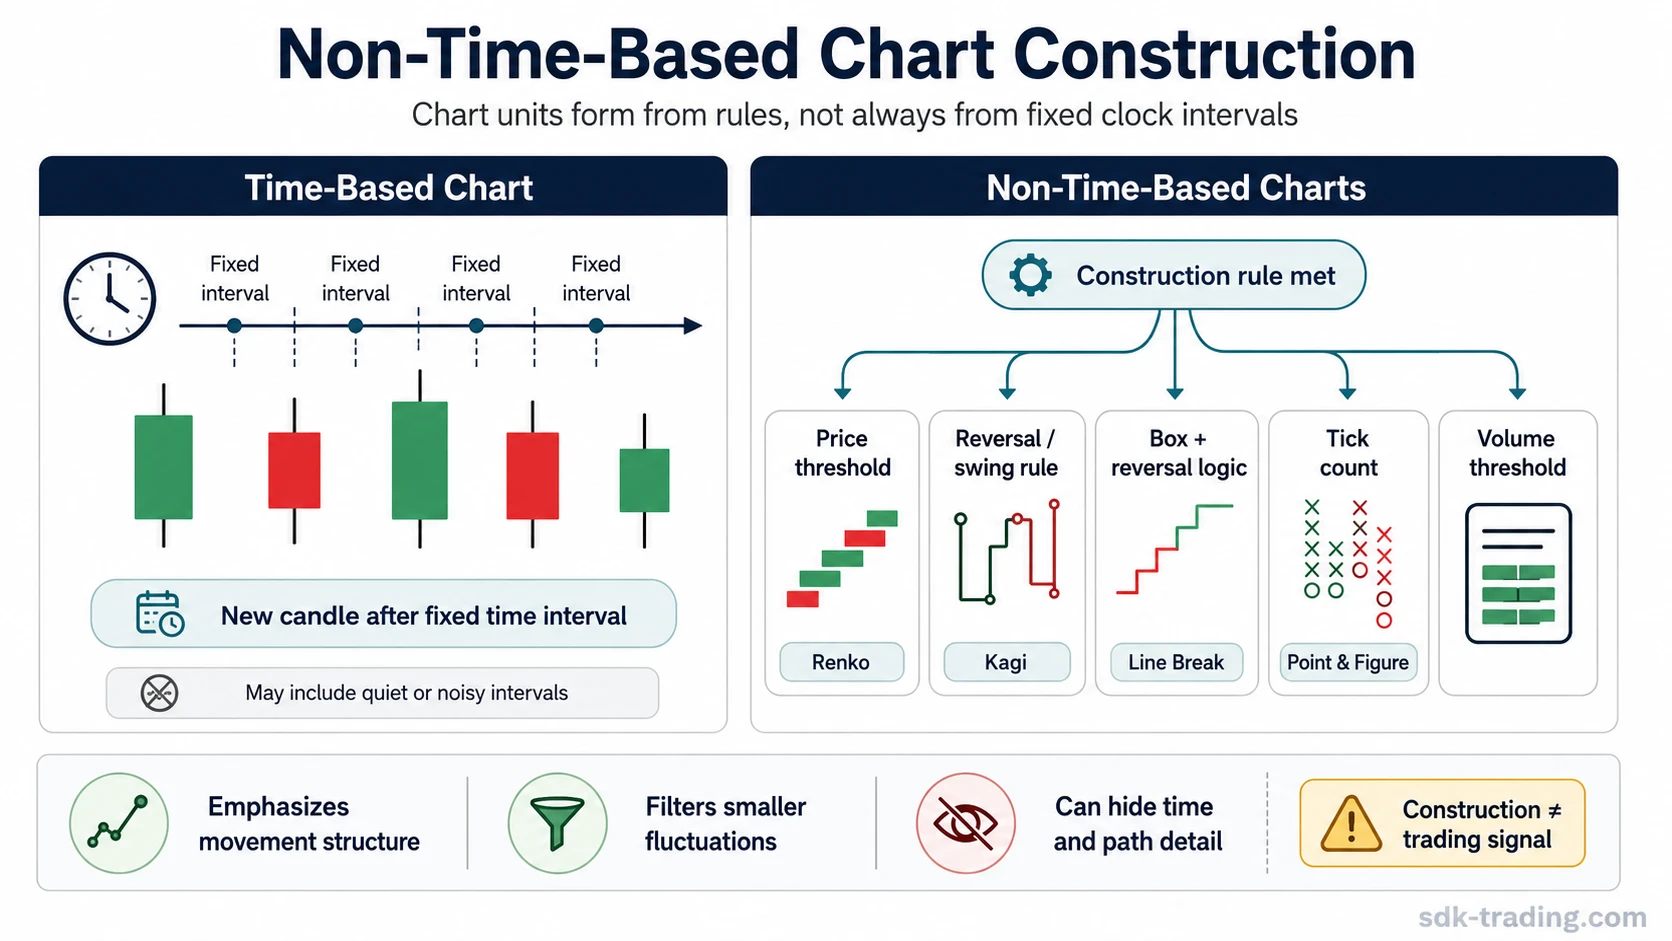
Core idea: a time-based chart prints a new candle after a set amount of time. A non-time-based chart prints a new bar, brick, column, or line only when its construction rule is met.
Key Points
- Non-time-based charts change how movement is displayed; they do not remove uncertainty.
- Different methods use different triggers: price thresholds, reversal rules, tick counts, volume thresholds, or box logic.
- Renko, Kagi, Line Break, and Point and Figure each emphasize structure differently and can hide different details.
- The selected threshold or setting can materially change the shape of the chart.
- A cleaner chart is not the same as a stronger trade decision.
What Non-Time-Based Charts Are
Non-time-based charts are charting methods that reduce the role of fixed time intervals. Instead of printing a new candle every minute, hour, or day, they wait for a specified condition to occur. That condition might be enough price movement, enough transactions, enough volume, or a reversal rule that changes the displayed structure.
The main benefit is visual filtering. Some methods compress sideways movement, reduce repeated candles, or make directional swings easier to see. The main limitation is loss of detail. A chart that filters time can also hide how long a move took, how price behaved inside the move, and which smaller fluctuations were removed by the construction rule.
Important boundary: chart construction is not a trading signal. A non-time-based chart can organize movement differently, but it does not prove continuation, reversal, entry quality, risk control, or trade outcome.
Time-Based vs Non-Time-Based Chart Construction
The key difference is the trigger that creates the next chart unit. Time-based candles are built by clock intervals. Non-time-based methods are built by conditions. That difference changes what the chart emphasizes before any interpretation begins.
| Chart construction | New unit forms when | What it emphasizes | What it can hide |
|---|---|---|---|
| Time-based candles | A fixed interval ends | Sequence by clock time | Whether the interval contained meaningful movement or mostly noise |
| Price-threshold methods | Price moves by a selected amount | Movement size and directional progression | Time spent, smaller reversals, and some intraperiod behavior |
| Transaction-count methods | A selected number of trades or ticks occurs | Activity flow rather than clock time | Low-activity time periods and some price-path context |
| Volume-threshold methods | A selected amount of volume trades | Participation and activity concentration | Quiet time, order-flow detail, and the reason volume appeared |
| Reversal or box-rule methods | A rule-defined move or reversal threshold is met | Structural swings and filtered direction changes | Minor fluctuations and the exact path between plotted units |
Main Non-Time-Based Chart Families
Non-time-based chart methods are easier to compare when grouped by construction trigger. The trigger decides what must happen before the chart updates. The interpretation should start with that rule before any pattern, trend, or reversal reading is considered.
| Method family | Construction trigger | Examples | Primary emphasis | Main limitation |
|---|---|---|---|---|
| Price movement threshold | A selected price distance is reached | Renko, range bars | Directional movement after filtering smaller fluctuations | Timing and smaller reversals can be compressed or removed |
| Reversal / swing rule | A rule-defined directional change occurs | Kagi, Line Break | Accepted movement after a reversal or continuation condition | Delayed display can make the chart look cleaner after the fact |
| Box and reversal logic | Price reaches a box size and reversal amount | Point and Figure | Columns, breakouts, reversals, and structural price zones | Time and intrabox movement are largely de-emphasized |
| Tick count | A selected number of transactions occurs | Tick charts | Market activity independent of clock intervals | Transaction count does not reveal trade size or intent by itself |
| Volume threshold | A selected amount of volume trades | Volume charts | Participation intensity and activity clustering | Volume alone does not identify absorption, continuation, or reversal |
Which Chart Method Fits Each Construction Question
Each core method answers a different chart-construction question. The best next concept depends on whether the main confusion is about bricks, swing rules, line progression, or box-and-column structure.
| Chart method | Best starting question | What to focus on first | Detailed method |
|---|---|---|---|
| Renko | How does a chart look when movement is rebuilt into fixed bricks? | Brick size, directional filtering, and the loss of time detail | Renko chart |
| Kagi | How does a chart change when direction and reversal thresholds define the structure? | Line direction, thickness changes, reversal amount, and acceptance behavior | Kagi chart |
| Line Break | How does a chart form when new lines depend on previous price progress? | Line continuation, reversal conditions, and sequence filtering | Line Break chart |
| Point and Figure | How does a chart work when columns, boxes, and reversals replace candles? | Box size, reversal amount, X/O columns, and structural levels | Point and Figure chart |
Range, tick, and volume charts can also belong to the broader non-time-based family, but the strongest chart-method depth here begins with the four core methods above.
What These Charts Emphasize and What They Hide
A non-time-based chart is a filter. The filter can make one part of market behavior more visible while pushing another part into the background. The safer reading starts by naming both sides of that trade-off.
| Method | Emphasizes | Can hide or reduce | Safer interpretation |
|---|---|---|---|
| Renko | Price movement after the brick threshold is reached | Time, intrabrick movement, and small counter-moves | Useful for seeing filtered movement, not for proving that the next brick will continue |
| Kagi | Directional swings, reversals, and line changes | Small fluctuations and the timing of each turn | Useful for structural sequence reading, not for treating a line change as automatic confirmation |
| Line Break | Progression relative to previous lines | Some sideways behavior and smaller failed pushes | Useful for filtered sequence context, not for ignoring where the move began or failed |
| Point and Figure | Box structure, columns, and reversal thresholds | Clock time, intrabox movement, and candle-level detail | Useful for structure and levels, not for assuming that every breakout pattern has equal quality |
| Tick and volume charts | Activity-based chart formation | Quiet periods, clock-time spacing, and the reason activity increased | Useful for activity context, not for reading activity as direction by itself |
Why Settings Change the Chart
Threshold selection is part of the chart, not a minor display preference. A smaller threshold usually prints more units and preserves more movement detail. A larger threshold usually filters more movement and creates a cleaner structure, but it can also remove information that matters for interpretation.
Setting risk: brick size, range value, box size, reversal amount, tick count, and volume threshold can all change the displayed sequence. Two traders can look at the same underlying market and see different structures if their chart settings are different.
That setting sensitivity is one reason non-time-based charts should be read as transformed views of price or activity. They are not raw market truth. They are structured outputs created by a rule.
A Simple Construction Scenario
For example, imagine the same choppy price movement viewed in two ways. A time-based candle chart may print every interval, including candles with small bodies, wicks, and pauses. A threshold-based chart may ignore much of that activity until price moves far enough to create a new unit. The second view can look cleaner, but the cleaner display exists because the rule filtered information out.
The common mistake is treating the cleaner version as more certain. A filtered chart can clarify structure, but the missing details still matter when judging context, invalidation, and risk.
Where non-time-based chart readings fail
Non-time-based charts can help organize movement, but they should not be treated as standalone proof. A new brick, line, column, or box pattern is only one piece of information. The surrounding market structure, volatility, liquidity, timeframe context, and invalidation behavior still matter.
| Unsafe reading | Safer reading |
|---|---|
| A new non-time-based unit confirms direction. | It confirms only that the chart’s construction rule was met. |
| A cleaner chart means a cleaner trade. | A cleaner chart may be hiding timing, path, or failed movement detail. |
| A reversal pattern proves the market has reversed. | A reversal pattern needs context, acceptance, and invalidation awareness. |
| One chart type is best for every market. | Each method filters different information and can mislead when its settings or limitations are ignored. |
How to Use the Family Map
Start with the construction trigger. If the question is about fixed movement bricks, study Renko first. If the question is about directional line changes, study Kagi or Line Break. If the question is about boxes, columns, and reversal amounts, study Point and Figure. If the question is about activity rather than price threshold, compare tick and volume construction separately before drawing conclusions from the chart shape.
The main rule is simple: identify what caused the chart to update before interpreting what the update might mean.
FAQ
Are non-time-based charts better than time-based charts?
Not automatically. They filter information differently. A non-time-based chart can make movement structure easier to see, but it can also hide time, smaller fluctuations, and intraperiod detail.
Do non-time-based charts give trading signals?
No. They change chart construction; they do not confirm direction, continuation, reversal, trade quality, or outcome by themselves.
Which non-time-based chart should beginners study first?
Start with the construction rule. Renko is a simple brick-based example of price-threshold construction, while Kagi, Line Break, and Point and Figure require more attention to reversal, line, or box logic.