A line break chart is a non-time-based technical chart that adds a new line only when the selected closing-price rule is met. Unlike a time-based candle chart, it does not print a new unit just because a fixed clock interval has passed.
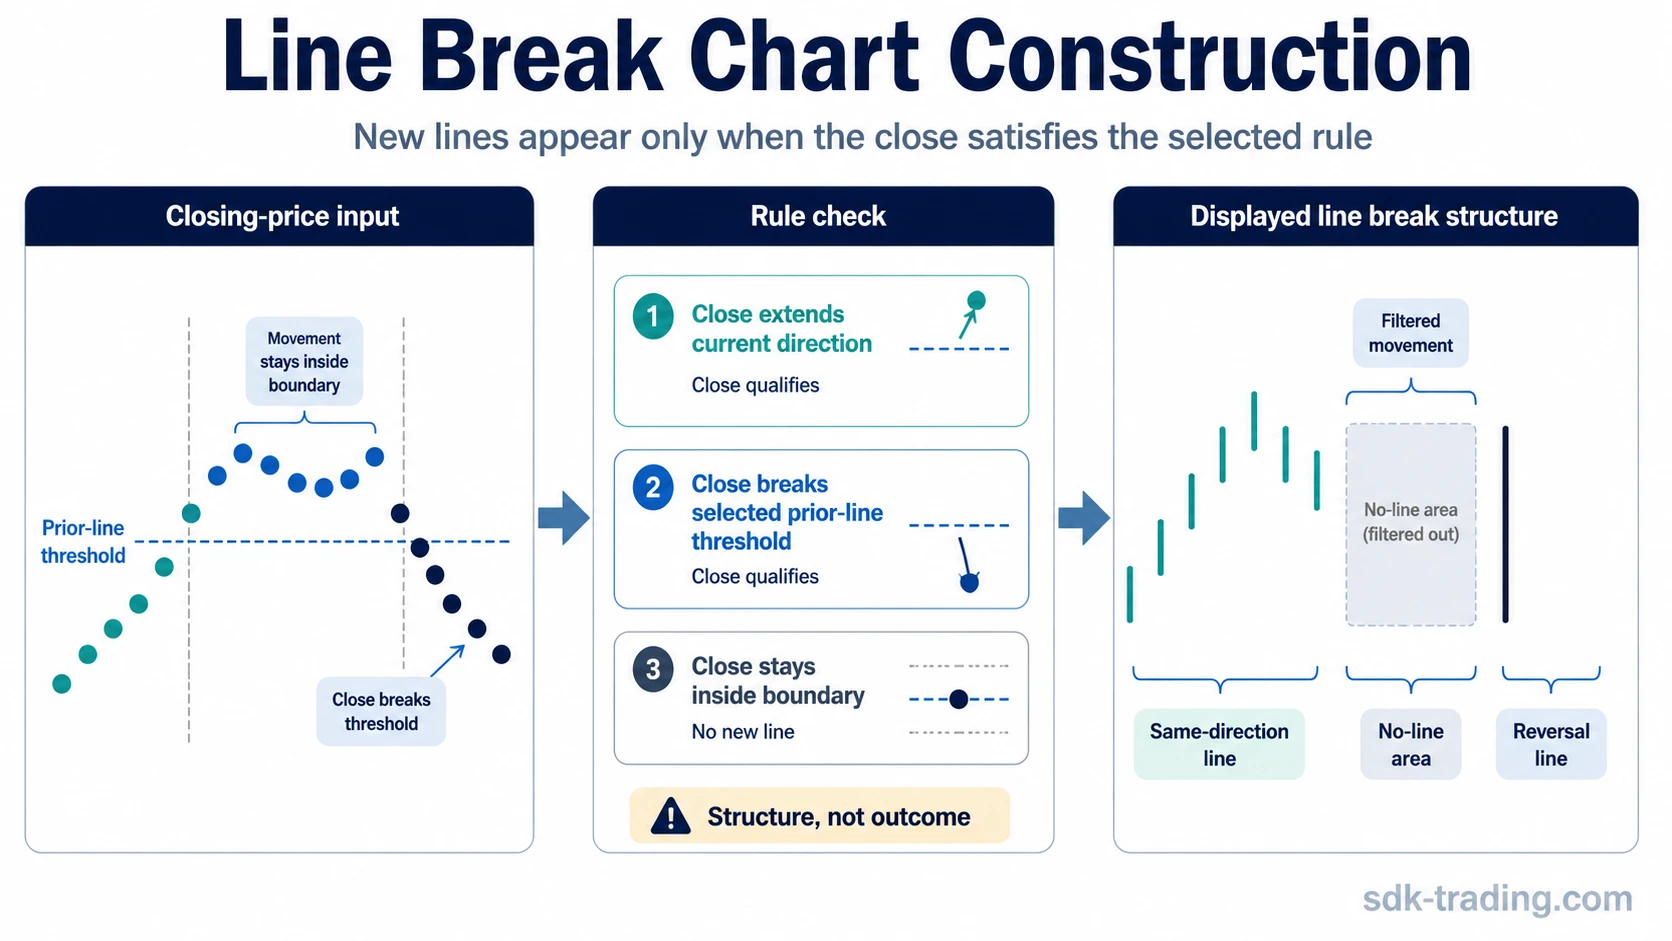
Definition: A line break chart transforms a sequence of closing prices into vertical up lines and down lines. A new line appears when the close extends the current direction or breaks a selected prior-line threshold. If the close stays inside the required boundary, no new line is added.
The common three-line break version compares the latest close with a recent group of prior lines before drawing a reversal line. That construction can make directional structure easier to inspect, but it also means smaller movement can disappear from the displayed chart.
Key Points
- A line break chart prints lines from construction rules, not fixed time intervals.
- The close is the main input used to decide whether a new line appears.
- Three-line break logic uses a selected prior-line threshold before a reversal line is drawn.
- No new line appears when the close does not exceed the required boundary.
- The chart can reduce visible noise, but it can also hide smaller movement that matters for interpretation.
- A line break structure does not prove trade direction, timing, continuation, or outcome.
What Is a Line Break Chart?
A line break chart is a rule-built price chart used in technical analysis to display directional structure without printing every time interval. The chart is usually drawn as a sequence of rising and falling vertical lines. Each line represents a closing-price event that satisfies the chart’s construction rule.
The important distinction is that line break charts are close-based. A time candle may print after one minute, one hour, or one day, depending on the selected timeframe. A line break chart waits until the close has moved far enough relative to the prior line structure.
Core idea: Time can pass without a new line. The chart updates only when the close satisfies the selected continuation or reversal rule.
How Line Break Charts Work
Line break construction begins with a closing-price sequence. The chart compares the latest close with the relevant prior line levels. If the close extends the current direction, another line can be added in that direction. If the close breaks the reversal threshold, a line can print in the opposite direction. If neither condition is met, the chart remains unchanged.
| Construction element | What it means | Why it matters |
|---|---|---|
| Close-based input | The selected close is compared with prior line levels. | Intraperiod movement may not appear if it does not affect the qualifying close. |
| Up line | A new rising line appears when the close extends above the relevant prior high boundary. | The chart records a rule-triggered continuation of upward structure. |
| Down line | A new falling line appears when the close extends below the relevant prior low boundary. | The chart records a rule-triggered continuation of downward structure. |
| Reversal line | A line in the opposite direction appears only after the close breaks the selected prior-line threshold. | The reversal is a construction event, not proof that the market must continue in that direction. |
| No-line condition | No new line appears when the close stays inside the required boundary. | The chart can hide smaller movement, pauses, and failed attempts that remain visible on time-based charts. |
This is why a line break chart can look cleaner than a normal candle chart. It filters out movement that does not meet the selected rule. The same filtering also removes detail, so the displayed structure must be read as a transformed view of price, not as a complete record of every move.
What Three-Line Break Logic Means
Three-line break logic is a common way to configure a line break chart. Instead of reversing after a minor move, the chart waits for the close to break a threshold based on the prior three lines. The selected line count controls how much movement is required before the chart draws an opposite-direction line.
- Lower line count: The chart generally becomes more sensitive, so new lines and reversals can appear more frequently.
- Three-line setting: The chart uses a three-line threshold before drawing an opposite-direction reversal line.
- Higher line count: The chart can produce fewer reversals and a smoother displayed structure, but more intermediate movement may be hidden.
Boundary: Three-line logic is a chart-construction setting. It can change how structure appears, but it does not make a reversal more certain, improve trade quality by itself, or remove the need to compare the chart with broader market context.
Line Break Chart Construction Boundary
The construction boundary is the most important part of reading a line break chart. A line does not appear because price moved during the session. It appears because the close moved far enough to satisfy the selected line-break rule.
| Condition | Chart response | Safer interpretation |
|---|---|---|
| The close extends beyond the current same-direction boundary. | A new line can print in the same direction. | The displayed structure has extended, but the chart still reflects a rule-filtered view. |
| The close breaks the selected reversal threshold. | A reversal line can print. | The chart has recorded an opposite-direction construction event, not a guaranteed trend change. |
| The close stays inside the required boundary. | No new line prints. | Movement may still have occurred, but the selected construction rule filtered it out. |
| The line count is changed. | The chart may show more or fewer lines. | A different setting can change the visible structure without changing the underlying price history. |
| A reversal line appears after a sharp move. | The chart may look decisive. | The reading weakens if the displayed structure hides smaller movement that matters for the context. |
Construction sequence: close extends current direction -> new same-direction line; close breaks the selected prior-line threshold -> reversal line; close remains inside the boundary -> no new line.
Line Break vs Nearby Non-Time-Based Charts
Line break charts belong to the same broad family as other rule-built chart types, but the construction trigger is different. The line break method focuses on closing-price breaks of prior line structure. Other chart types rebuild price movement through different rules.
| Chart type | Main construction trigger | Boundary against line break charts |
|---|---|---|
| Line break chart | Close breaks a same-direction or reversal threshold based on prior lines. | The line sequence changes only when the close satisfies the line-break rule. |
| Renko | Price movement reaches a selected brick size. | Renko is brick-threshold based; line break charts are prior-line and close-threshold based. |
| Kagi chart | Direction changes after a selected reversal amount, with thickness often used to show structural shifts. | Kagi emphasizes direction and thickness changes; line break charts emphasize line-count reversal thresholds. |
| Point and Figure chart | X/O columns form from box size and reversal rules. | Point and Figure uses box and reversal construction; line break charts use prior-line close comparisons. |
The shared feature is that these charts reduce the role of fixed clock intervals. The important difference is the construction rule that decides when a new visible unit appears.
Example Scenario: When No New Line Prints
Example: Price has already formed several rising line break lines. Several later closes trade between the level needed to extend the current line and the level needed to trigger a reversal. A candle chart would show each interval inside that range. The line break chart stays unchanged until one close crosses the selected construction boundary.
The same situation can become easy to misread. A clean line break chart may suggest a calm structure while the time-based chart shows repeated tests, wicks, and failed attempts inside the filtered area. The line break view is useful only when the missing detail is understood as part of the method, not as evidence that the smaller movement did not matter.
Strengths, Limitations, and Common Misreadings
Line break charts can make directional structure easier to inspect because they remove many small movements that do not satisfy the selected rule. That can help separate visible structure from ordinary interval-by-interval fluctuation.
| Aspect | Useful reading | Common misreading |
|---|---|---|
| Cleaner structure | The chart can reduce visual clutter from minor movement. | Clean structure does not mean the market is easier to forecast. |
| Reversal line | The close has crossed the selected reversal threshold. | A reversal line does not prove that the next move must continue. |
| No-line condition | The close has not met the construction rule. | No new line does not mean nothing meaningful happened inside the filtered area. |
| Line-count setting | The selected sensitivity changes the displayed chart. | A smoother setting is not automatically more reliable. |
| Support and resistance observations | Prior line highs and lows may help organize visible structure. | Displayed levels should not be treated as complete market context by themselves. |
Limitation: A line break chart is a construction filter. It can clarify certain directional changes, but it can also hide smaller price movement, setting sensitivity, and time-based behavior that may change the interpretation.
How to Read Line Break Structure
- Start with the selected line count: The number of lines controls how much movement is needed before reversal appears.
- Check whether the latest line is an extension or reversal: A same-direction line and an opposite-direction line carry different construction meanings.
- Identify the no-line area: Price can move inside the construction boundary without printing a new line.
- Compare hidden movement when needed: A time-based chart can reveal movement that the line break chart filtered out.
- Keep interpretation conditional: A line break structure can organize observation, but it does not prove direction, timing, or outcome.
Settings note: Charting platforms can expose line-count and calculation settings differently, so the selected settings should be checked before comparing two line break charts.
FAQ
What is a line break chart?
A line break chart is a non-time-based technical chart that adds a new up or down line only when the closing price satisfies the selected construction rule.
How does a line break chart work?
It compares the latest close with prior line levels. A new line prints when the close extends the current direction or breaks the selected reversal threshold. If the close remains inside the boundary, no line prints.
Is a three-line break chart the same as a line break chart?
A three-line break chart is a common line break configuration. It uses a three-line threshold before drawing an opposite-direction reversal line, but the broader chart family can use different line-count settings.
How is a line break chart different from Renko or Kagi?
A line break chart uses close-based prior-line thresholds. Renko uses brick-size thresholds, while Kagi uses direction and reversal logic that can include thickness changes.
What are the main limitations of line break charts?
Line break charts can hide smaller movement, depend heavily on the selected line count, and make structure look cleaner than the underlying price action. They do not prove trade direction, timing, continuation, or outcome.