Buy side liquidity is buy-stop liquidity that tends to rest above visible highs, equal highs, range highs, resistance areas, session highs, or other obvious upper boundaries on a chart.
It is not the same as ordinary resistance, and it is not an automatic reversal signal. The useful reading comes from the order cluster above the level, the move into that cluster, and the later behavior that shows whether price rejected the area or accepted above it.
Key Points
- Buy side liquidity usually rests above visible highs, equal highs, range highs, or other upper-side chart boundaries.
- It often reflects buy-stop orders from short exits, breakout entries, or clustered attention around obvious highs.
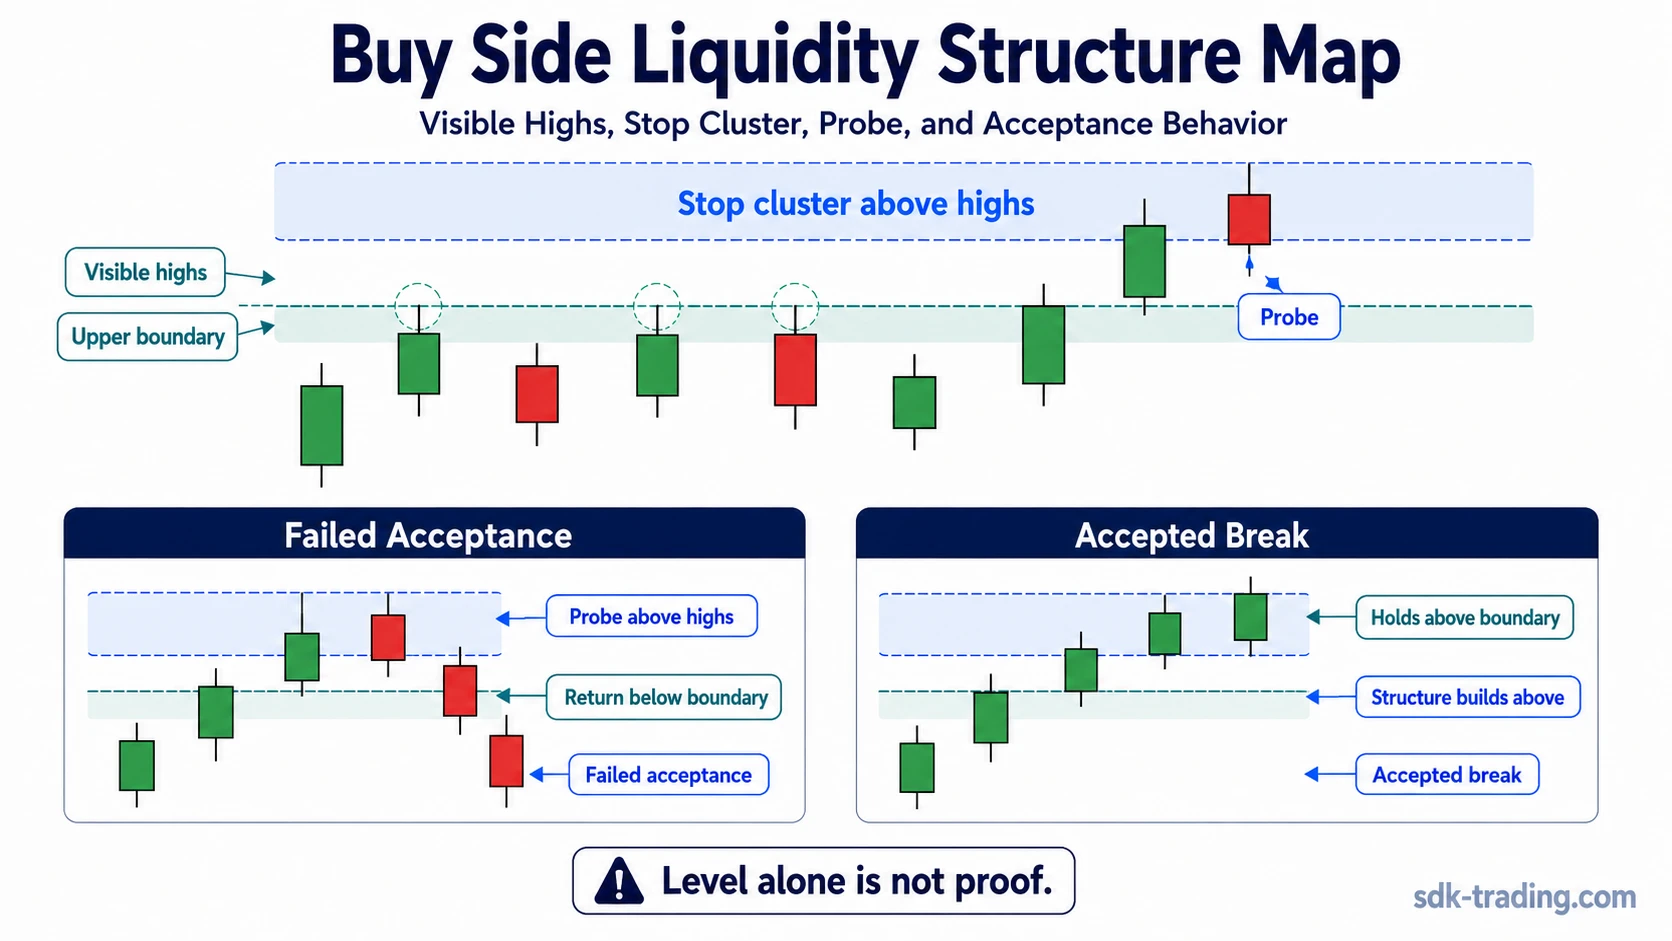
- The level alone does not prove a reversal, sweep, continuation, or trade setup.
- A sweep reading needs failed acceptance after the probe, while an accepted break holds above the level.
- The cleanest reading comes from location, probe, reaction, and later acceptance behavior together.
What Is Buy Side Liquidity?
Buy side liquidity is a concentration of buy orders above a visible upper-side level. In chart-reading language, the phrase usually refers to the buy stops that may sit above swing highs, equal highs, range highs, previous highs, or repeated resistance areas.
The orders are called buy-side because they are orders to buy when price trades through or above the upper boundary. Some of those orders can come from short sellers using protective stops. Others can come from breakout traders who want confirmation above an obvious high.
Definition: buy side liquidity is the pool of potential buy-stop orders above a visible high or upper boundary, not the high itself.
A high can be visible without creating a strong liquidity reading. Buy side liquidity becomes more relevant when the level is obvious enough for many participants to place similar orders around it.
Where Buy Side Liquidity Forms
Buy side liquidity usually forms where upper-side reference points are easy to see. The cleaner and more repeated the level, the more likely it is that orders may cluster above it.
| Location | Why it can attract buy-side orders | Reading caution |
|---|---|---|
| Swing highs | Short sellers may place protective buy stops above the high. | A single high is weaker than a repeated or widely visible level. |
| Equal highs | Repeated alignment can make the upper boundary obvious. | Equal highs do not guarantee a sweep or reversal. |
| Range highs | Range traders and breakout traders often watch the same ceiling. | Acceptance above the range can shift the reading away from a failed break. |
| Previous day, week, or month highs | Higher-timeframe highs can become widely watched reference points. | The level needs context from the current structure, not just calendar importance. |
| Session highs | Intraday participants may cluster stops or breakout orders above the session extreme. | Thin liquidity around a session high can create a sharp move without a clean reading. |
| Round numbers near highs | Round levels can concentrate attention when they align with visible structure. | A round number alone is not enough without chart-level relevance. |
Why Buy Side Liquidity Forms Above Highs
Buy side liquidity forms above highs because different participants can place buy orders in the same area for different reasons. A short seller may use a buy stop to exit if price breaks above a high. A breakout trader may use a buy stop to enter if price clears resistance. Both order types can sit above the same visible boundary.
That shared location is what creates the liquidity pool. The level is visible first. The orders gather around it second. The later price response determines whether the move above the level was only a probe, a sweep with failed acceptance, or a stronger accepted break.
A buy side liquidity area is best read as a location of potential order concentration. It does not predict direction by itself.
Common Misunderstanding: Buy Side Liquidity Is Not Just Resistance
Resistance describes an area where price has previously struggled to move higher. Buy side liquidity describes the potential buy orders resting above a visible upper boundary. The two can overlap, but they are not identical.
A resistance level focuses on price reaction around the ceiling. Buy side liquidity focuses on what may be resting above that ceiling. A move through the level may trigger orders, expose thin liquidity, or test whether the market accepts higher prices.
| Misreading | Cleaner interpretation |
|---|---|
| Buy side liquidity means price must reverse. | It only identifies a potential buy-stop cluster. Reversal depends on failed acceptance and later reaction. |
| Every resistance level is buy side liquidity. | The stronger reading needs visible order-clustering conditions, such as repeated highs or obvious upper boundaries. |
| A wick above the high completes the reading. | A wick is only a probe unless later behavior shows rejection, failed acceptance, or continuation. |
| Buy side liquidity is a complete setup. | It is one structural location. It still needs context, confirmation, and invalidation logic. |
Buy Side Liquidity vs Sell Side Liquidity
Buy side liquidity sits above visible highs because the relevant orders are buy orders. Sell side liquidity sits below visible lows because the relevant orders are sell orders.
The direction of the boundary changes the label. Upper-side highs, equal highs, and range highs point to buy side liquidity. Lower-side lows, equal lows, and range lows point to sell side liquidity.
| Liquidity type | Typical location | Common order logic | Main reading question |
|---|---|---|---|
| Buy side liquidity | Above highs or upper boundaries | Buy stops from short exits and breakout entries | Did price accept above the high or fail after the probe? |
| Sell side liquidity | Below lows or lower boundaries | Sell stops from long exits and breakdown entries | Did price accept below the low or reclaim after the probe? |
Sweep vs Accepted Break
A move above buy side liquidity can have different meanings depending on what happens after price trades through the level. The first move above the high only shows that the upper-side area was probed. It does not prove a reversal, continuation, or trap by itself.
A liquidity sweep reading becomes more defensible when price trades above the high, fails to hold above it, and returns below the broken boundary with visible rejection or failed acceptance. An accepted break is different. It develops when price holds above the level, continues building structure above it, or treats the old high as a usable support area after the break.
| Post-probe behavior | What it suggests | What would weaken the reading |
|---|---|---|
| Sharp move above the high followed by a fast return below it | Possible sweep or failed acceptance | No follow-through rejection, immediate recovery above the level |
| Price hovers above the high and builds structure there | Possible accepted break | Sudden loss of the level and failure to reclaim it |
| Price breaks above the high and continues cleanly higher | Continuation is more relevant than failed-break logic | Weak continuation and repeated return below the old high |
| Price wicks above the high in thin conditions but gives no clear reaction | Low-quality or noisy reading | Lack of structure, lack of follow-through, unclear acceptance |
What Makes the Reading Clean, Weak, or Invalid
A cleaner buy side liquidity reading has more than a visible high. It has a clear upper boundary, a logical reason for stops or breakout orders to cluster above it, a probe into that area, and later behavior that confirms whether price failed or accepted beyond the level.
| Reading quality | Typical conditions | Interpretation |
|---|---|---|
| Clean | Visible highs or equal highs, clear probe above the level, rejection back below, weak reclaim attempt, no stable acceptance above the boundary | The failed-acceptance reading is more defensible. |
| Weak | One unclear high, thin participation, small wick above the level, mixed follow-through, no decisive rejection or continuation | The level may still matter, but the liquidity reading is incomplete. |
| Invalid or changed | Price accepts above the level, continues higher, or repeatedly holds the old high as support | The reading shifts toward accepted break or continuation rather than failed buy-side probe. |
Diagnostic Boundary
The safest way to read buy side liquidity is to separate location, trigger, and later acceptance. The location identifies where orders may sit. The trigger shows price entering that area. The later behavior decides whether the move was rejected, accepted, or too unclear to label cleanly.
| Diagnostic lens | Use it this way |
|---|---|
| What it is | A potential concentration of buy-stop orders above visible highs or upper boundaries. |
| What it is not | It is not ordinary resistance, a guaranteed reversal point, or a complete trading setup. |
| What strengthens it | Repeated highs, obvious range highs, visible prior highs, clean probe above the level, and failed acceptance after the probe. |
| What weakens it | Unclear structure, thin liquidity, no reaction after the probe, or mixed behavior around the boundary. |
| What invalidates or changes it | Sustained acceptance above the level, continuation above the old high, or support forming after the break. |
Practical Scenario
A market trades inside a range and forms several similar highs near the same upper boundary. Short sellers may place protective buy stops above that area, while breakout traders may place buy stops slightly higher to participate if the range breaks upward.
If price pushes above the range high and then quickly falls back inside the range, the move can be read as a possible failed acceptance above buy side liquidity. If price instead holds above the high and continues building structure above it, the better reading is an accepted break, not a failed buy-side probe.
FAQ
What is buy side liquidity?
Buy side liquidity is potential buy-stop liquidity above visible highs, equal highs, range highs, resistance areas, or other upper-side chart boundaries.
How do you identify buy side liquidity?
Look for visible upper-side levels where orders may cluster, such as swing highs, equal highs, range highs, previous highs, session highs, or round numbers that align with structure.
Is buy side liquidity the same as resistance?
No. Resistance describes an area where price has struggled to move higher. Buy side liquidity describes potential buy orders above a visible upper boundary.
Does buy side liquidity mean price will reverse?
No. Price can reject the area, sweep it and return below it, accept above it, or continue higher. The later behavior determines the cleaner reading.
What is the difference between a sweep and an accepted break?
A sweep reading needs a move above the level followed by failed acceptance. An accepted break develops when price holds above the level and builds structure beyond it.