Sell side liquidity is resting sell-side order interest that traders commonly locate below visible downside boundaries such as swing lows, equal lows, range lows, and support areas. In price-action analysis, the important question is not only whether price trades below that boundary, but whether it fails to accept there or starts developing below the old level.
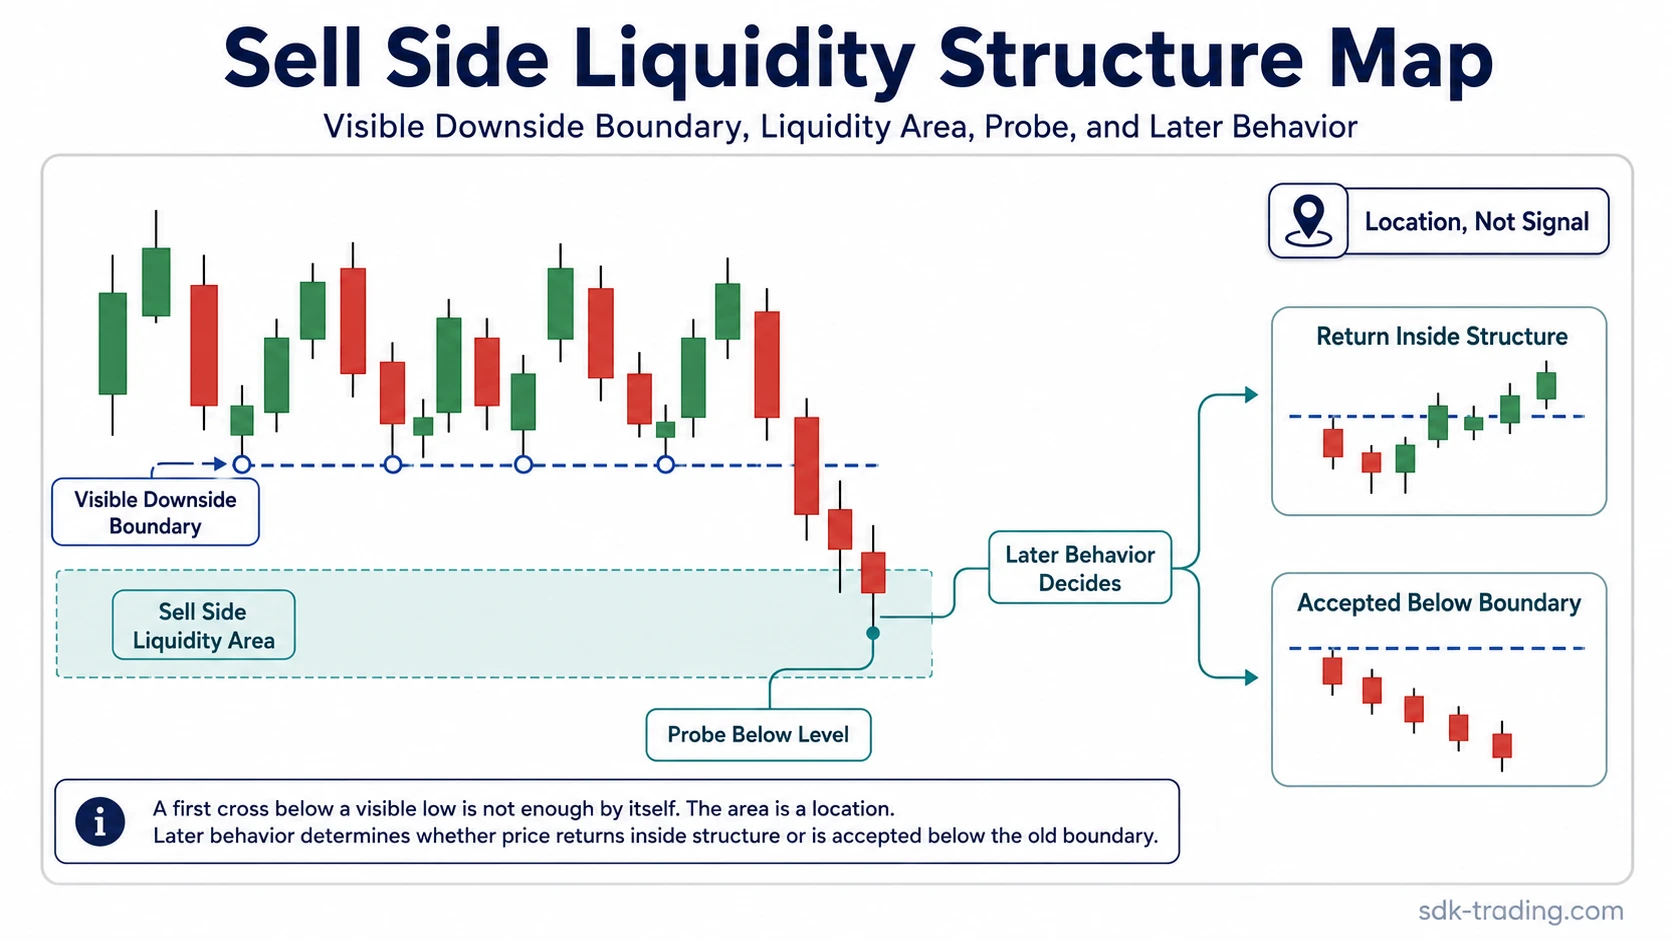
Definition: Sell side liquidity refers to the pool of sell-side orders and stop-related order flow that can sit below visible lows or downside reference levels. It is a structural location on the chart, not a reversal signal by itself.
A move below sell side liquidity can produce different readings. A brief probe that returns back inside the prior structure can support a failed-acceptance reading. A move that holds below the old boundary and builds further activity there points toward accepted development, which weakens or invalidates a simple sweep interpretation.
Key Points
- Sell side liquidity usually forms below visible lows, equal lows, range lows, session lows, prior-period lows, or clear support areas.
- The level itself is only a location where order flow may concentrate. Later behavior decides whether the move below it is rejected or accepted.
- A first cross below the boundary does not confirm a sweep, reversal, or failed break.
- The cleanest readings separate boundary quality, probe behavior, close location, return behavior, and later acceptance.
- Sell side liquidity is the downside counterpart to buy side liquidity, but the two concepts should not be collapsed into the same reading.
What Is Sell Side Liquidity?
Sell side liquidity is the order-flow area that may exist below a visible downside boundary. The boundary can be a prior swing low, a cluster of similar lows, a range low, a support level, or a prior session low that many traders can see on the chart.
The term is often used because orders can collect around obvious lows. Some participants may place protective stop orders below a prior low, while others may wait for a break before acting. The result is a visible area where activity can increase if price trades through the level.
Important distinction: Sell side liquidity describes where order flow may sit. It does not explain why every participant acts, and it does not prove that a specific group intentionally moved price through the level.
Where Sell Side Liquidity Forms
Sell side liquidity is easiest to discuss when the downside boundary is visible enough to attract attention. A single random low is weaker than a repeated level, a completed swing, or a range edge that price has respected more than once.
| Location | Why it can matter | Reading risk |
|---|---|---|
| Swing low | A completed downside pivot gives the market a clear reference point. | The level is weaker if the swing is minor or hard to distinguish from noise. |
| Equal lows | Several similar lows can create a more visible downside boundary. | The reading weakens if the lows are scattered, uneven, or already swept several times. |
| Range low | A range edge can concentrate attention because it separates balance from possible expansion. | A sustained move below the range can become accepted development rather than a failed probe. |
| Support area | A level that has repeatedly held can become a shared downside reference. | Support language can create false confidence if later price action accepts below the area. |
| Prior session or prior-period low | Session lows, prior day lows, and similar references can become visible liquidity points. | The level should still be judged by context, not by the label alone. |
How to Identify Sell Side Liquidity
Sell side liquidity is identified by looking for a visible downside boundary first, then judging how price behaves around the area. The boundary comes before the interpretation. Without a clear boundary, the reading becomes too subjective.
- Find the visible downside reference. Look for a completed swing low, equal lows, a range low, or a support area that stands out on the chart.
- Check boundary quality. A clean boundary is easier to interpret than a noisy cluster of uneven lows.
- Watch the probe below the level. The first trade below the boundary only confirms that the level was crossed.
- Compare close and follow-through behavior. Rejection back inside the old structure is different from sustained trading below the boundary.
- Separate failed acceptance from accepted development. A failed break and an accepted break can begin with the same first cross below the level.
Limitation: A visible low does not automatically create a high-quality sell side liquidity reading. Weak boundaries, repeated prior probes, and fast acceptance below the level can make the interpretation less reliable.
Sell Side Liquidity vs Buy Side Liquidity
Sell side liquidity sits below visible downside boundaries. Buy side liquidity sits above visible upside boundaries. The distinction is directional: one is tied to downside reference levels, while the other is tied to upside reference levels.
| Concept | Common location | Basic interpretation |
|---|---|---|
| Sell side liquidity | Below swing lows, equal lows, range lows, or support | A downside liquidity area that may be tested, rejected, or accepted. |
| Buy side liquidity | Above swing highs, equal highs, range highs, or resistance | An upside liquidity area that may be tested, rejected, or accepted. |
The distinction is narrow but important. Sell side liquidity concerns downside reference levels, while buy side liquidity concerns upside reference levels. Both can be tested, rejected, or accepted, so the label should follow the level location and the later behavior rather than imply a trade direction.
Sell Side Liquidity Sweep vs Accepted Break
A move below sell side liquidity can look similar at the first moment of the break. The difference develops after the boundary is crossed.
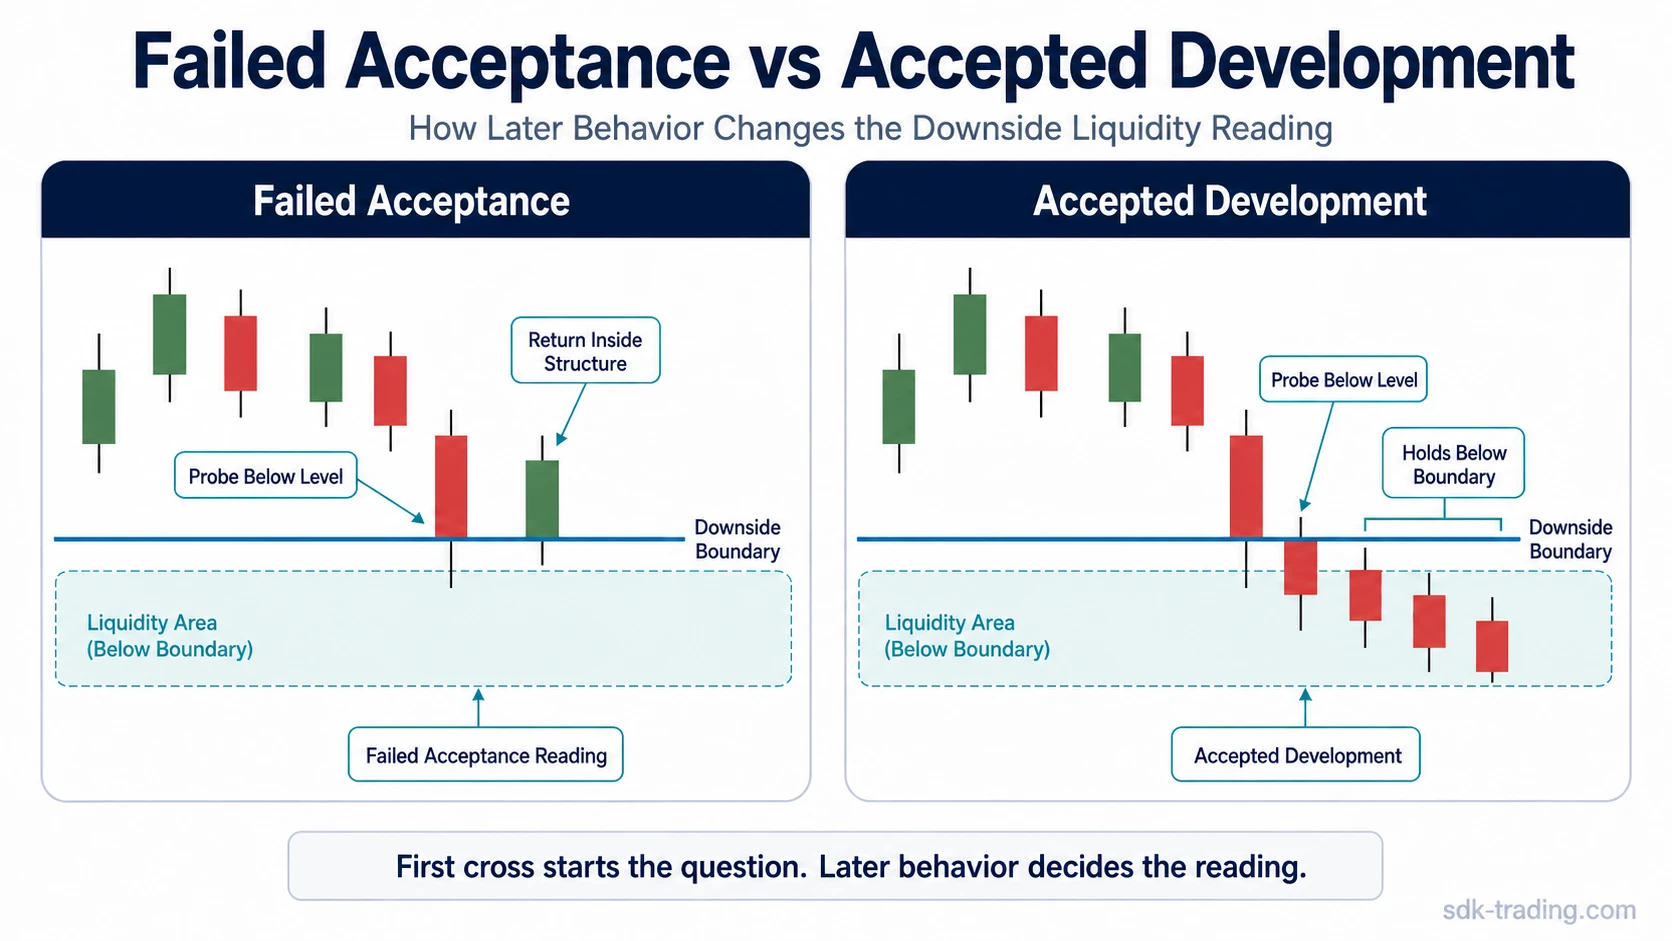
A failed-acceptance reading becomes more coherent when price probes below the visible low, fails to remain below it, and returns back into the prior structure. That type of behavior can overlap with a liquidity sweep reading because the level is tested without sustained acceptance beyond it.
An accepted break is different. If price trades below the old boundary, holds there, and starts building further activity beneath it, the old support area may no longer be acting as a failed probe. The reading shifts toward accepted development below the prior structure.
Diagnostic rule: The first cross below a low starts the question. The close, return attempt, and later acceptance behavior decide whether the reading remains a failed probe or becomes accepted development.
Clean, Weak, and Invalid Sell Side Liquidity Readings
The strongest sell side liquidity readings are not based on the word “liquidity” alone. They depend on boundary quality and what happens after the boundary is tested.
| Reading type | Typical structure | Safer interpretation |
|---|---|---|
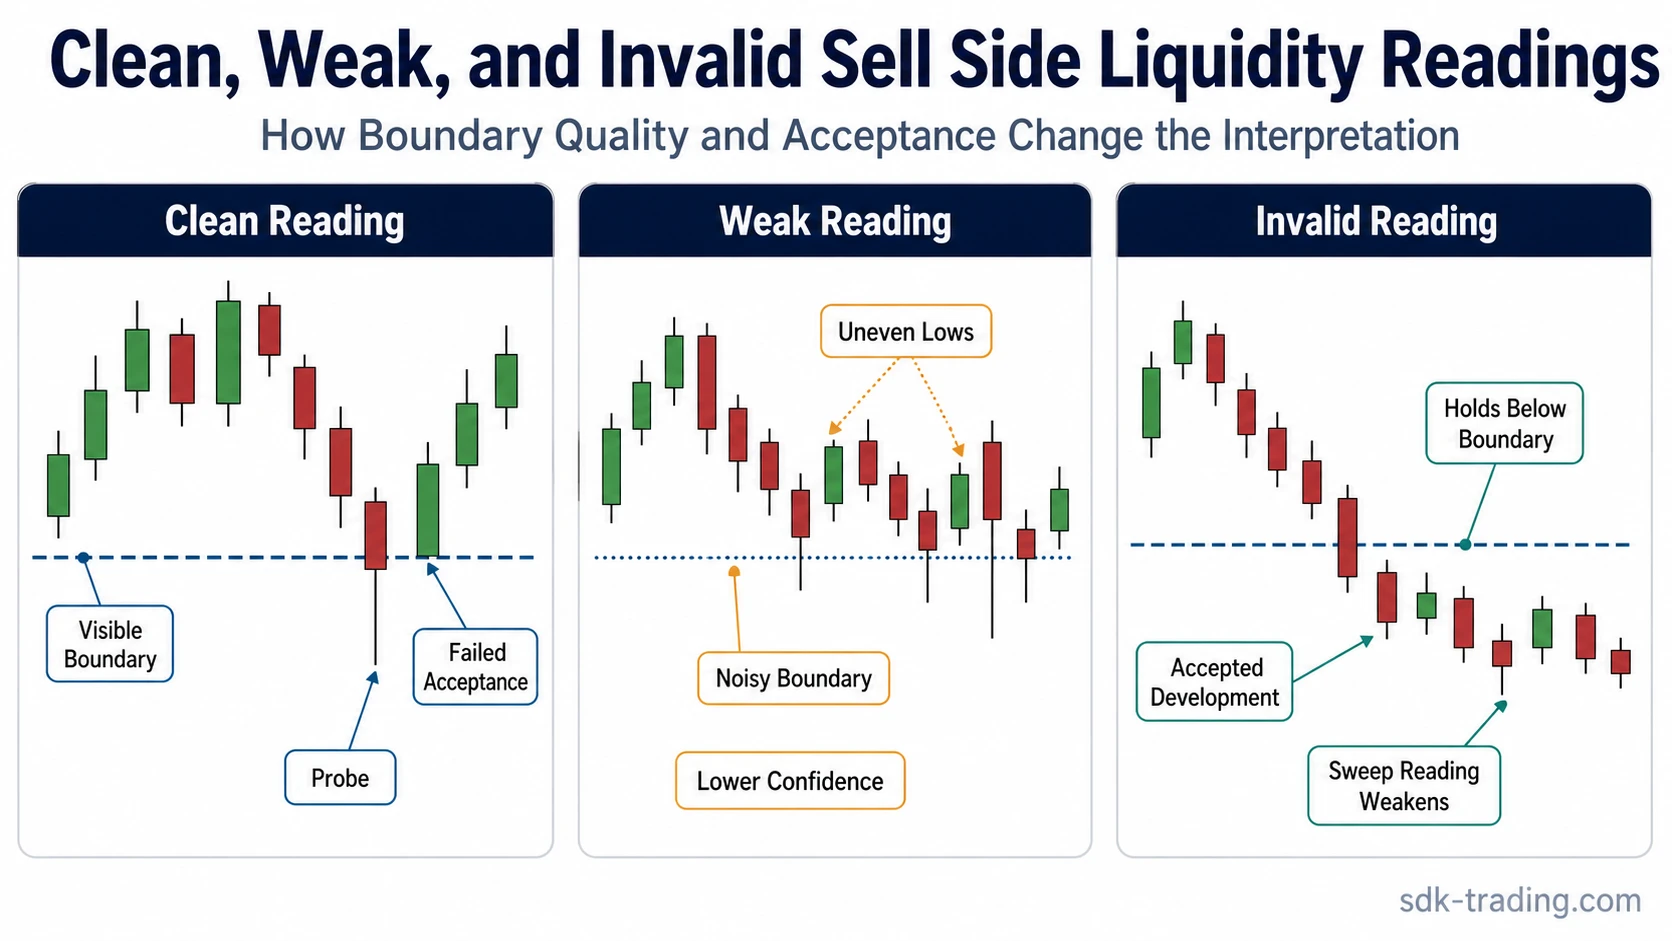
| Clean reading | A visible downside boundary forms, price probes below it, and later behavior fails to accept below the old level. | The level remains a coherent sell side liquidity area because the market tested it without sustained development below it. |
| Weak reading | The lows are uneven, the boundary is not obvious, or the area has already been tested repeatedly. | The liquidity idea may still be relevant, but the boundary does not give a strong diagnostic reference. |
| Invalid or no longer active reading | Price breaks below the boundary, holds below it, and begins building acceptance beneath the old level. | The old sell side liquidity reading weakens because the market is no longer simply rejecting the area below the boundary. |
Simple Sell Side Liquidity Example
A market builds several similar lows near the bottom of a range. The area becomes visible because each decline stops near the same downside boundary. Price then trades slightly below those lows. At that moment, the only confirmed fact is that the boundary has been crossed.
The reading changes with the next behavior. If price quickly returns inside the range and cannot continue below the old lows, the move can be read as a failed acceptance below sell side liquidity. If price holds below the old lows and begins to develop beneath them, the same initial cross becomes closer to accepted downside development.
Common Mistakes When Reading Sell Side Liquidity
Most mistakes come from treating a location as a conclusion. Sell side liquidity marks an area to observe, but it does not decide the outcome by itself.
| Mistake | Why it is a problem | Safer reading |
|---|---|---|
| Calling every wick below a low a sweep | A wick only shows that price crossed the level. | Check whether the market rejects the area or accepts below it. |
| Assuming sell side liquidity means reversal | A downside probe can fail, but it can also become a real break. | Separate liquidity location from later confirmation or invalidation. |
| Ignoring boundary quality | Noisy or unclear lows make the reading more subjective. | Give more weight to clean, visible, repeated, or completed downside references. |
| Using institutional motive certainty | The chart does not prove why every participant acted. | Use observable order-flow location and price behavior instead of motive claims. |
| Missing accepted development | A move can continue below the old boundary after the first probe. | Treat sustained development below the old level as a reason to weaken or invalidate the failed-probe reading. |
Sell Side Liquidity, Liquidity Grabs, and Liquidity Sweeps
Sell side liquidity is the downside area. A liquidity grab describes a brief probe through a visible liquidity area that fails to hold outside the prior structure. A liquidity sweep uses similar boundary logic but usually places more emphasis on the test of the level and the later failure or acceptance behavior.
That distinction matters because the same downside level can produce different readings. The level can be tested and rejected, tested and left unresolved, or broken and accepted. The label should follow the behavior rather than appear before it.
When the Reading Should Be Treated Carefully
Sell side liquidity readings become less useful when the boundary is unclear, when the area has already been repeatedly disturbed, or when price accepts below the old structure. Fast movement through the level can also make the first reaction look clearer than the later structure actually supports.
Boundary condition: Sell side liquidity remains a useful concept only when the downside reference is visible and later behavior can be compared against that reference. Without a clear boundary, the reading becomes too easy to force onto any decline.
FAQ
What does sell side liquidity mean?
Sell side liquidity means resting sell-side order interest that can sit below visible downside boundaries such as swing lows, equal lows, range lows, or support areas.
Does sell side liquidity confirm a reversal?
No. Sell side liquidity is a structural location below visible lows. A reversal-style reading only becomes more coherent if later behavior rejects the lower area and returns back inside prior structure.
What makes a sell side liquidity area clearer?
A clearer area usually has a visible downside boundary, such as equal lows, a completed swing low, a range low, or a support area that later behavior can be compared against.
What invalidates a sell side liquidity sweep reading?
A sweep-style reading weakens when price holds below the old boundary and builds accepted development beneath it instead of returning back inside the prior structure.