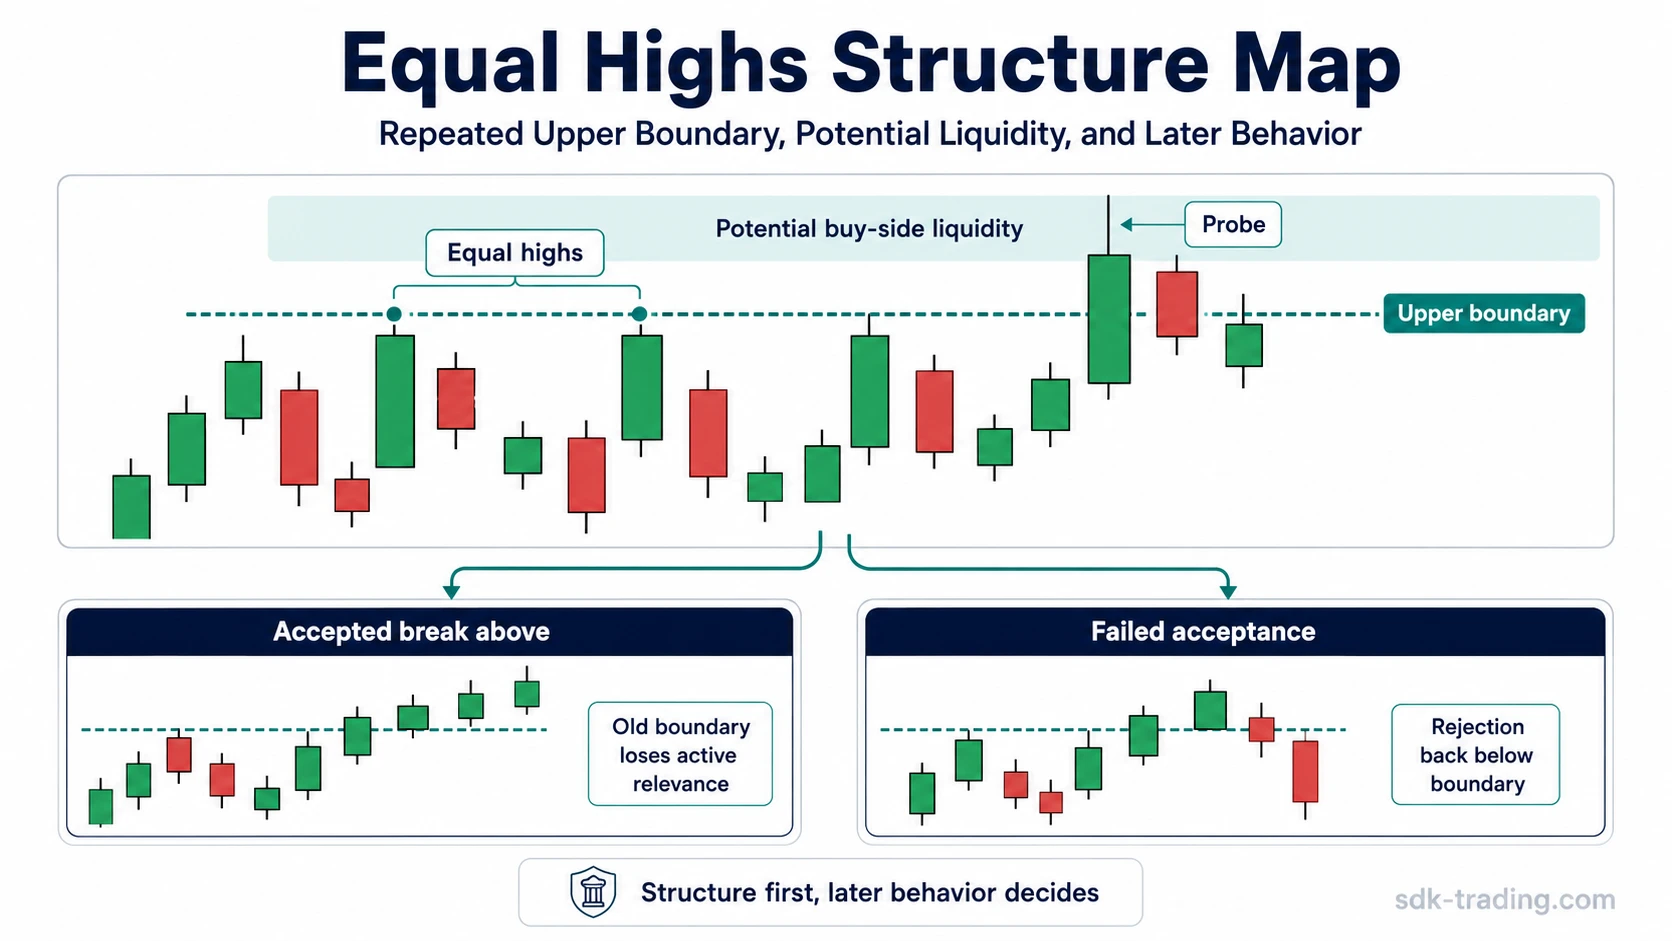
Equal highs are two or more completed swing highs that form near the same upper price area, creating a visible horizontal boundary on a trading chart. The highs do not need to match at the exact same price. The useful feature is the repeated upper boundary and the later behavior around it.
In price action and liquidity analysis, this structure can mark a potential buy-side liquidity area above the visible boundary. That does not make it a standalone reversal signal, a trade entry, or a guaranteed target. The reading depends on whether price later accepts above the area, rejects back below it, or leaves the structure unresolved.
Key Points
- Equal highs are repeated completed swing highs clustered near the same upper area.
- Exact price equality is not required; visible clustering around a shared boundary matters more.
- The area above the boundary may represent potential buy-side liquidity, not a guaranteed sweep.
- Acceptance above the boundary can reduce or invalidate the old equal-highs reading.
- The structure is context, not an entry signal, reversal signal, or target rule.
What Are Equal Highs?
Equal highs are a market-structure pattern where price creates multiple swing highs around the same upper level. The pattern becomes visible when those highs form a recognizable boundary rather than isolated, unrelated wicks.
The term describes where price has repeatedly failed to move clearly beyond an upper area at the time those highs formed. It does not prove that the area is permanent resistance, and it does not prove that price must reverse from that level. It simply marks a repeated upper boundary that may matter when price returns to it.
How Equal Highs Form
Equal highs usually form after price creates a swing high, pulls away, and later returns to roughly the same upper area. If the second or later high also fails to establish clear acceptance above that area, the highs begin to define a visible upper boundary.
The structure is stronger when the highs are separated enough to show repeated behavior. Two candles with similar wicks inside the same small fluctuation may be too narrow to treat as meaningful equal highs. The pattern needs completed swing points, not only a pair of nearby intrabar spikes.
Once the boundary is visible, the area above it can attract attention because visible highs can become places where breakout interest or protective buy-stop activity may cluster. That possible order concentration is why equal highs are often discussed together with buy-side liquidity.
How to Identify Valid Equal Highs
A useful equal-highs reading starts with observable structure. The goal is not to find mathematically identical prices, but to decide whether the chart has created a clear upper reference area.
Equal Highs Classification Test
- There are at least two completed swing highs.
- The highs are clustered around a narrow upper price area.
- The highs are separated by enough price movement to show repeated structure.
- The upper boundary is visually clear without forcing the level.
- The market has not already accepted cleanly above the boundary.
- The structure remains readable after removing minor noise and isolated wicks.
The classification weakens when the highs are too far apart vertically, when the swing points are not clearly completed, or when the chart is too noisy to show a shared boundary. A forced level usually creates a weak reading.
Equal Highs and Buy-Side Liquidity
Equal highs can matter because the area above the visible boundary may hold potential buy-side liquidity. Market participants who focus on the same upper level may react above it through breakout orders, stop orders, or other order-flow behavior.
This does not mean price must move above the level. It also does not mean a move above the level is automatically a liquidity sweep, a bull trap, or a reversal. The liquidity reading is only a possibility created by visible structure and later market behavior.
A cleaner interpretation separates the structure from the event. Equal highs describe the repeated upper boundary. A later probe, sweep, failed breakout, or accepted break is separate behavior that needs its own evidence.
Acceptance, Rejection, and Failed Reads
Later behavior decides whether equal highs remain active as a useful reference. A brief move above the highs is not enough by itself. The market has to show whether the area above the boundary is being accepted or rejected.
| Later behavior | What it can mean | Reading status |
|---|---|---|
| Price trades above the highs and holds above the area | The old upper boundary may lose relevance as an active equal-highs area. | Reduced or invalidated |
| Price probes above the highs and returns below the boundary | The move may reflect failed acceptance above the visible highs. | Still relevant if structure remains clear |
| Price touches the area but remains noisy and unresolved | The structure may be too unclear to classify strongly. | Weak or unresolved |
Acceptance means price is able to stay above the prior boundary in a way that makes the old level less useful as resistance-like structure. Rejection means the move above the highs does not hold and price returns below the area. Neither reading comes from one wick alone.
Clean, Weak, and Invalid Equal Highs
Equal highs are not all equal in quality. Some structures are clean enough to use as a chart reference. Others are too noisy, too dispersed, or already invalidated by later acceptance above the boundary.
| Classification | What it looks like | Interpretation |
|---|---|---|
| Clean equal highs | Multiple completed highs form near the same upper area with a clear horizontal boundary. | The boundary can be used as a structural reference and possible buy-side liquidity area. |
| Weak equal highs | The highs are spread too widely, swing separation is unclear, or the chart is visually noisy. | The label may be forced, and later behavior should carry more weight than the boundary itself. |
| Invalid or no longer active | Price accepts above the prior upper boundary and the repeated-high structure loses visibility. | The old equal-highs area becomes historical context rather than an active structural boundary. |

Equal Highs Example in Context
A common scenario starts when price advances into a prior upper area and forms a clear swing high. After pulling back, price returns to nearly the same area and stalls again. The second high does not need to match the first high tick for tick; the key observation is that both highs define the same visible upper boundary.
The read becomes tempting because the area above the highs may contain buy-side liquidity. The read remains incomplete because the market has not yet shown whether that area will be accepted, rejected, or left unresolved.
If price later moves above the boundary and holds there, the earlier equal-highs structure may no longer be active. If price briefly moves above the boundary and then returns below it, the move may be read as failed acceptance above the visible highs. If price chops around the area without a clean decision, the classification stays weak.
Equal Highs vs Equal Lows and Nearby Liquidity Concepts
Equal highs are upper-boundary structures. equal lows are the lower-boundary counterpart, where repeated swing lows form around the same lower area.
| Concept | Main focus | Key distinction |
|---|---|---|
| Equal highs | Repeated upper swing highs | Marks a visible upper boundary and possible buy-side liquidity above it. |
| Equal lows | Repeated lower swing lows | Marks a visible lower boundary and possible sell-side liquidity below it. |
| Buy-side liquidity | Potential buy-side activity above highs | Describes the liquidity idea, not the equal-highs structure itself. |
| Liquidity grab | A move into visible liquidity that later fails to hold | Requires later behavior beyond the equal-highs label. |
| Liquidity sweep | A more specific taking of liquidity through a visible area | Needs evidence of the sweep behavior, not only repeated highs. |
| Bull trap | Failed upside breakout behavior | Depends on failed acceptance after an upside break, not just equal highs. |
Common Mistakes When Reading Equal Highs
| Mistake | Why it creates a weak reading | Cleaner interpretation |
|---|---|---|
| Treating equal highs as a reversal signal | The same structure can appear before a reversal, continuation, sweep, or accepted breakout. | Read the equal highs as a structural reference first, then wait for later behavior around the boundary. |
| Forcing exact price equality | Two highs do not need to match at the exact same price to create a useful upper boundary. | Focus on a visible cluster of completed swing highs around the same upper area. |
| Calling one wick a complete reading | One wick through the level does not prove acceptance, rejection, or a liquidity sweep. | Use the wick only as part of the sequence, not as the whole equal-highs interpretation. |
| Confusing structure with trade management | Equal highs do not provide entry, exit, stop, target, or risk rules by themselves. | Keep the label limited to chart structure and avoid turning it into a trade setup. |
When Equal Highs Stop Being Useful
Equal highs lose usefulness when the boundary is no longer visible, when price has clearly accepted above the area, or when the repeated highs are too noisy to separate from ordinary fluctuation.
The structure can also become stale after new price action changes the chart. Once the market establishes a new accepted range above the old highs, the earlier boundary may remain useful as historical context, but it should not be treated as an active equal-highs area without fresh evidence.
FAQ
What are equal highs in trading?
Equal highs are two or more completed swing highs that form near the same upper price area, creating a visible horizontal boundary on a trading chart.
Do equal highs need to be exactly the same price?
No. Equal highs do not need exact price equality. The important feature is a visible cluster of completed highs around the same upper boundary.
Are equal highs the same as resistance?
Equal highs can look similar to resistance because both involve an upper area where price has stalled. Equal highs are more specific because they describe repeated swing highs clustered near the same boundary.
Do equal highs always get swept?
No. Equal highs may attract attention as a potential buy-side liquidity area, but price does not have to sweep the highs. Later acceptance or rejection decides the cleaner reading.
What makes equal highs invalid?
Equal highs become invalid or less active when price accepts above the old boundary, when the highs are too dispersed, or when the structure is too noisy to define clearly.