A liquidity void is a fast price movement that leaves a visibly thin, low-overlap area in the chart structure. Instead of moving through a zone with repeated two-sided rotation, price travels through it quickly, leaving less internal trading structure than the areas before or after the move.
Definition: In trading, a liquidity void is an observable price-action structure where price moves through an area so quickly that the segment shows reduced overlap, sparse internal rotation, and limited back-and-forth activity. It is a structural reading, not a buy or sell signal by itself.
The label is strongest when the move follows a visible area of compression or prior structure, then creates a broad thin segment that remains meaningful when later price behavior is reviewed. A single large candle can be part of a liquidity void, but the candle alone does not prove the structure.
Key Points
- A liquidity void describes a low-overlap price segment created by fast directional movement.
- The structure is usually broader than one candle and should be judged against the surrounding chart context.
- A fair value gap is usually a more discrete candle-level imbalance, while a liquidity void is a broader structural area.
- Price may later revisit part or all of a liquidity void, but a fill is not guaranteed.
- A liquidity void should not be treated as proof of institutional intent, a trade setup, or a guaranteed reaction zone.
What Is a Liquidity Void?
A liquidity void is a chart area where price appears to have moved too quickly to build much internal structure. The move may show large bodies, limited overlap between candles, and fewer visible pauses than the surrounding price action.
The useful idea is not that the area contains “nothing.” The useful idea is that the price path through the area was thin compared with nearby structure. That makes the zone visually different from ordinary rotation, where price repeatedly overlaps, tests, and accepts within the same area.
Some traders use the term in ICT-style language, but the interpretation should remain observable: the chart either shows a fast traversal with reduced overlap and sparse internal rotation, or it does not. The structure matters more than the label.
Important limitation: A liquidity void does not automatically predict where price will go next. It can help describe how price moved through an area, but it does not provide entry, exit, stop-loss, target, or probability information on its own.
How a Liquidity Void Forms
A liquidity void usually begins with a visible reference area: compression, consolidation, a prior range, or a section where price has built enough structure for the next movement to stand out. The void reading starts when price leaves that area quickly and travels through the next segment with limited internal overlap.
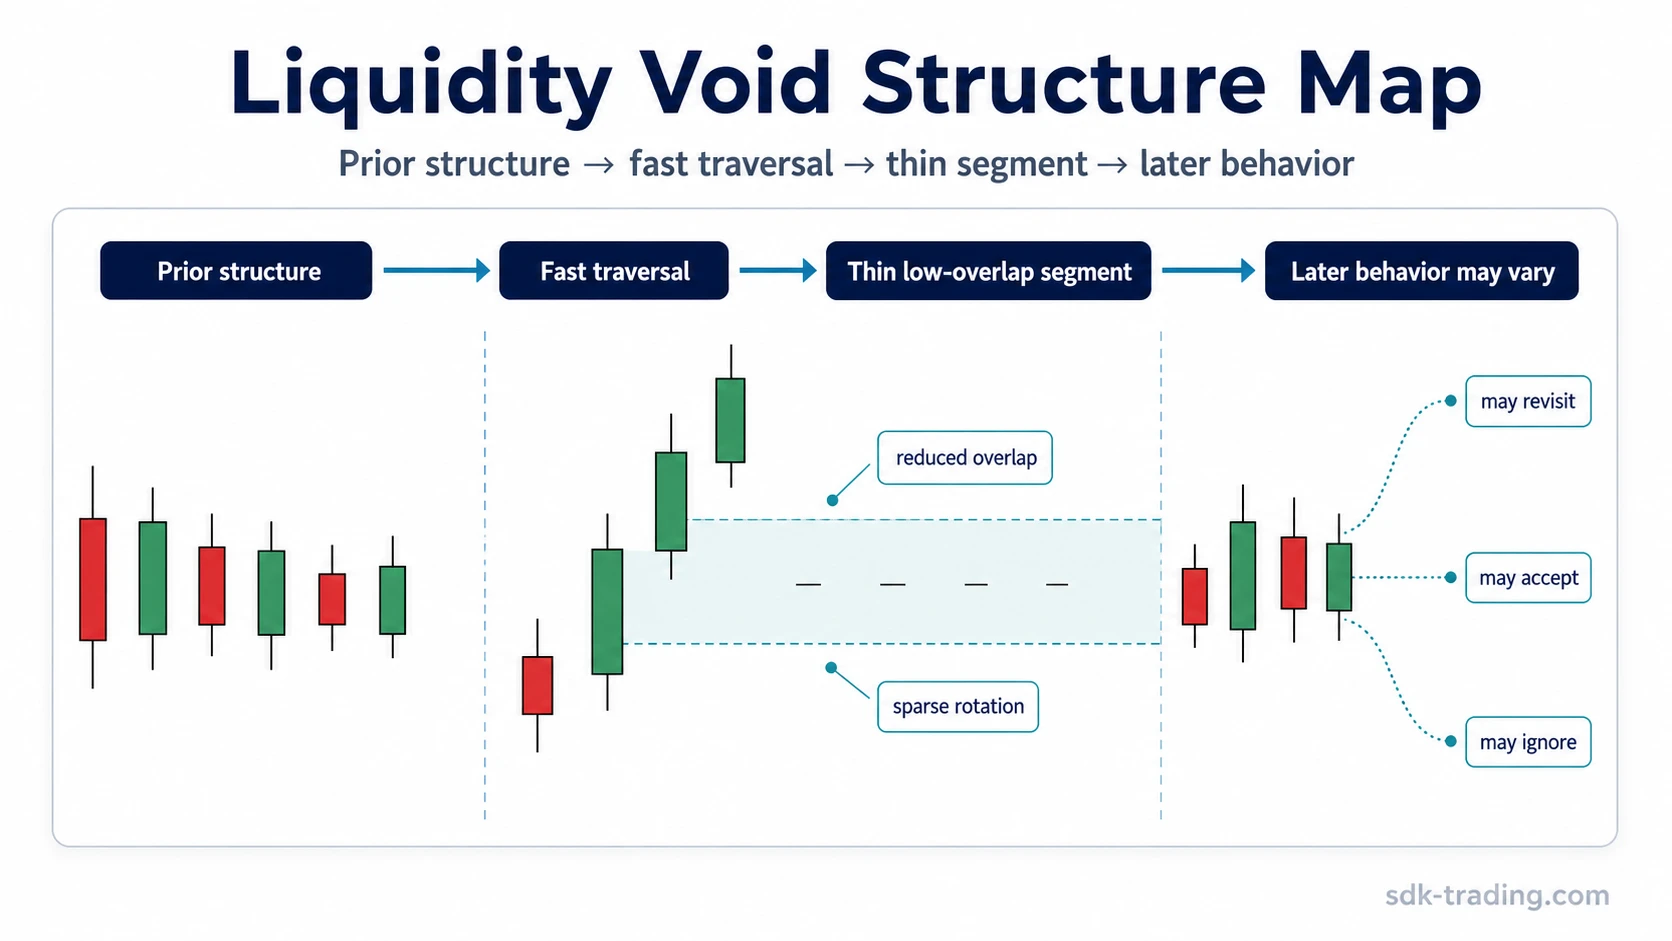
The sequence is usually easier to understand as structure rather than as a single candle event:
- Prior structure: Price first builds a visible area of overlap, compression, or reference.
- Fast displacement: Price then moves away from that area with speed and direction.
- Thin segment: The movement leaves a zone with reduced candle overlap and sparse internal rotation.
- Later behavior: Price may revisit, partially fill, ignore, or accept through the area later.
This is why a liquidity void is not the same as simply seeing a strong candle. A large candle shows speed. A liquidity void reading asks whether the broader segment also shows reduced internal trading structure compared with the chart around it.
Liquidity Void Anatomy: What to Look For
The strongest liquidity void readings come from several observable features appearing together. None of these features guarantees a later reaction, but they help separate a structural void from ordinary volatility.
| Observable feature | What it suggests | What weakens the reading |
|---|---|---|
| Prior compression or reference area | The fast move has a clear structural origin. | The move begins from random noise or unclear structure. |
| Fast directional movement | Price traversed the area quickly instead of rotating through it. | The movement is only normal volatility inside a broader range. |
| Reduced overlap | Candles do not build much shared structure inside the segment. | The area contains repeated overlap, pauses, and back-and-forth trading. |
| Broader-zone behavior | The void is visible as a segment, not just as one candle body. | The label depends entirely on one candle without surrounding context. |
| Later behavior around the area | Price later clarifies whether the zone remains meaningful, partially fills, or becomes accepted structure. | Price treats the area like ordinary continuation, ordinary breakout, or normal range movement. |
Reading principle: The label is stronger when structure supports it and weaker when the chart only shows speed. Candles help show the texture of the move, but the broader structure decides whether the move is better read as a liquidity void, ordinary volatility, or a breakout.
Liquidity Void vs Fair Value Gap
A liquidity void and a fair value gap are related imbalance concepts, but they should not be treated as identical. A fair value gap is usually a more specific candle-level imbalance. A liquidity void is usually a broader structural segment where price moved quickly with reduced internal overlap.
The confusion happens because both can appear during strong displacement. A fast move may contain a fair value gap inside a larger liquidity void, but the fair value gap is not automatically the whole void.
| Concept | Main focus | Typical scale | Common mistake |
|---|---|---|---|
| Liquidity void | A broader low-overlap segment created by fast price traversal. | Often a multi-candle or broader-zone structure. | Calling any large candle a liquidity void. |
| Fair value gap | A more discrete candle-level imbalance inside price delivery. | Usually more localized and candle-specific. | Treating every FVG as the entire liquidity void. |
| Displacement | The speed and direction of the move away from prior structure. | Can be a candle, sequence, or movement leg. | Assuming displacement alone proves a void. |
| Ordinary breakout | Price moving beyond a visible boundary or range. | Depends on the boundary and acceptance behavior. | Calling every breakout a liquidity void. |
| Thin liquidity | A broader condition where available trading depth may be limited. | Can describe market conditions, not only one chart segment. | Using thin liquidity and liquidity void as if they mean the same thing. |
Bullish and Bearish Liquidity Voids
Bullish and bearish liquidity voids are directional structure labels. They describe the direction of the fast traversal, not a guaranteed future move.
- Bullish liquidity void: Price moves upward through an area quickly, leaving a low-overlap segment below or within the path of the move.
- Bearish liquidity void: Price moves downward through an area quickly, leaving a low-overlap segment above or within the path of the move.
The labels can help describe chart structure, but they should not be converted into long or short instructions. A bullish void does not automatically mean price must keep rising, and a bearish void does not automatically mean price must keep falling.
Illustrative scenario: Price compresses for several candles, then moves upward through the next zone with large bodies and little overlap. Later, price returns into part of that thin segment and slows down. The structure can be described as a bullish liquidity void, but the later reaction still has to be judged by acceptance, rejection, and surrounding market structure rather than by the label alone.
Do Liquidity Voids Always Fill?
Liquidity voids do not always fill. Price may revisit the area later, fill part of it, move through it quickly, or never return within the relevant chart context. A fill is possible because thin areas can remain visually unfinished, but it is not a rule that price must obey.
The safer wording is that a liquidity void can become an area to watch for later behavior. If price returns, the important question is whether it accepts inside the area, rejects from it, partially fills it, or treats it as ordinary structure.
Fill limitation: Avoid deterministic language such as “the void must rebalance” or “price always returns.” A liquidity void describes how price moved through an area. It does not create a fixed timeframe, guaranteed fill, or required reaction.
Clean, Weak, and Invalid Liquidity Void Readings
A liquidity void reading becomes more useful when it can be classified by quality. The goal is not to force every fast move into the same label. The goal is to decide whether the structure remains a reasonable description after surrounding and later behavior are considered.
| Reading quality | Typical structure | Safer interpretation |
|---|---|---|
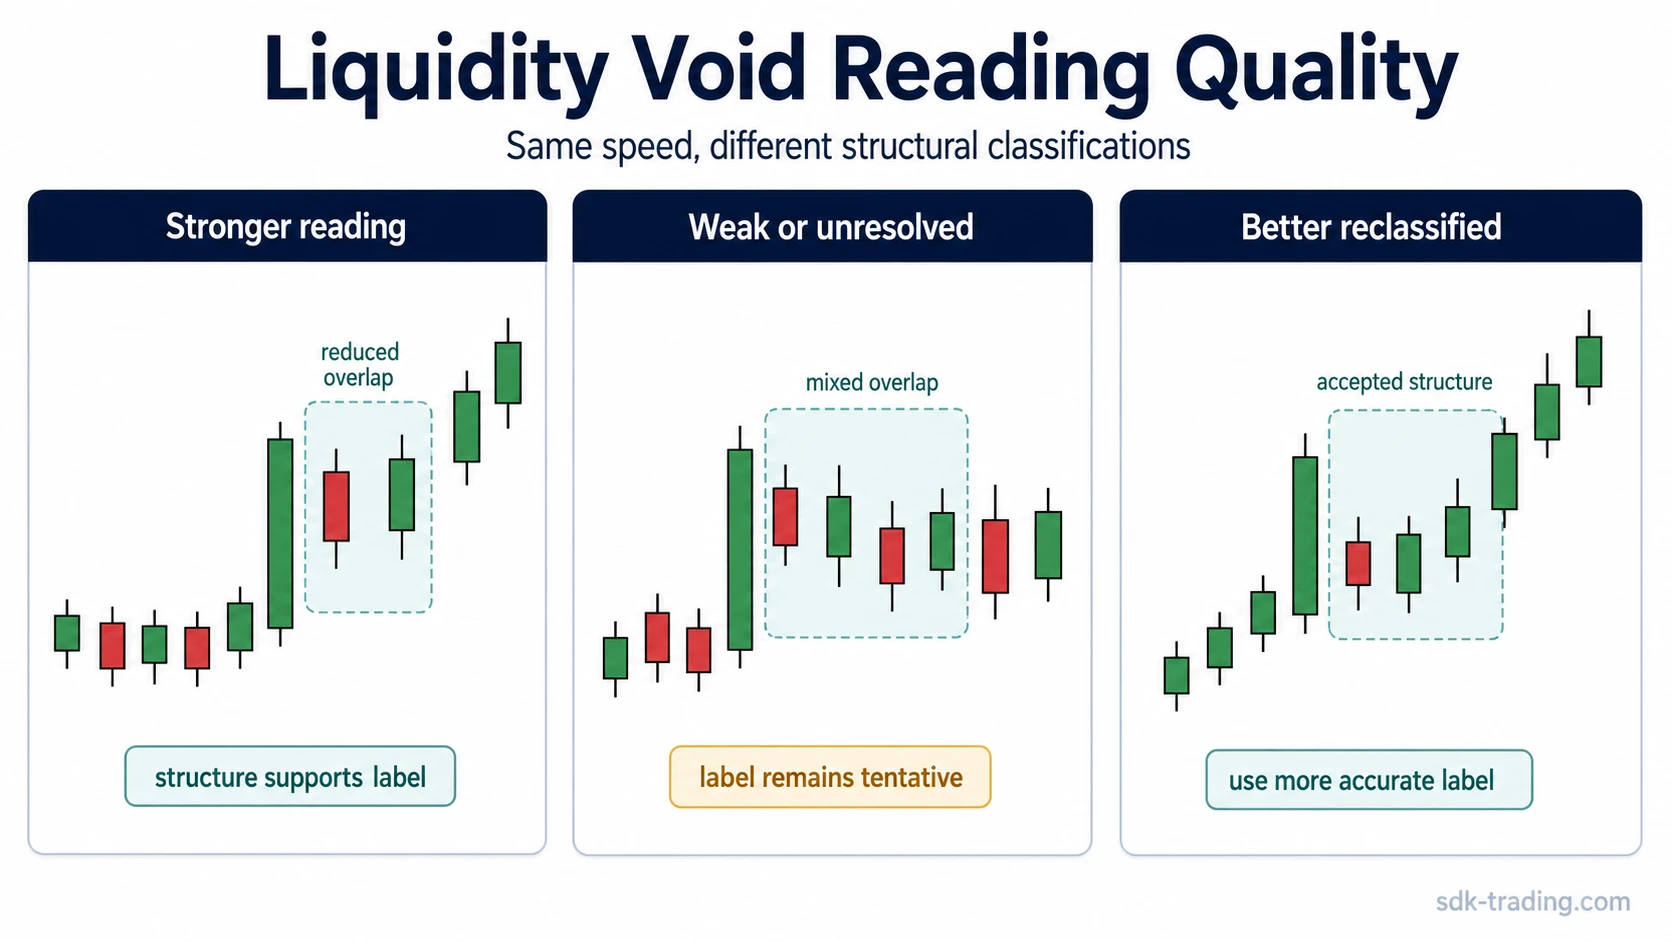
| Clean liquidity void reading | Clear prior structure, strong displacement, reduced overlap, sparse internal rotation, and later behavior that keeps the thin segment relevant. | The void label is structurally supported, while still not acting as a standalone signal. |
| Weak or unresolved reading | Unclear origin, mixed overlap, ordinary volatility, or later behavior that does not clarify whether the area matters. | The label should remain tentative. The chart may simply be showing a fast move without a strong void structure. |
| Invalid or better reclassified reading | Price accepts through the area, the supposed void behaves like ordinary continuation, or the move is better described as a breakout, gap, or volatility expansion. | The liquidity void label should be reduced, removed, or replaced with a more accurate structure label. |
This quality model also helps prevent hindsight labeling. A move can look obvious after the chart has already developed, but the real-time reading is weaker when the origin, overlap, and later behavior were unclear.
Common Misreadings
The most common mistakes come from treating the label as stronger than the chart evidence. A liquidity void is a useful structural concept only when the surrounding price action supports the reading.
| Misreading | Why it is risky | Safer reading |
|---|---|---|
| Calling any large candle a liquidity void | A large candle may show speed but not necessarily a broader low-overlap segment. | Check the surrounding structure, overlap, and later behavior. |
| Treating the void as a guaranteed reaction zone | Price can fill, partially fill, accept through, or ignore the area. | Use the void as a structural reference, not a prediction. |
| Confusing liquidity void with fair value gap | An FVG can be more localized than the broader void structure. | Separate the candle-level imbalance from the broader price segment. |
| Assuming the void proves institutional activity | Intent is not directly observable from a chart segment alone. | Describe only what the chart shows: speed, overlap, rotation, and acceptance behavior. |
| Using hindsight to label every fast move | After the move develops, structure can look cleaner than it was in real time. | Classify the reading as clean, weak, or invalid based on observable evidence. |
Related Concepts
A liquidity void sits near several other liquidity and price-action concepts, but each one has a different job.
- Fair value gap: A more discrete imbalance concept that often appears inside strong displacement.
- Displacement: The forceful movement that may create or contribute to a void, but does not prove one by itself.
- Liquidity sweep: A boundary test where later behavior helps classify whether the break was accepted, rejected, or unresolved.
- Liquidity grab: A short-lived probe through a visible liquidity area or boundary.
- Buy-side liquidity: Liquidity commonly referenced above visible highs or upper-side price areas.
- Thin liquidity: A broader liquidity condition that can affect how easily price moves through an area.
If the main question is whether a visible boundary was tested and then rejected or accepted, the better next concept is usually liquidity sweep or liquidity grab. If the main question is why a fast segment looks underdeveloped internally, the liquidity void label is more relevant.
FAQ
Is a liquidity void the same as a fair value gap?
No. A fair value gap is usually a more discrete candle-level imbalance, while a liquidity void is usually a broader low-overlap price segment created by fast movement. A fair value gap can appear inside a liquidity void, but the two labels are not identical.
Do liquidity voids always fill?
No. Price may revisit part or all of a liquidity void, but a fill is not guaranteed. The later behavior may be a partial fill, full fill, acceptance through the area, rejection from the area, or no meaningful return within the relevant chart context.
Is every large candle a liquidity void?
No. A large candle shows speed, but a liquidity void reading needs broader structural support, such as reduced overlap, sparse internal rotation, and a visible relationship to surrounding price structure.
Is a liquidity void a trading signal?
No. A liquidity void is a structural observation. It can describe how price moved through an area, but it does not provide entry, exit, stop-loss, target, probability, or trade direction by itself.
How to Treat a Liquidity Void Reading
A liquidity void is best treated as a structural description of fast price movement through a low-overlap area. The reading becomes stronger when the chart shows clear prior structure, decisive displacement, sparse internal rotation, and later behavior that keeps the area relevant.
The safest interpretation is also the simplest: a liquidity void can help describe price texture, but it does not prove intent, guarantee a fill, or replace broader structure analysis. When the evidence is mixed, the label should stay weak or be reclassified into a more accurate concept.