Resistance in technical analysis is an upper price area where upward movement has previously slowed, paused, or failed to continue. It can be drawn as a level for simplicity, but it often behaves more like a zone because reactions rarely happen at one exact price.
Resistance describes observable chart behavior. It does not prove that price must reverse, that sellers will appear again, or that a trade setup exists. A resistance reading becomes more useful when the same upper area attracts repeated hesitation, failed continuation, or visible rejection while the surrounding market structure still makes that area relevant.
Key Points About Resistance
- Resistance is an upper reaction area, not a guaranteed barrier.
- A resistance level is a simplified marker; a resistance zone allows for the real range of reactions around that area.
- Clean resistance usually has repeated interaction, visible hesitation, and current structural relevance.
- A weak resistance reading often comes from one arbitrary line, messy reactions, or conflicting timeframe context.
- Resistance becomes outdated when price accepts above the area and later behavior no longer respects it.
What Resistance Means in Technical Analysis
Resistance means that price has reached an upper area where continuation became difficult in the past. The difficulty may appear as a stall near a prior high, repeated upper wicks, failed closes above an area, slower upward progress, or a visible shift from strong demand to hesitation.
The most useful definition is behavioral: resistance marks an area where the chart has already shown a reaction. The interpretation may involve selling pressure, reduced buying interest, profit-taking, order concentration, or short-term exhaustion, but those explanations require evidence. The resistance itself is the observed reaction area.
Simple Definition: Resistance is a price area above the current or recent market where upward movement has previously struggled, stalled, or failed to continue.
This makes resistance different from a prediction. A chart can approach a resistance area and still continue higher if demand remains strong enough, if sellers fail to create a reaction, or if price accepts above the prior upper area.
How Resistance Forms on a Price Chart
Resistance usually forms when price reacts near the same upper area more than once. The area can appear after a prior swing high, the upper boundary of a range, a failed breakout attempt, a trendline interaction, a moving-average reaction, or a round number that attracts visible hesitation.
A single reaction can identify a possible area to watch, but the reading becomes cleaner when later price behavior shows that the area still matters. Repeated reactions, clustered hesitation, and failed continuation near the same upper region create a stronger chart-based reason to mark it.
| Formation clue | What it suggests | What it does not prove |
|---|---|---|
| Prior swing high | Price previously failed or paused near an upper area. | That the same area must reject price again. |
| Repeated upper reactions | Multiple attempts have struggled near similar prices. | That sellers control the whole market structure. |
| Range upper boundary | Price has been rotating below a recurring upper limit. | That the range cannot expand or break. |
| Trendline or moving-average reaction | A dynamic reference area may be affecting behavior. | That the line itself has predictive power. |
| Failed continuation above an area | Price could not maintain acceptance above the prior reaction zone. | That every break above resistance is false. |
Resistance Level vs Resistance Zone
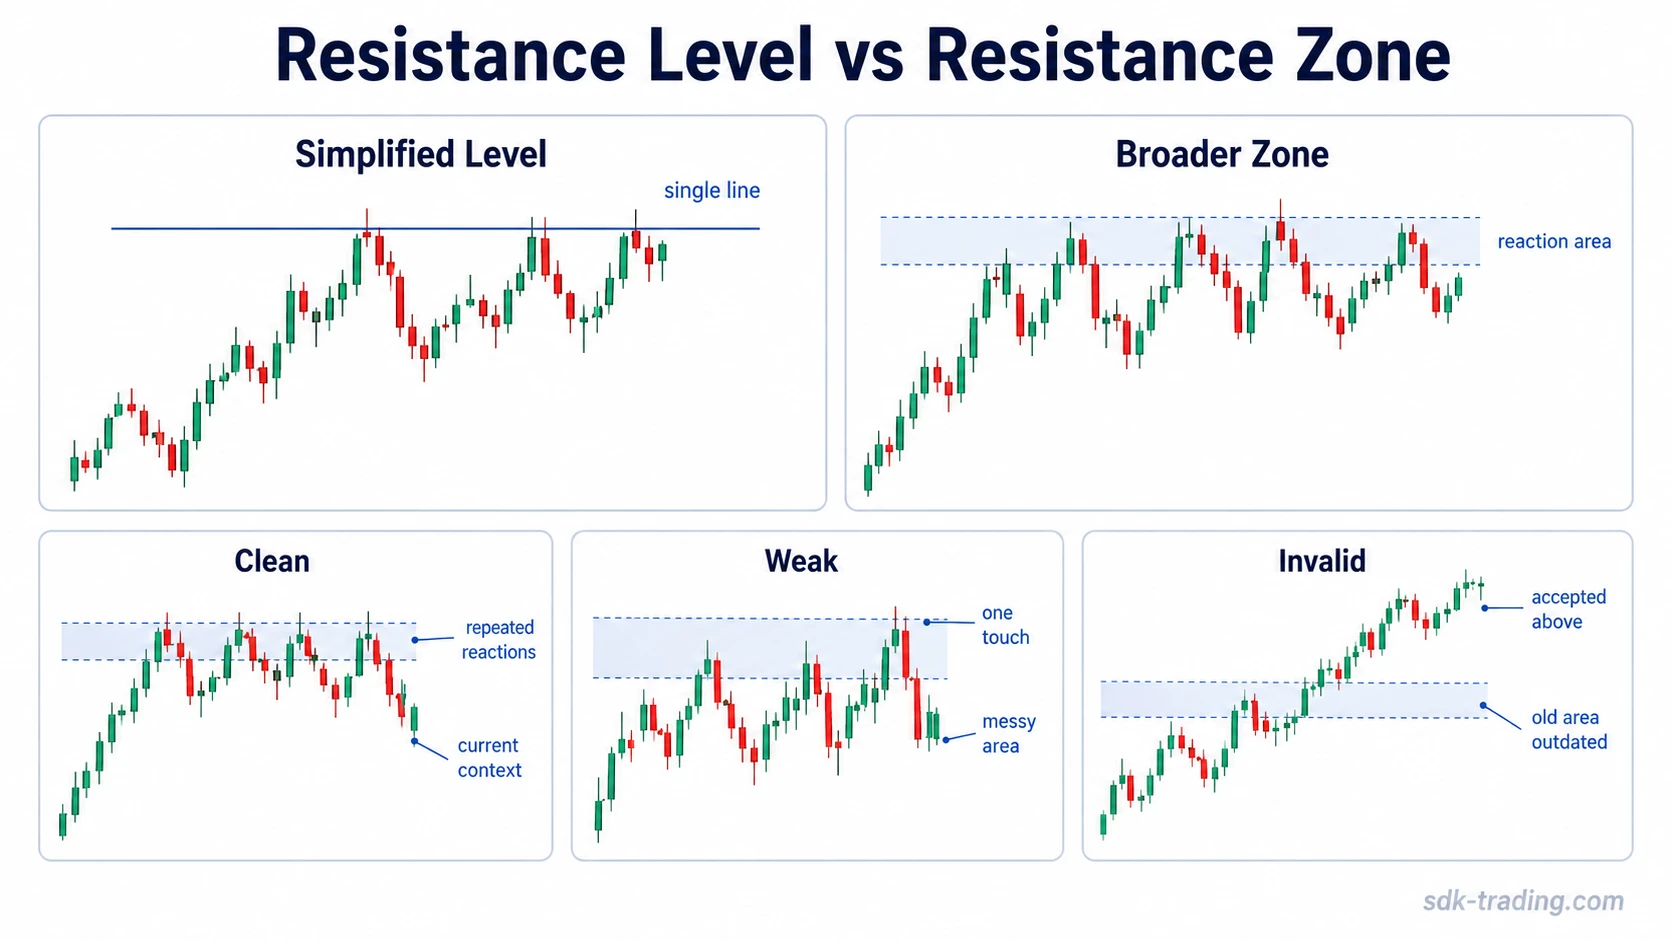
A resistance level is a single price marker used to simplify an upper reaction area. A resistance zone is a broader band that includes the actual range where reactions have clustered. The zone approach is often safer because market reactions are rarely exact.
Overprecision creates false confidence. If several reactions happen around the same upper region, forcing one perfect line through every wick or close can hide the real behavior. A zone allows the analyst to see whether price is reacting around an area, accepting above it, or moving through it without meaningful hesitation.
| Type | Best use | Main limitation |
|---|---|---|
| Resistance level | Quickly marking a visible prior high or simple chart reference. | Can imply false precision if price reactions are spread across a range. |
| Resistance zone | Capturing clustered reactions, wicks, closes, and failed continuation attempts. | Can become too wide if every nearby reaction is included without discipline. |
A practical approach is to start with the most obvious reaction area, then check whether later behavior respects the same region. If the area becomes too wide to make interpretation useful, the chart may be too messy for a clean resistance reading.
How to Identify Resistance Without Overreading It
Resistance identification starts with observable behavior, not with a fixed number of touches. Two touches can be useful, but they do not automatically make an area important. One clear reaction at a major prior high can matter more than several minor reactions inside noisy price movement.
The stronger test is whether the area changes behavior. Price may slow as it approaches the area, reject from it, fail to close above it, compress below it, or break through and then show whether the break is accepted. Each behavior gives different information. None of them is enough by itself to create a complete trading decision.
Identification Checklist:
- Is the area tied to a visible prior high, range boundary, or repeated upper reaction?
- Have reactions clustered near the same region rather than one isolated point?
- Does the current timeframe still make the area relevant?
- Is price hesitating, rejecting, compressing, or accepting near the area?
- Has market structure changed enough to make the old resistance less useful?
Resistance vs Supply and Demand
Resistance and supply and demand are related, but they are not the same concept. Resistance describes an observed chart area where upward continuation has struggled. Supply and demand analysis tries to explain the pressure or imbalance that may sit behind that behavior.
This distinction matters because a resistance area does not automatically prove that strong supply is present. Price can hesitate near a prior high because buyers slow down, because short-term participants take profit, because liquidity is thin, or because sellers become more active. The chart may show resistance before the reason is clear.
A stronger imbalance claim needs more than a line on the chart. It needs evidence that pressure changed meaningfully around the area, such as displacement, absorption, failed acceptance, or later reaction that confirms the area still matters.
Resistance vs Support
Resistance is an upper reaction area. Support is a lower reaction area. They are often studied together because both describe areas where price behavior has changed in the past, but they answer opposite chart-reading questions.
| Concept | Chart location | Basic reading |
|---|---|---|
| Resistance | Above or near the upper side of recent price movement. | Upward continuation has previously struggled near this area. |
| Support | Below or near the lower side of recent price movement. | Downward continuation has previously struggled near this area. |
The pair can help frame a range, but resistance should still be interpreted on its own evidence. A clear resistance area does not automatically mean the lower side of the range is equally useful, equally clean, or equally current.
Clean, Weak, and Invalid Resistance Readings
The main risk with resistance is treating every upper line as meaningful. A better approach is to separate clean, weak, and invalid readings before attaching too much weight to the area.
| Reading | Typical evidence | Interpretation boundary |
|---|---|---|
| Clean resistance | Repeated reaction near the same upper area, visible hesitation, failed continuation, and relevant timeframe context. | The area is worth monitoring as an active reaction zone, but it is still not a reversal guarantee. |
| Weak resistance | One arbitrary touch, messy structure, reactions spread too widely, or conflicting evidence from a higher timeframe. | The area may exist visually, but the reading is not strong enough to carry much weight by itself. |
| Invalid or outdated resistance | Price accepts above the area, later reactions no longer respect it, or structure changes enough to make the old level irrelevant. | The old resistance should not be treated as active without fresh evidence. |
Clean resistance only means the chart has produced enough visible behavior to make the area worth considering in context.
When a Resistance Reading Becomes Weak or Invalid
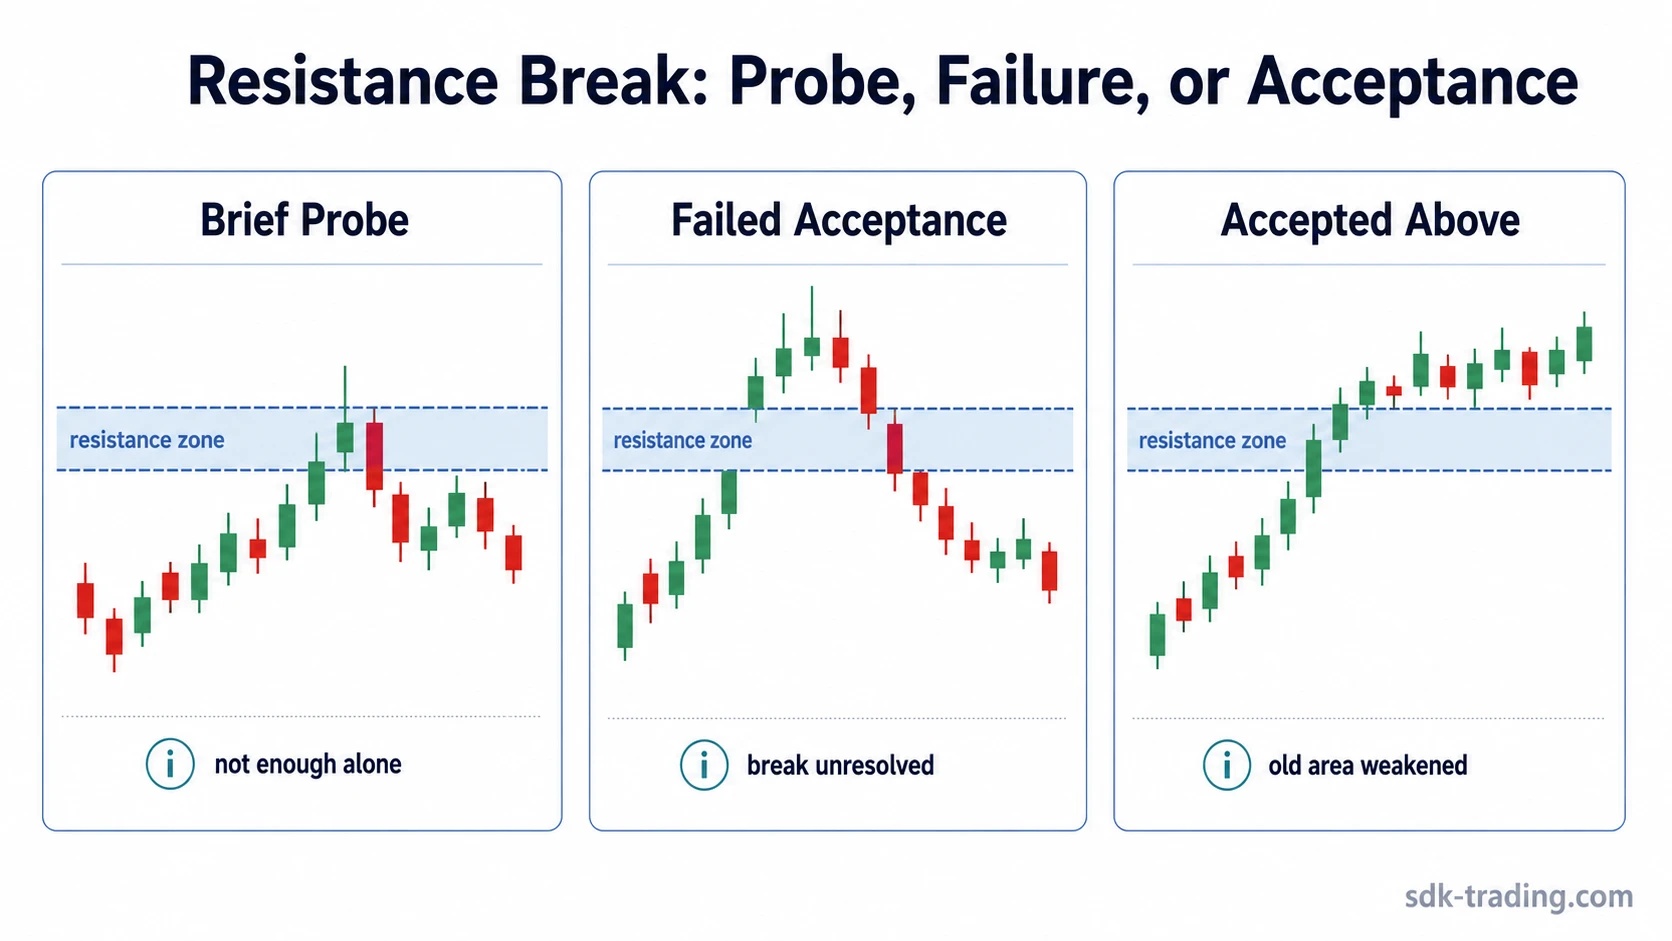
A resistance reading weakens when the area stops producing meaningful reaction. This can happen through repeated acceptance above the zone, shallow reactions that no longer slow price, or a broader market structure change that makes the old upper area less relevant.
An accepted break is different from a brief probe. A wick above resistance may show a test, but it does not automatically prove that the area has failed. A stronger break reading usually requires price to spend time above the area, close above it with acceptance, or later interact with it without returning to the prior behavior.
Common Mistakes:
- Treating one touch as a confirmed resistance area.
- Drawing a single exact line through reactions that actually form a zone.
- Assuming resistance means reversal rather than possible hesitation.
- Calling every break above resistance a false breakout before later behavior confirms or rejects acceptance.
- Keeping an old resistance area active after price structure has clearly changed.
Role Reversal After Resistance Breaks
A former resistance area can later act as possible support, but only after the market shows acceptance above it and later interaction near the same area. The old upper reaction zone does not automatically change roles the moment price moves above it.
The useful question is whether price treats the former resistance differently after the break. If price accepts above the area, returns toward it, and no longer reacts as if the old upper boundary is active resistance, the role-reversal idea becomes more defensible. If price quickly falls back below the area, the break remains unresolved or failed.
Role reversal is therefore a behavior sequence, not a label. The sequence needs acceptance, later interaction, and updated context.
Resistance, Reversal, and Control Shifts
Resistance can appear before a reversal, but it is not the same as a reversal. A reaction near resistance only shows that upward movement has met difficulty around an upper area. A stronger reversal reading needs more evidence that control has shifted, not just that price touched resistance.
A key reversal reading focuses on a more specific possible control shift. Resistance can be part of that context, but the presence of resistance alone does not create the reversal reading. The chart still needs later behavior that shows whether buyers lost control, sellers gained control, or the market simply paused before continuing.
Practical Scenario
Imagine price has advanced toward the same upper area three times. On the first attempt, it pauses and pulls back. On the second attempt, it briefly trades above the area but cannot hold there. On the third attempt, movement slows again and candles cluster near the same region.
That behavior can support a resistance reading because the market has repeatedly struggled near the same upper area. The reading is still descriptive. If price later accepts above the zone and begins holding above it, the old resistance reading weakens. If price continues to fail near the area, the resistance zone remains relevant until new behavior changes the evidence.
Where Resistance Fits in a Broader Process
Resistance is useful as a chart-reading reference, but it is not a complete process by itself. A full interpretation also needs market context, timeframe alignment, evidence around acceptance or failure, and a clear boundary between observation and action.
A support and resistance trading strategy requires separate rules for context, confirmation, risk boundaries, invalidation, and review. Resistance only identifies a possible upper reaction area. It does not define those later decisions on its own.
The safest use of resistance is to treat it as a diagnostic area: a place where later price behavior can provide more evidence, not a place where the chart has already delivered a final answer.
FAQ
What does resistance mean in technical analysis?
Resistance means an upper price area where upward movement has previously slowed, paused, or failed to continue. It describes observed chart behavior, not a guarantee that price will reverse again.
Is resistance a level or a zone?
Resistance can be drawn as a level for simplicity, but it often behaves more like a zone. A zone captures the range where reactions, hesitation, failed continuation, or rejection have clustered.
Can resistance break?
Resistance can break when price accepts above the prior upper reaction area. A brief move above the area is not always enough; later behavior helps show whether the break was accepted or failed.
Does resistance prove that sellers are in control?
No. Resistance can suggest selling pressure, reduced buying interest, or hesitation near an upper area, but it does not prove control by itself. Stronger interpretation requires later evidence from price behavior.