Multi timeframe analysis compares more than one chart scale so price action can be read with context instead of isolated movement. A higher timeframe can define the structural question, while a lower timeframe can add detail about how price is behaving inside that context.
The method does not make a market outcome certain. It becomes useful only when each timeframe has a defined job. A higher chart is not automatically more true, and a lower chart is not automatically more precise. Alignment across charts can help organize interpretation, but alignment alone is not proof.
Key Points
- Multi timeframe analysis separates broader context from shorter-term detail.
- A timeframe is useful only when it answers a specific structural question.
- Higher timeframe context can frame a price area, but it does not confirm a trade.
- Lower timeframe movement can add evidence, or it can add noise.
- Timeframe conflict is normal because different chart scales answer different questions.
What Multi Timeframe Analysis Means
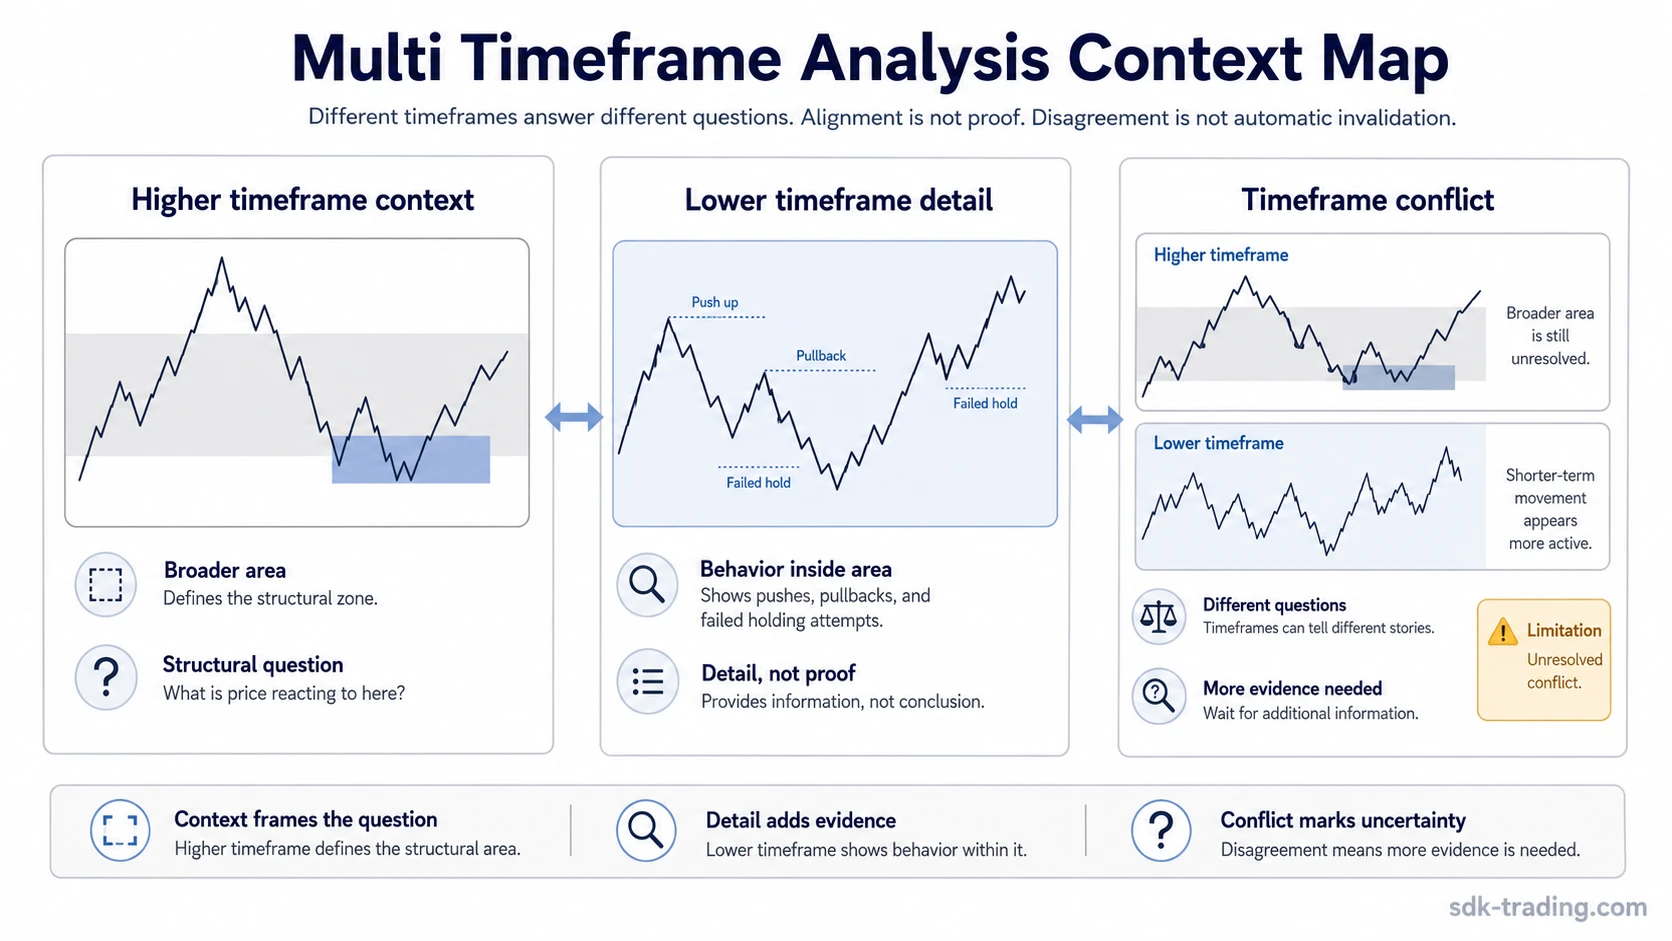
Multi timeframe analysis means reading the same market through different chart scales. The broader chart can show where price is in a larger structure. The shorter chart can show how price is behaving inside that structure.
The useful distinction is context versus detail. A weekly or daily chart may show a wider reaction area, a prior range, or the broader direction of structure. An intraday chart may show smaller swings, failed pushes, compressed movement, or repeated reactions inside that same area.
The same movement can therefore carry different meaning on different scales. A small break that looks important on a lower chart may be only noise inside a wider range. A minor pause on a higher chart may contain many lower-timeframe swings that feel more active than the broader structure really is.
Why Timeframe Selection Can Become Arbitrary
Timeframe selection becomes arbitrary when charts are added only to support an existing view. A trader can usually find one chart that looks bullish, another that looks bearish, and another that looks neutral. Without a structural question, the selected timeframe can become a confirmation tool for conviction rather than a filter for evidence.
A cleaner reading starts with the question: is the broader market testing a prior reaction area, is a lower move only noise inside a range, or is price accepting, rejecting, or failing to reclaim an area? The chosen timeframe should help answer that question, not replace it.
Bottom-up analysis can create a common bias. A lower timeframe move may look clear because it contains more candles and more apparent detail. That detail becomes useful only after the broader context is defined. Without that context, short-term movement can look more meaningful than it is.
Higher Timeframe Context vs Lower Timeframe Detail
A higher timeframe often works as an envelope for interpretation. It can show where the current movement sits relative to a larger range, trend, prior reaction area, or structural boundary. A lower timeframe often works as texture. It can show whether price is reacting smoothly, compressing, failing to follow through, or producing conflicting smaller swings.
| Chart scale | Useful role | Weak use | Safer interpretation |
|---|---|---|---|
| Higher timeframe | Defines the wider context, area, or structural question. | Treating the larger chart as automatically more reliable. | Use it to frame the question, not to prove the answer. |
| Lower timeframe | Adds detail about behavior inside the broader context. | Treating smaller movement as precision or confirmation by itself. | Use it only when it adds observable evidence to the wider structure. |
| Multiple timeframes | Separate context, detail, and conflict. | Adding more charts until one supports the preferred view. | Stop when another timeframe no longer changes the interpretation. |
A resistance area can define the wider zone where lower-timeframe movement should be interpreted more carefully. The lower chart does not prove rejection by itself, but it can show whether price is repeatedly failing to hold above the area.
What Evidence Makes a Timeframe Relevant
A timeframe becomes relevant when it adds evidence to the structural question. It becomes weak when it only adds visual complexity. The useful test is not whether the chart looks clean. The useful test is whether the chart changes the interpretation in a specific way.
| Reading claim | Evidence that supports it | Not enough evidence | Safer interpretation |
|---|---|---|---|
| The higher timeframe matters. | It defines a visible range, prior reaction area, trend boundary, or structural level. | It is simply the larger chart. | The higher timeframe frames context only when it identifies the active structural question. |
| The lower timeframe adds useful detail. | It shows acceptance, rejection, failed acceptance, compression, or inability to reclaim an area. | It has more candles and appears more precise. | Lower-timeframe detail matters only if it clarifies behavior inside the wider context. |
| The timeframes align. | Different scales point to the same area, behavior, or structural pressure. | Both charts appear to move in the same direction for a short period. | Alignment can support interpretation, but it does not remove uncertainty. |
| The timeframes disagree. | One scale shows a broader structure while another shows shorter-term reaction or noise. | Calling one chart wrong because another chart looks cleaner. | Conflict can show that different questions are being answered at different scales. |
A support area can create a similar context on the downside. Lower-timeframe detail becomes more useful when it shows whether price is being accepted above the area, rejected from it, or moving through it without meaningful response.
When Timeframes Disagree
Timeframe disagreement is not automatically a problem. A higher chart and a lower chart may disagree because they are measuring different parts of the same structure. The higher timeframe may still show a broad range, while the lower timeframe shows a sharp move inside that range.
The error is treating conflict as a reason to force one chart to dominate the other. A broader chart can define the area, while a shorter chart can show the quality of reaction inside that area. If the lower chart shows movement that does not change the broader structure, the disagreement may be noise rather than a new read.
Conflict becomes more useful when it identifies the exact uncertainty. Price may be near a wider reaction area, but lower-timeframe behavior may still be unresolved. In that case, the useful conclusion is not certainty. The useful conclusion is that the structure has not provided enough evidence for a stronger interpretation.
Common Multi-Timeframe Analysis Mistakes
One common mistake is starting with the lower timeframe and then searching for a higher timeframe that agrees. This reverses the order of evidence. Lower-timeframe detail is easier to overread when the broader structural question has not been defined first.
Another mistake is forcing alignment. If every timeframe must agree before the interpretation is accepted, normal market noise can look like failure. If one timeframe is enough to override all others, the process can become selective. The better question is whether each chart scale adds a different piece of useful evidence.
Too many timeframes can also reduce clarity. Adding more charts can create more labels, more conflict, and more room for cherry-picking. A small set of chart scales is usually easier to interpret than a stack of charts with no assigned role.
Lower-timeframe precision is another weak assumption. A smaller chart can make price behavior look more exact, but more candles do not mean more reliability. Precision is useful only when it clarifies acceptance, rejection, compression, or failed follow-through inside the broader context.
Example: The Same Area Across Different Chart Scales
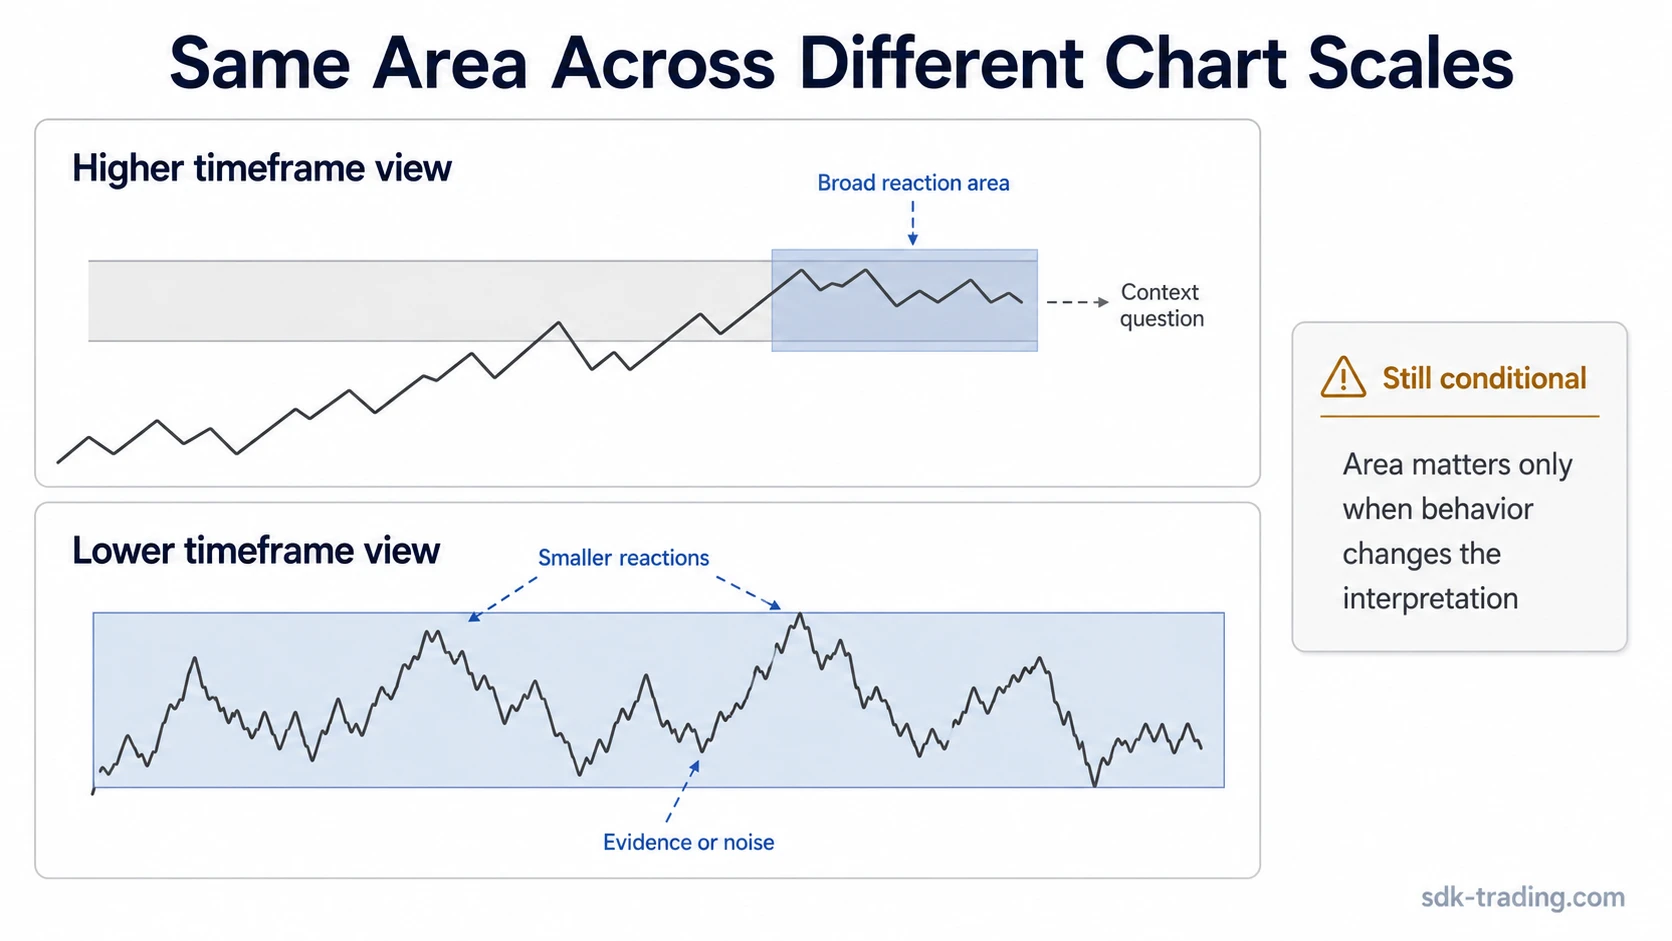
Consider a market approaching a higher-timeframe reaction area after several attempts to push through the same zone. On the higher chart, the area may be visible as a broad region where price has previously stalled. On a lower chart, the same area may contain several smaller pushes, pullbacks, and short-lived breaks.
The lower chart does not prove a reversal just because price reacts inside the zone. It adds useful information only if the movement shows something observable: repeated failure to hold above the area, a failed reclaim, slowing expansion, or a clear inability to maintain acceptance beyond the zone.
A possible key reversal area becomes more meaningful when the higher timeframe defines why the area matters and the lower timeframe shows how price is behaving there. The label remains conditional if the lower chart only shows noise, isolated candles, or one brief reaction.
The same logic works in the other direction. A lower-timeframe reaction may look strong, but the higher timeframe may still show price inside a broader range. In that case, the smaller move may be a local response rather than a structural shift.
Limits of Multi-Timeframe Analysis
Multi timeframe analysis is a context tool. It does not predict price movement, create certainty, or confirm a trade by itself. It only helps separate broader structure from shorter-term behavior.
The method also cannot solve unclear evidence. If the higher timeframe does not define a meaningful area and the lower timeframe only adds scattered movement, adding more chart scales usually creates more confusion. The absence of a clear structural question is itself useful information.
Timeframe alignment can strengthen a reading only when the evidence is observable. The stronger version is not “several charts agree.” The stronger version is that each selected chart contributes a distinct role: one frames the context, one clarifies the behavior, and none are being used only to justify a preferred view.
FAQ
Is multi-timeframe analysis always top-down?
Multi-timeframe analysis is usually cleaner when the broader context is defined first, but the main requirement is not a fixed order. The selected timeframe must answer a structural question instead of being chosen after the conclusion is already preferred.
What if higher and lower timeframes disagree?
Disagreement is normal because different chart scales answer different questions. A higher timeframe may define the broader area, while a lower timeframe may show unresolved movement inside that area. Conflict is not automatic invalidation.
How many timeframes are enough?
The number is enough when each selected chart has a clear role. Adding another timeframe is weak if it does not change the structural question, clarify behavior, or reduce uncertainty.
Can multi-timeframe analysis confirm a trade by itself?
No. Multi-timeframe analysis can organize context and evidence, but it does not confirm a trade, predict an outcome, or replace invalidation and risk boundaries.