Support vs supply and demand separates two chart-reading lenses: support marks an area where price has reacted before, while supply and demand focuses on broader zones where buying or selling imbalance may have started a strong move.
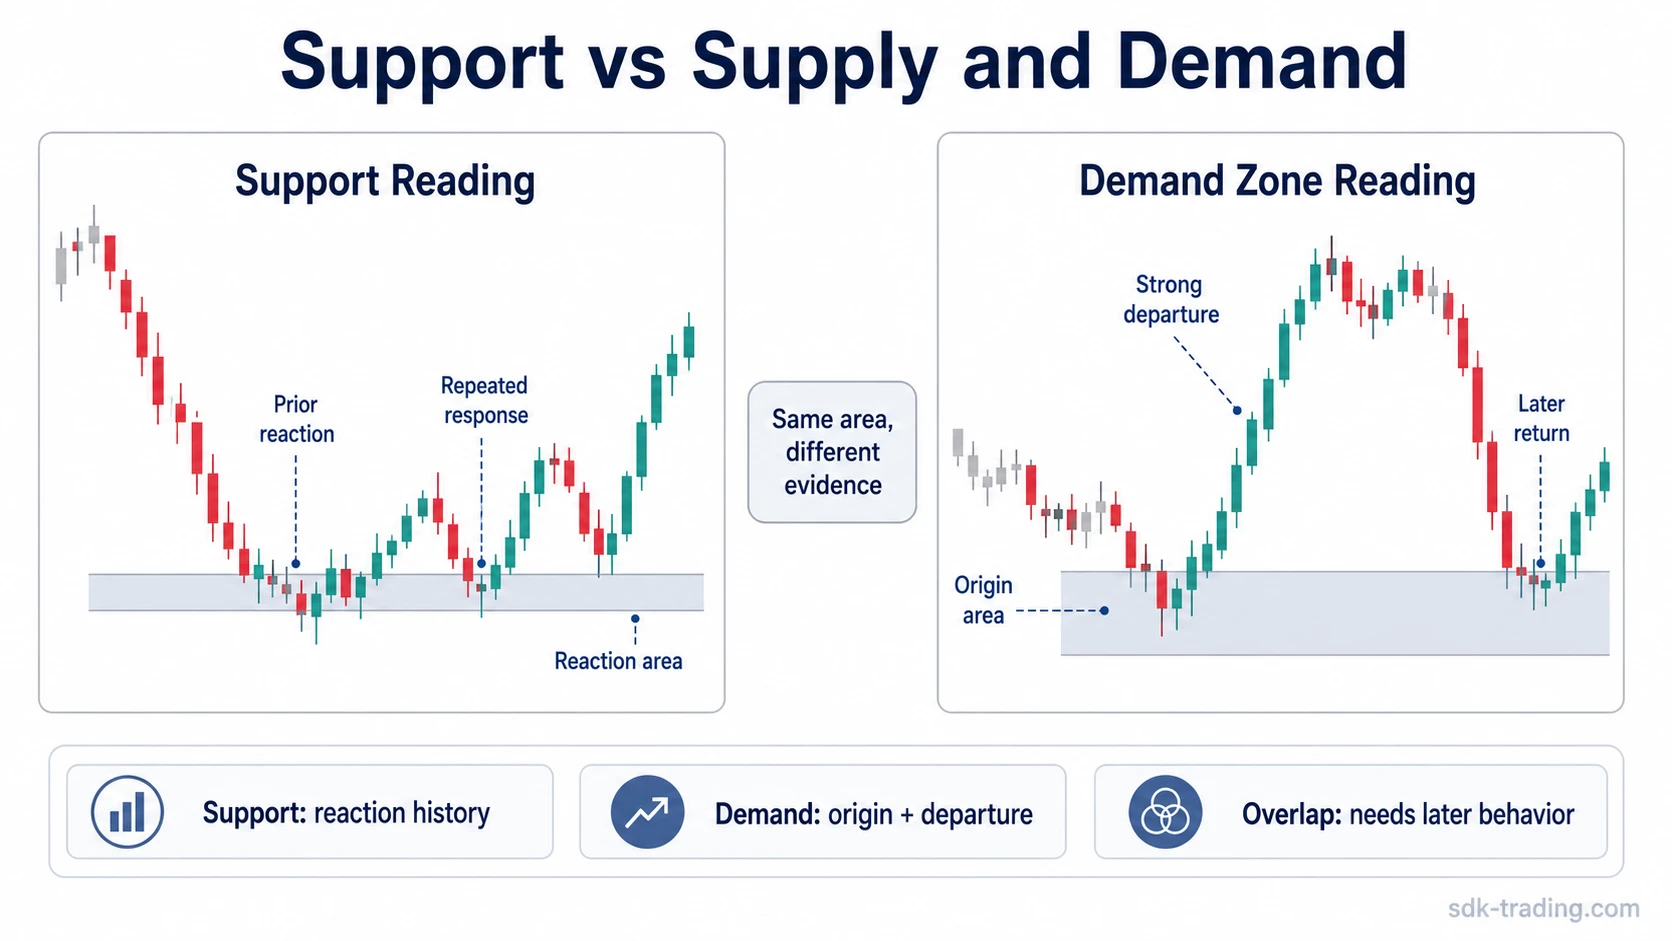
The two readings can appear around the same price area, but they ask different diagnostic questions. A support reading asks whether price is still responding near a prior reaction area. A supply and demand reading asks whether the area is tied to an earlier imbalance, how price left that zone, and whether later behavior still respects it.
That difference matters because a level can look useful under one lens and incomplete under another. A lower area may act like support after repeated reactions, while a demand-zone reading needs evidence that the earlier upward move began from a meaningful imbalance area.
Key Points
- Support is a reaction-area reading based on where price has responded before.
- Supply and demand is an imbalance-zone reading based on where buying or selling pressure may have started a strong move.
- The same chart area can support both readings, but the evidence for each one is different.
- Later behavior around the area determines whether either reading remains useful, weakens, or becomes outdated.
Support vs Supply and Demand: The Core Difference
Support is mainly a reaction-area concept. It looks at where price previously stopped falling, hesitated, or turned upward. The useful evidence is repeated behavior around the area, not a guarantee that the area will hold again.
Supply and demand is mainly an imbalance-zone concept. It looks for areas where buying pressure or selling pressure appeared strong enough to start a directional move. A demand zone is usually read as a lower area where buying imbalance may have started an upward move, while a supply zone is an upper area where selling imbalance may have started a downward move.
The simplest distinction is this: support reads the market from reaction history, while supply and demand reads the market from possible imbalance origin. Both can overlap, but they do not prove the same thing.
| Question | Support reading | Supply and demand reading | What can go wrong |
|---|---|---|---|
| What is being observed? | A lower area where price has reacted before. | A broader zone where buying or selling imbalance may have started a move. | The same area may be labeled with both terms without checking what evidence supports each reading. |
| What is the main evidence? | Repeated reaction, hesitation, or rejection around a prior area. | Strong departure from a zone, later return behavior, and whether the zone still affects price. | A single touch can be treated as stronger evidence than it really is. |
| Is it usually a line or a zone? | Often drawn as a line, but better interpreted as an area. | Usually treated as a zone because imbalance rarely starts from one exact price. | An exact line can create false precision around a market area that is naturally uneven. |
| What makes the reading weaker? | Repeated failures, deeper acceptance below the area, or reactions that become smaller over time. | Too many tests, weak departure, unclear origin, or later acceptance through the zone. | Old evidence can remain on the chart after the market has stopped respecting it. |
| What should not be assumed? | That support must hold because price reacted there before. | That every strong move came from a tradable imbalance zone. | Both readings can become deterministic if later behavior is ignored. |
Key Criteria That Separate the Two Readings
The cleanest way to compare the two concepts is to check what each reading needs before it becomes useful. Support does not require a dramatic origin move. It can come from repeated reactions, visible hesitation, or a lower area where sellers repeatedly failed to continue lower.
Supply and demand needs a different evidence stack. The zone should have a plausible imbalance origin, a meaningful departure, and later behavior that shows whether the old imbalance area still matters.
| Criterion | Support | Supply and demand |
|---|---|---|
| Repeated reaction evidence | Central. Multiple reactions can strengthen the idea that the area matters. | Useful, but too many returns can also weaken a fresh imbalance reading. |
| Line vs zone | Often simplified into a level, but the practical reading is usually an area. | Usually starts as a zone because the imbalance is read across a price area. |
| Prior reaction vs origin of impulse | Prior reaction is enough to begin the reading. | The origin of the earlier move is the main question. |
| Strength of departure | Helpful, but not always required. | Important because a weak departure gives less evidence of imbalance. |
| Freshness and repeated testing | Repeated testing may confirm that the area is visible to the market. | Repeated testing can consume or weaken the zone if reactions lose force. |
| Acceptance or rejection | Later acceptance below support can make the old support reading outdated. | Later acceptance through a demand or supply zone can weaken the imbalance reading. |
| Confirmation, weakening, invalidation | Reaction quality and later acceptance decide whether the area remains active. | Departure quality, return behavior, and acceptance through the zone decide whether the reading remains useful. |
Same Area, Different Meaning
A chart revisits a lower area and reacts upward. Under a support lens, the useful observation is that price responded near a prior reaction area. The question is whether the reaction is still meaningful or whether the area is losing influence after repeated tests.
Under a demand-zone lens, the useful question changes. The focus moves to whether the earlier upward move started from a visible imbalance area, whether price left that area with strength, and whether the later return still respects the zone.
The same lower area can support both readings, but the diagnostic question is different. Support asks whether price is still reacting around an observed area. A demand-zone reading asks whether an earlier imbalance area is still being respected by later behavior.
Same-scenario contrast: A lower area that causes several upward reactions can be called support because the reaction history is visible. The same area can also be studied as a demand zone if an earlier upward move started from that zone with enough force to suggest imbalance.
The mistake is treating the labels as interchangeable. A repeated reaction does not automatically prove imbalance, and a suspected demand zone does not automatically prove that support will remain active.
Where Support and Demand Zones Overlap
Support and demand zones often overlap because buying pressure can create a lower reaction area. If price leaves a zone strongly, later returns to that area may also look like support. That overlap is normal, but the evidence is not identical.
A demand zone can become a visible support area after price returns and reacts there more than once. In that case, the area has two layers of evidence: the earlier imbalance reading and the later reaction history. The later reactions do not erase the original imbalance question, and the imbalance idea does not remove the need to check current behavior.
The overlap becomes weaker when each return produces a smaller reaction, when price spends more time inside the area, or when the market accepts below the old lower boundary. At that point, the old label may remain on the chart, but the reading may no longer describe current behavior.
Support Level vs Demand Zone
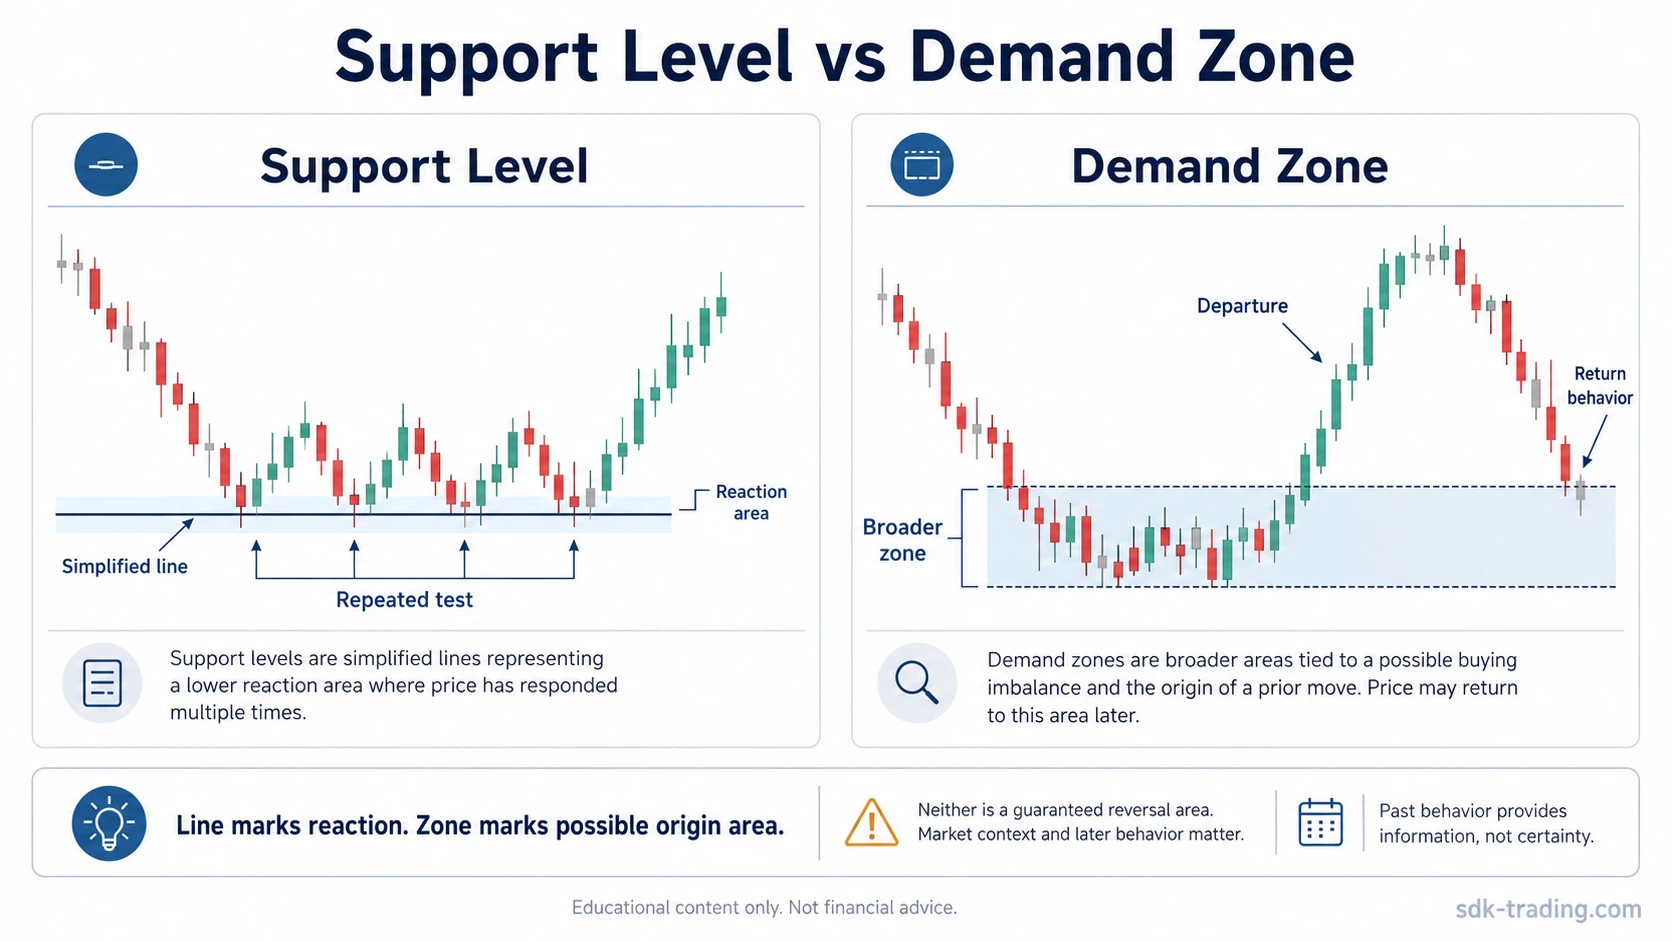
A support level is a simplified way to mark a lower reaction area. It is useful for orientation, but it can create the illusion that one exact price should matter. In live chart reading, support is usually better treated as a small area because candles, wicks, gaps, and uneven tests rarely respect one exact line cleanly.
A demand zone is broader by design. It tries to capture the area where buying imbalance may have appeared before price moved away. The width of the zone should come from the structure of the move, not from a desire to make the chart fit a preferred reading.
The practical boundary is simple: support level analysis starts from repeated reaction, while demand-zone analysis starts from suspected imbalance origin. The overlap can be useful, but the two ideas should not be collapsed into one label.
Common Misreads and Limits
A common misread is assuming that supply and demand is automatically more reliable than support. That framing is too broad. A well-observed support area can be clearer than a poorly defined demand zone, and a clean imbalance zone can carry information that a simple support line misses.
Another misread is assuming that a break of support automatically creates supply. A break below a support area shows that the old support reading may be weakening or outdated. It does not automatically prove that a new supply zone exists. A supply reading needs its own evidence, including how price left the area and how later behavior develops around it.
A third misread is treating the first reaction as confirmation. A reaction can be useful evidence, but the reading becomes better supported only when later behavior confirms that the area still matters. If price repeatedly enters the area with weaker reactions, spends more time there, or accepts beyond it, the old interpretation needs to be downgraded.
Limitations: Neither concept predicts that price must reverse. Support, demand, and supply readings describe observed behavior around chart areas. They become stronger, weaker, or outdated as later price action adds evidence.
When to Use Each Lens
Use the support lens when the main evidence is reaction history around a lower area. This reading is most useful when the question is whether price is still responding near a prior area, not whether an earlier imbalance created the move.
Use the supply and demand lens when the main evidence is the origin and quality of a strong move away from a zone. This reading is most useful when the question is whether buying or selling pressure may have started from a specific area and whether return behavior still respects that zone.
When both readings appear in the same area, keep the evidence separate. The reaction history may support a support reading, while the strength and origin of the earlier move may support a demand-zone reading. The overlap is useful only if later behavior continues to support both interpretations.
FAQ
Is support the same as a demand zone?
No. Support is a reaction-area reading based on where price has responded before. A demand zone is an imbalance-origin reading based on where buying pressure may have started a strong move. They can overlap, but they are not the same concept.
Can a demand zone become support?
Yes. A demand zone can also act as support if price later returns to the area and reacts there. The demand-zone reading comes from the earlier imbalance idea, while the support reading comes from later reaction history.
Is supply and demand more reliable than support?
Not automatically. A clear support area can be more useful than a poorly defined demand zone. The better reading depends on the quality of the evidence, including reaction history, departure strength, freshness, and later acceptance or rejection.
Does a break of support automatically create supply?
No. A break of support can weaken or invalidate the old support reading, but it does not automatically create a supply zone. A supply zone needs separate evidence that selling imbalance started from a meaningful area.
Can support and supply and demand readings be compared together?
They can be compared together when the chart area is the same, but the evidence should stay separate. Support asks whether price reacts at a prior area. Supply and demand asks whether an imbalance zone is still respected.