Price action trading is a way to read visible price behavior on a chart by studying candles, swings, levels, trend or range structure, acceptance, rejection, and follow-through. It does not rely primarily on indicator signals. The useful reading is conditional: a candle, level break, or clean chart pattern does not prove direction unless the surrounding sequence supports it.
Core limitation: price action can organize what price is doing, but it does not remove uncertainty. A pattern becomes more useful when location, prior structure, test behavior, and later follow-through all point toward the same interpretation.
What Price Action Trading Means
Price action trading studies the movement of price itself rather than using an indicator as the first source of interpretation. The focus is on what buyers and sellers appear to accept, reject, defend, or fail to continue around visible chart structure.
The method is not just “trading without indicators.” A blank chart can still be misread. The important question is whether the visible behavior forms a sequence: price approaches a reference area, tests it, shows acceptance or rejection, and then either follows through or fails.
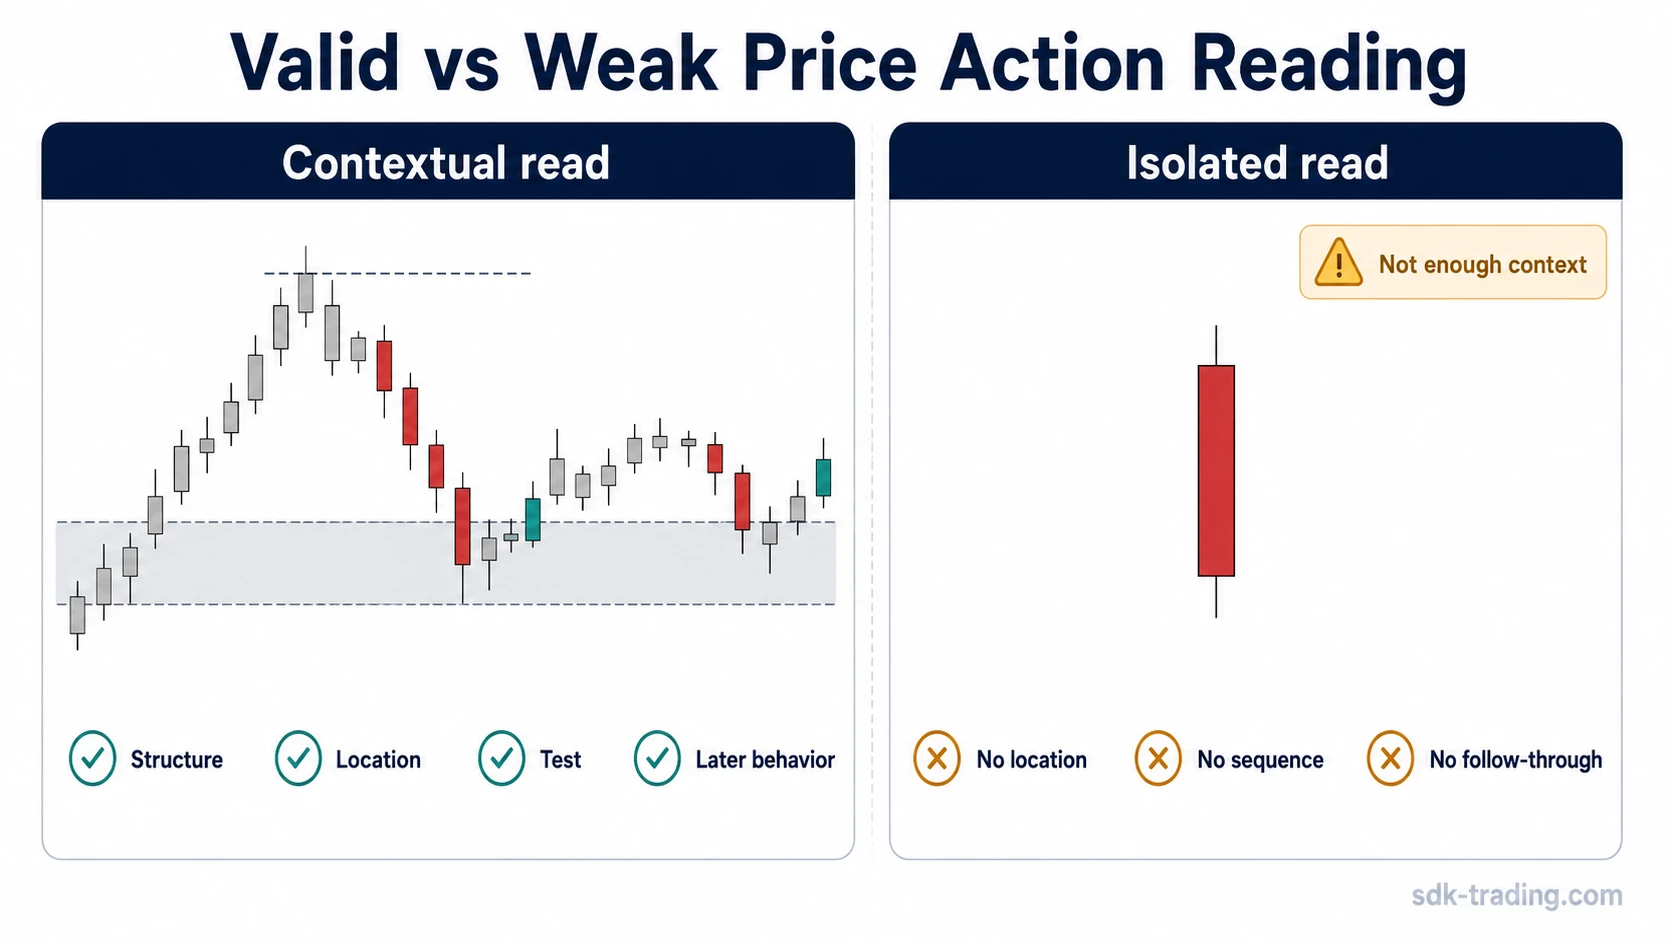
Simple reading rule: A price action reading has more context when the market shows structure, location, test behavior, and follow-through together. It has less value when the interpretation depends on one candle, one wick, or one isolated breakout.
What Price Action Trading Reads
Price action trading uses visible chart evidence. The same candle or level break can mean different things depending on where it appears and what happens after it appears.
| Visible element | What it can help read | Why it needs context |
|---|---|---|
| Candles | Short-term pressure, rejection, hesitation, or expansion. | Without location and follow-through, one candle only records temporary pressure. |
| Swings | Whether price is forming higher highs, lower lows, or overlapping movement. | A single swing does not define the full structure. |
| Support and resistance | Where price previously reacted, stalled, rejected, or accepted value. | A touch or probe is not the same as acceptance. |
| Trend or range behavior | Whether price is moving directionally or rotating between areas. | Trend readings lose quality when movement becomes choppy or overlapping. |
| Failed acceptance | Whether price tried to hold beyond a level and quickly returned. | A wick only marks the probe; later behavior decides whether the failure reading is defensible. |
| Follow-through | Whether the market continues after a test, rejection, or breakout attempt. | Weak follow-through can turn a clean-looking move into a false read. |
Why One Candle or One Breakout Is Not Enough
A large candle can look decisive, but size alone does not explain whether the move is accepted. A breakout can look clean, but the first move beyond a level may only be a probe. A chart can look simple, but simplicity does not guarantee that the information is high quality.
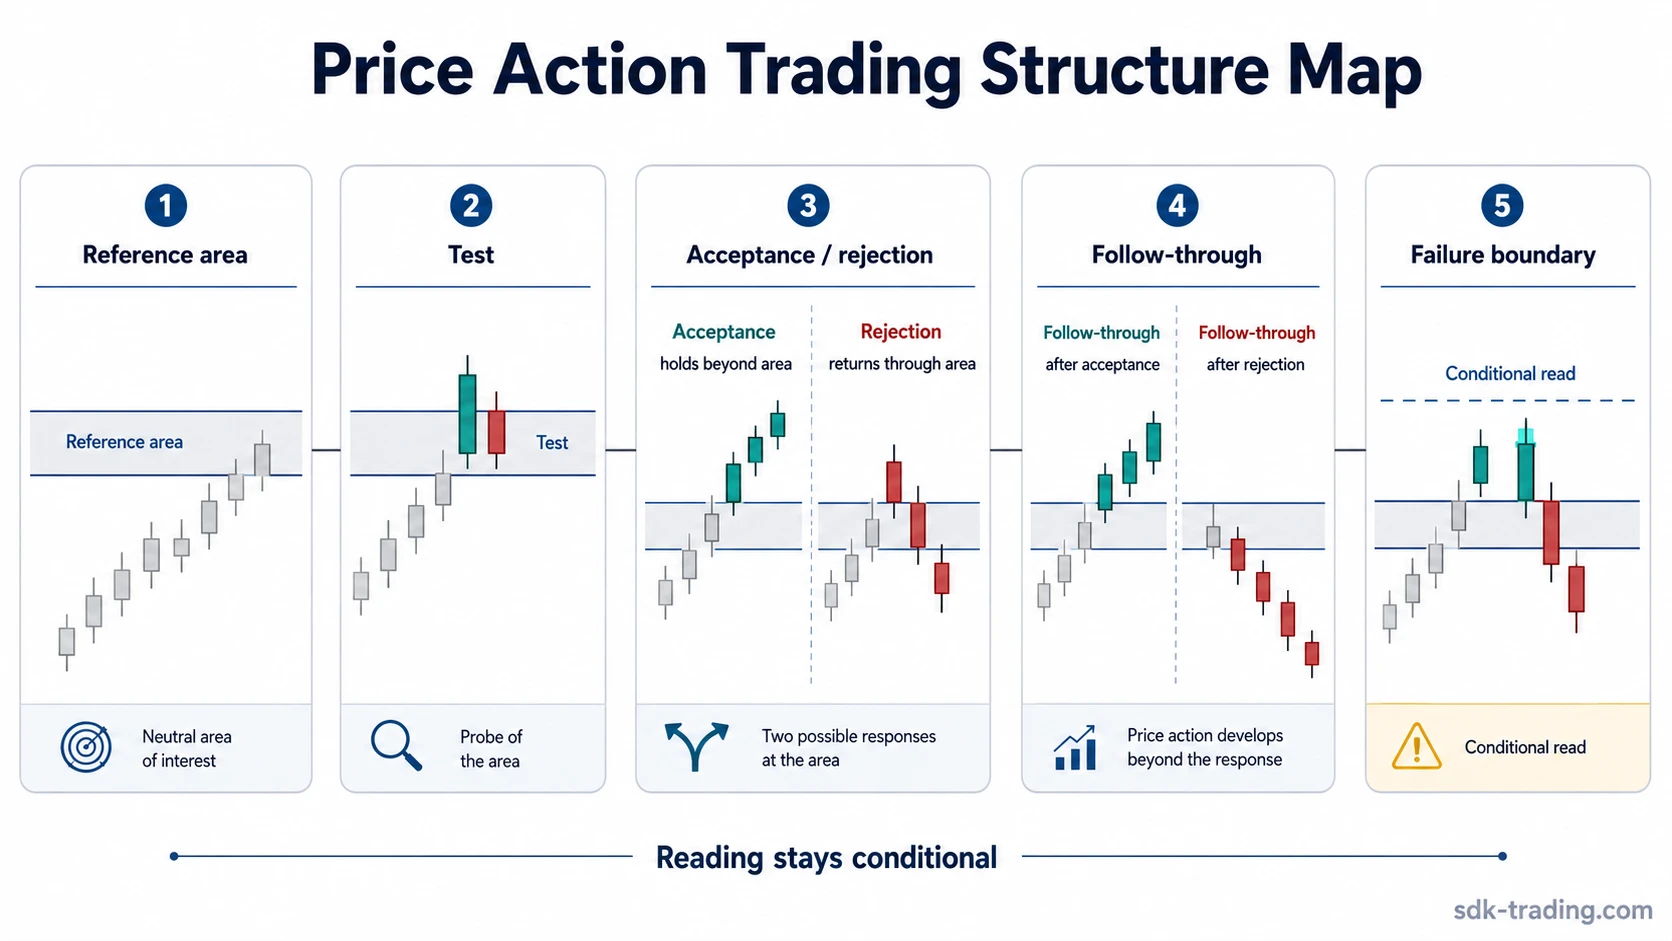
The read becomes more disciplined when the sequence is checked in order: prior movement, reference area, test, acceptance or rejection, follow-through, and failure boundary. Skipping that sequence usually turns price action into pattern naming rather than interpretation.
- Prior movement: identify whether price was trending, ranging, expanding, or compressing before the event.
- Reference area: mark the level, swing, range edge, or structure that gives the next move context.
- Test behavior: watch whether price probes, pauses, rejects, accepts, or rotates around the area.
- Later behavior: use follow-through or failure to decide whether the first read is gaining support or losing quality.
Price Action Trading vs Indicator-Heavy Analysis
Price action trading begins with the chart’s visible behavior. Indicator-heavy analysis begins with a derived reading, such as a moving average, oscillator, or volatility band. Both can be useful, but they answer different questions.
| Approach | Primary input | Useful for | Main risk |
|---|---|---|---|
| Price action trading | Visible movement, candles, swings, levels, acceptance, rejection. | Reading structure and behavior around reference areas. | Subjective interpretation if sequence is ignored. |
| Indicator-heavy analysis | Calculated signals derived from price, volume, or volatility. | Smoothing noise, measuring conditions, or adding secondary confirmation. | Delayed or mechanical readings if context is ignored. |
Indicators do not become useless just because price action is the starting point. They can support a broader process when they are treated as context rather than as automatic confirmation.
Price Action Reading Boundary
The boundary between useful reading and overconfident interpretation is usually the difference between condition and signal. A condition says the market is showing behavior worth tracking. A signal reading becomes overconfident when it treats that behavior as a finished answer before acceptance, rejection, or follow-through is visible.
| Trigger condition | Common misread | Safer interpretation | What weakens the reading | Reference area to check |
|---|---|---|---|---|
| Price probes beyond a visible level | “Breakout confirmed” | The move is only meaningful if acceptance and follow-through develop. | Quick return through the level or weak continuation. | resistance area or range edge. |
| Large candle appears after a trend | “Reversal signal” | One candle needs structure, location, failed acceptance, and later behavior. | No clear rejection, no follow-through, or immediate overlap. | Prior swing, range boundary, or trend structure. |
| Price rejects a lower area | “Support held perfectly” | The read improves only if price stops accepting lower value and responds afterward. | Repeated lower tests, weak bounce, or renewed acceptance below the area. | support zone or prior demand area. |
| Clean trend continues | “Trend will keep going” | Continuation still depends on pullback behavior, structure, and acceptance. | Choppy overlap, failed follow-through, or loss of swing structure. | Swing sequence and prior consolidation. |
A Practical Price Action Scenario
Imagine price has been moving sideways between two visible areas. It pushes above the upper area, pauses briefly, and then quickly returns back inside the prior range. The first push may look like a breakout, but the return changes the interpretation.
If price later accepts back inside the range and fails to continue above the reference area, the breakout read loses quality. If price returns above the area and holds with follow-through, the acceptance read has more support. The same initial move can therefore produce two different interpretations depending on later behavior.
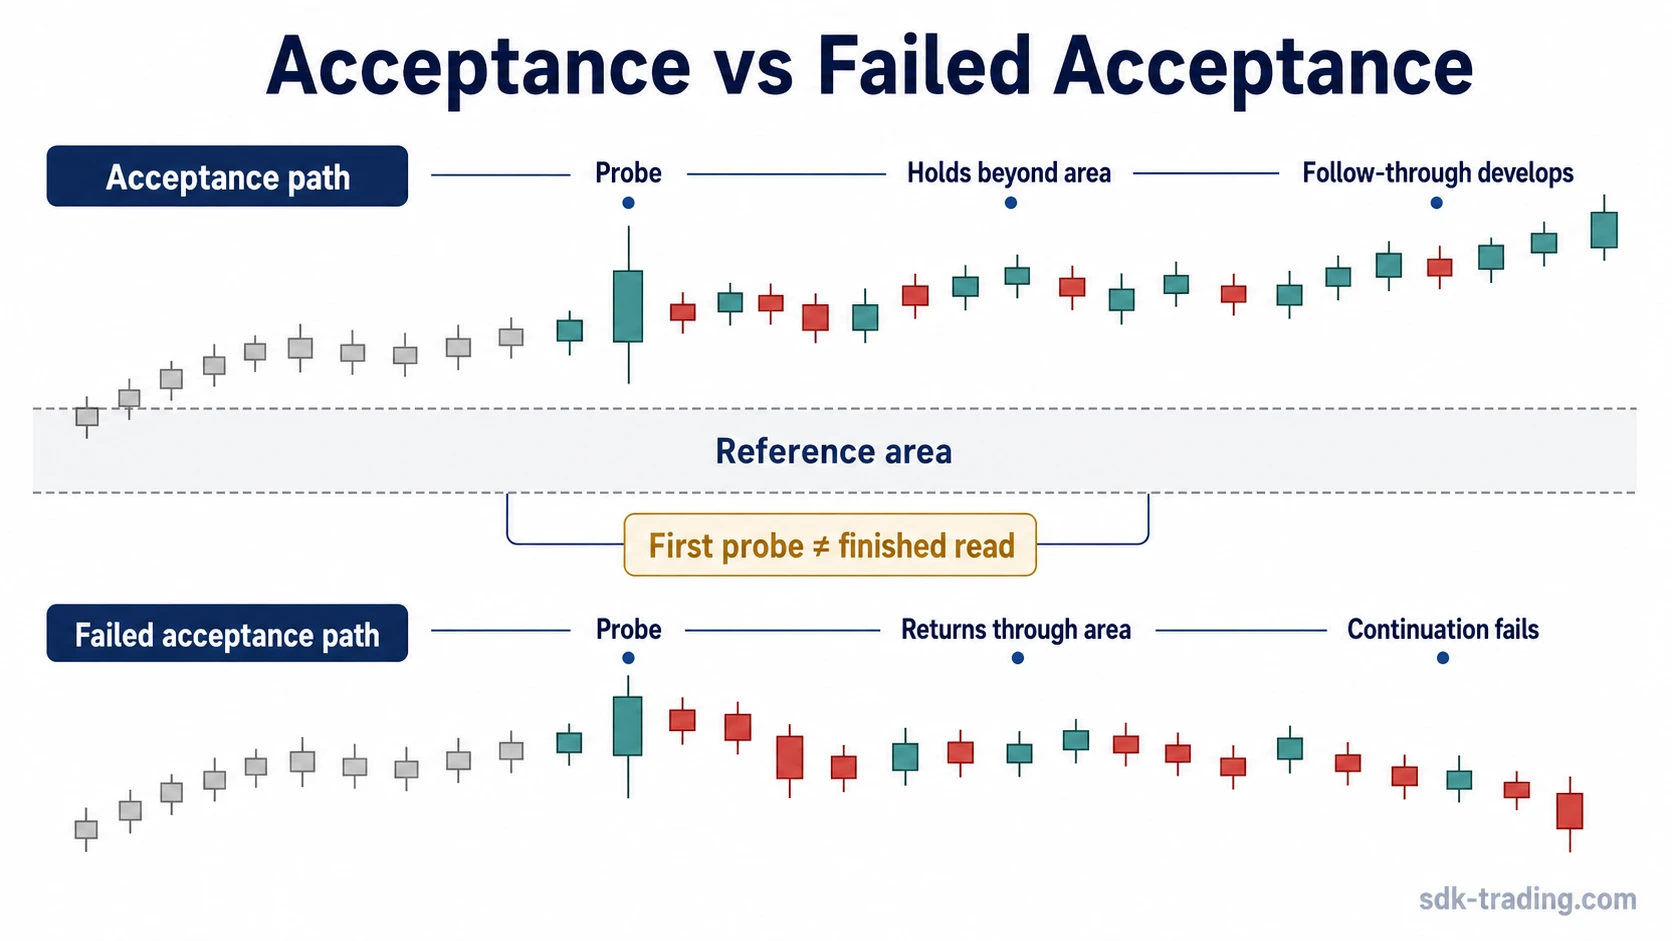
Safe interpretation: the first move beyond a level is only a test. The read should stay open until the market shows whether that area is accepted, rejected, or reclaimed.
Does Price Action Trading Work?
Price action trading can help organize visible market behavior and reduce indicator clutter. It can make the reading process more structured by forcing attention onto levels, swings, acceptance, rejection, and follow-through.
It does not prove direction, remove risk, or turn a chart pattern into a reliable outcome. It works best as a framework for asking better questions: where is price reacting, what is being accepted, what failed to continue, and what later behavior confirms or challenges the read?
The weakest use of the method is treating a candle, wick, breakout, or named pattern as the answer before the surrounding structure responds. Price action is more useful as conditional evidence than as a standalone signal.
Common Price Action Trading Mistakes
| Mistake | Why it creates a weak reading | Better question |
|---|---|---|
| Treating one candle as the full signal | The candle may only reflect temporary pressure or noise. | Where did it appear, and what happened after it? |
| Confusing a level probe with acceptance | Price can move beyond a level without holding there. | Did the market accept the new area or return through it? |
| Reading every clean chart as high-quality information | A clean chart can still lack structure or follow-through. | Is the movement connected to a clear reference area? |
| Ignoring failed follow-through | A move that cannot continue may change the meaning of the first read. | Did later behavior support or challenge the original interpretation? |
| Turning price action into prediction | Visible behavior describes conditions, not guaranteed outcomes. | What would make the interpretation invalid or less useful? |
How to Read Price Action More Carefully
A disciplined read starts with the market’s current condition rather than with a desired outcome. Trend, range, compression, expansion, and failed acceptance all change the meaning of the same candle shape.
- Start with structure: identify whether price is trending, ranging, or overlapping.
- Mark the reference area: use visible swings, range edges, or repeated reactions.
- Watch the test: separate a probe from accepted movement.
- Wait for behavior: follow-through or failure matters more than the first impression.
- Keep the read conditional: the interpretation should change when the evidence changes.
FAQ
Is price action trading the same as trading without indicators?
No. Trading without indicators can still be unstructured. Price action trading depends on reading visible behavior around reference areas and then checking whether later behavior supports or weakens the interpretation.
Does price action trading work by itself?
It can help organize chart interpretation, but it does not prove direction or outcome by itself. The reading depends on context, sequence, risk framing, and later behavior.
Why can price action readings fail?
Readings often fail when one candle, one wick, one breakout, or one named pattern is treated as a complete answer. Failed acceptance, weak follow-through, and changing structure can all weaken the original read.