Channels and trendlines classify line-based chart structure in technical analysis. A single trendline can frame one side of price movement, while a channel uses two boundaries to describe repeated movement inside a visible path.
The useful question is whether the chart needs a single trendline, a rising or falling channel label, a broader price channel reading, or a separate boundary-break reading.
Definition: Channels and trendlines are chart-reading tools used to organize repeated price behavior around visible boundaries. A trendline tracks one side of movement; a channel adds a second boundary so the structure can be read as a contained path rather than a single line.
When to Use Channels, Trendlines, and Price Channels
- The chart question is about line-based structure, not a candlestick pattern by itself.
- Price repeatedly reacts near one visible line or between two visible boundaries.
- The slope of the boundaries helps separate rising, falling, and broader channel structures.
- Movement outside a boundary needs acceptance, not only a brief wick through the line.
Channels and Trendlines in Chart Analysis
A trendline starts with one visible boundary. That boundary may connect rising lows, falling highs, or another repeated directional path. The line becomes more useful when later price behavior respects the same area without forcing the chart to fit the drawing.
A channel needs more structure. Price must show repeated behavior between two boundaries, often with a similar slope. The upper and lower lines create a contained path, so the classification depends on direction, containment, and how price behaves near both sides.
A boundary break belongs to a different question. Once price moves beyond a line, the important issue becomes whether the market accepts the new area or quickly returns into the prior structure.
How to Choose the Right Line-Based Pattern
The classification becomes clearer when the chart question is separated before the label is chosen. A rising channel, falling channel, broad price channel, and boundary breakout can all use lines, but they do not answer the same chart-reading problem.
| Chart question | Likely concept | What strengthens the classification | More specific concept |
|---|---|---|---|
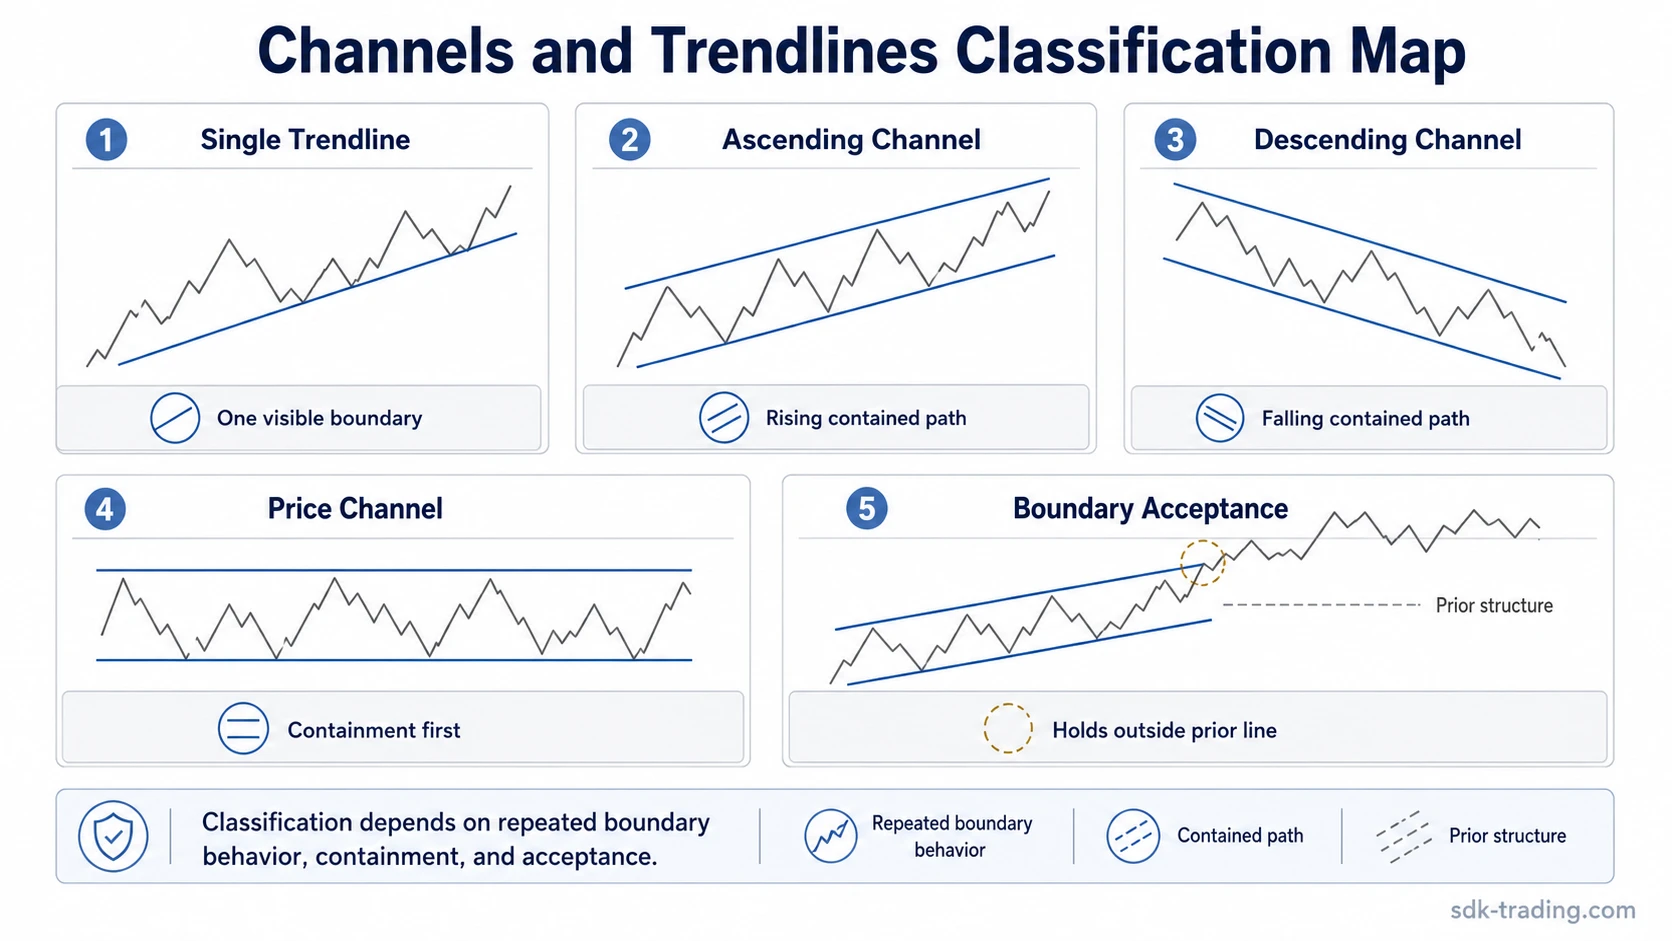
| Are both boundaries rising while price remains contained between them? | Rising channel structure | Repeated reactions near the lower and upper boundaries without a fast return outside the path. | ascending channel structure |
| Are both boundaries falling while price continues to move inside the same downward path? | Falling channel structure | Lower highs and lower lows forming a visible contained path rather than isolated line touches. | descending channel structure |
| Is the main issue repeated containment between two boundaries, regardless of the exact slope label? | Channel containment | Price moving between two visible boundaries often enough to make the structure observable. | price channel structure |
| Has price moved outside a trendline or channel boundary and remained outside the prior structure? | Boundary acceptance | Follow-through outside the boundary instead of an immediate move back into overlap. | trendline breakout behavior |
Trendline, Channel, and Breakout Boundaries
A trendline can describe one side of a move. It may act as a lower boundary in an advance or an upper boundary in a decline. The line is weaker when it depends on one isolated reaction or when later price behavior ignores it.
A channel needs two boundaries. The second line changes the interpretation because price is no longer being judged against only one side of structure. The chart must show repeated movement within the path for the channel label to stay defensible.
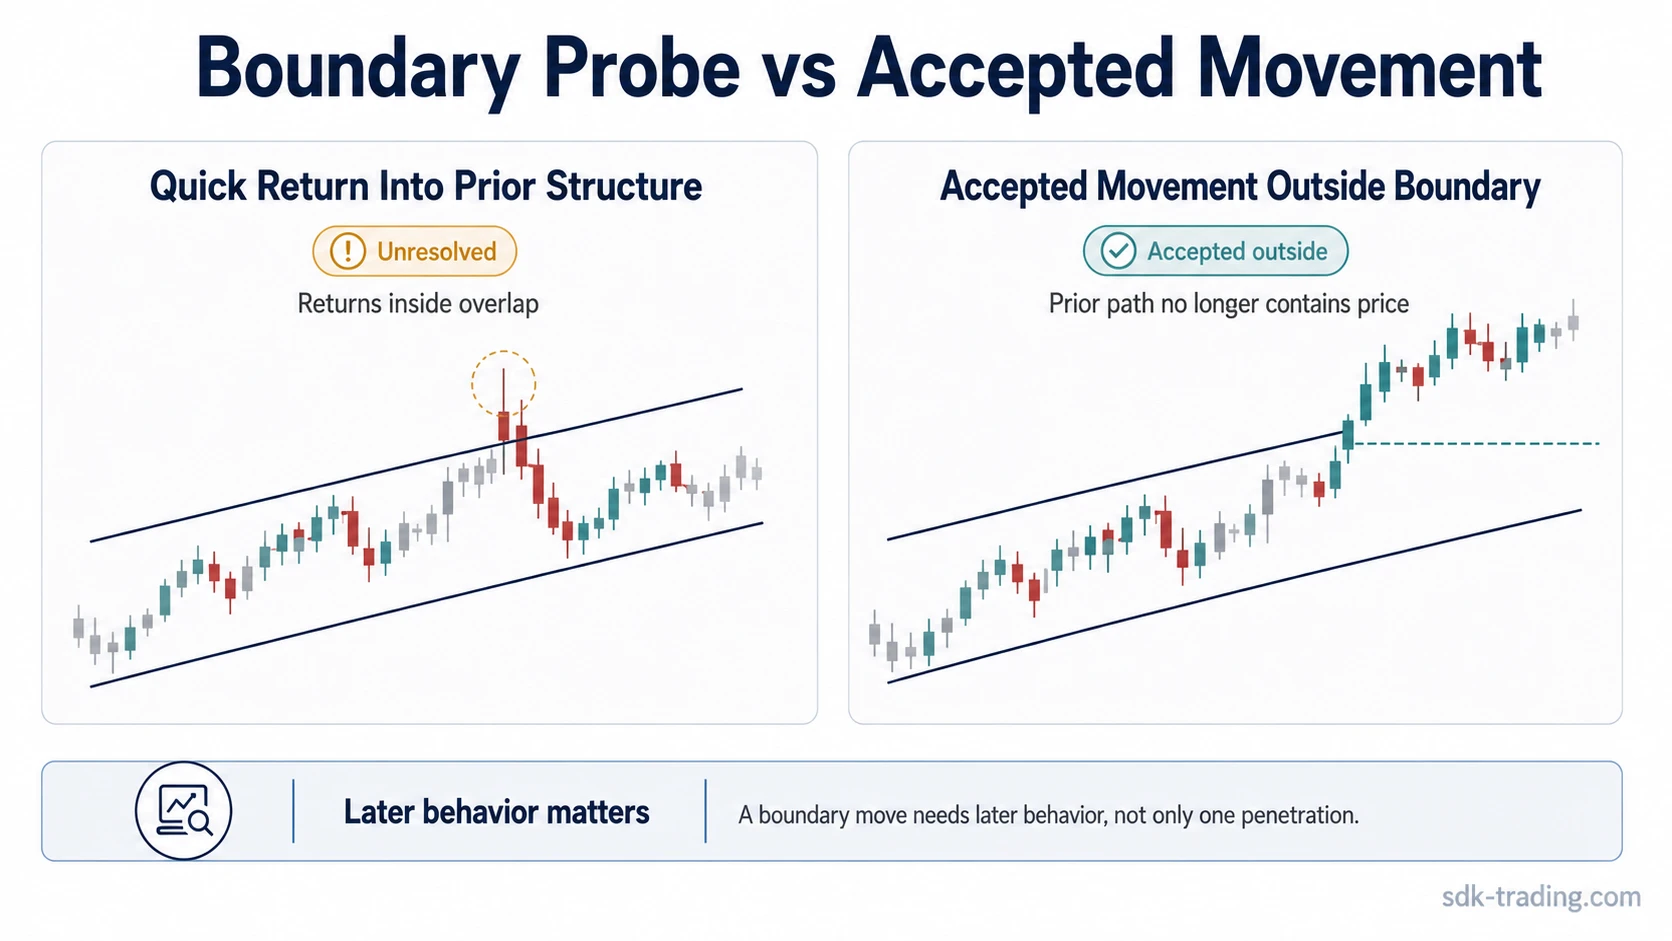
A boundary break is not the same as a channel label. A brief wick through a line can be a probe, a failed test, or temporary volatility. Holding outside the prior structure gives the breakout interpretation more weight than a single penetration that immediately returns into overlap.
Structure-quality note: A cleaner interpretation comes from repeated boundary behavior and later acceptance. A weaker interpretation comes from a line drawn after the fact, a single sharp wick, or a boundary that price immediately re-enters.
Common Misreads With Channels and Trendlines
One common mistake is forcing a line through unrelated highs or lows. A line can always be drawn somewhere, but a useful structure needs repeated behavior that remains visible without excessive adjustment.
Another mistake is treating every boundary contact as a complete market read. A touch near a channel line can identify a location, but the surrounding structure still matters. Slope, containment, failed acceptance, and later reactions all change the interpretation.
Common misread: A wick beyond a boundary is often labeled too quickly. The stronger distinction is whether price holds outside the prior line or moves straight back into the earlier structure.
Channels can also be confused with rectangles, ranges, and wedges. A rectangle or range is usually read through horizontal containment. A wedge narrows as boundaries converge. A channel keeps the focus on two broadly parallel boundaries and the directional path between them.
When to Use Each Deeper Concept
Use an ascending channel reading when the chart shows two upward-sloping boundaries and price continues to move between them. The slope matters because the structure is defined by rising containment, not only by a single upward line.
Use a descending channel reading when the chart shows two downward-sloping boundaries and price remains organized inside that falling path. The classification weakens when the second boundary is unclear or when price repeatedly fails to respect the path.
Use a price channel reading when the most important feature is repeated movement between two boundaries. The broader channel concept fits when containment matters more than whether the first question is bullish, bearish, or breakout-oriented.
Use a trendline breakout reading when the main evidence is movement beyond a boundary. The focus shifts from drawing the line to judging whether price has accepted the move outside the earlier structure.
Simple Channels and Trendlines Example
Price moves between two visible boundaries and reacts near both sides often enough for the path to be observable. If both boundaries rise, the chart fits an ascending channel reading; if both boundaries fall, the chart fits a descending channel reading; if direction is secondary, the broader price channel concept may be enough.
If price later trades beyond one boundary but immediately returns inside the prior path, the breakout interpretation remains unresolved. If later candles hold outside the prior boundary and the old path no longer contains price, the boundary behavior becomes the main question.
Channels and Trendlines FAQ
Is a trendline the same as a channel?
No. A trendline uses one boundary to frame price movement. A channel uses two boundaries, so the reading depends on repeated movement between both sides of the structure.
How many touches make a channel valid?
There is no fixed number that makes a channel valid in every market. More repeated reactions can make the structure easier to observe, but the line still needs to fit current price behavior without being forced.
Does a wick through a channel boundary count as a breakout?
A wick alone is weak evidence. A breakout reading becomes more defensible when price accepts the area outside the prior boundary instead of quickly returning into the channel.
When does a price channel label fit better than an ascending or descending channel label?
A price channel label fits better when the main feature is containment between two boundaries and the exact directional subtype is less important than the structure itself.