A trendline breakout is a trading chart reading where price moves beyond a previously respected diagonal trendline and begins to behave as if the old slope no longer contains movement.
A single wick through the line is weaker evidence than a close-through, follow-through, and later behavior that fails to return cleanly to the old side of the boundary.
Definition: A trendline breakout occurs when price moves beyond a diagonal trendline that previously acted as a meaningful boundary. The reading is more defensible when the line had prior respect, the break is visible beyond the line, and later price action supports the idea that the former boundary has lost relevance.
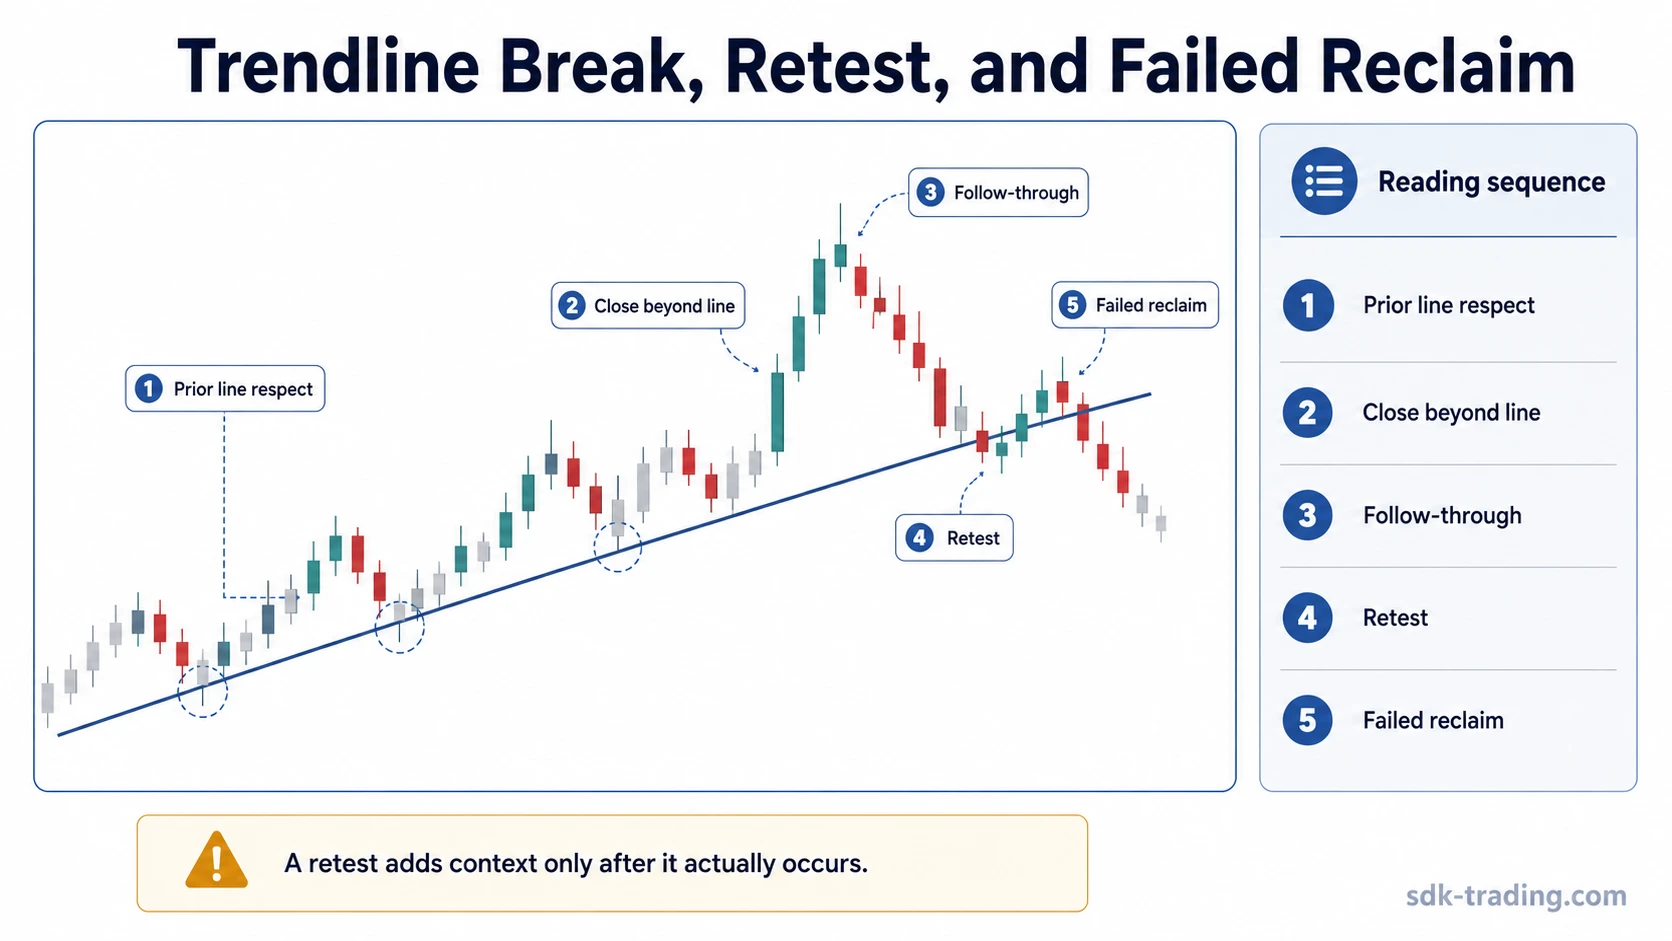
The break itself is only the first observation. A stronger reading depends on what happens after the line is crossed: whether price accepts the new side of the boundary, whether a retest respects the former line from the other side, and whether the market avoids an immediate return into the old structure.
Key Points
- A trendline breakout needs a diagonal line that had visible prior respect.
- A wick beyond the line is weaker evidence than accepted movement beyond it.
- A retest can add context, but it is not a guaranteed step.
- Failure to reclaim the former line after a retest can make the breakout reading more structurally defensible.
- Volume and candle quality can support the reading, but they do not prove continuation.
What a Trendline Breakout Means
A trendline breakout means price has moved beyond a diagonal boundary that previously helped describe the market’s slope. In an up-sloping structure, the break may appear below a rising line. In a down-sloping structure, it may appear above a falling line. The important point is not direction by itself, but the loss of respect for the prior diagonal boundary.
The line should have a reason to matter before the breakout is considered meaningful. A trendline that touches one isolated swing or has been repeatedly redrawn around new candles is weak evidence. A more useful line has several prior reactions, a clear slope, and enough visual consistency to show that traders have been using that area as a structural boundary.
Once price moves outside that boundary, the market is no longer behaving exactly as it did while the line was respected. That does not make the breakout predictive. It only creates a structural question: is the old slope losing relevance, or was the move just a temporary violation?
Not Every Break Beyond the Line Is a Breakout
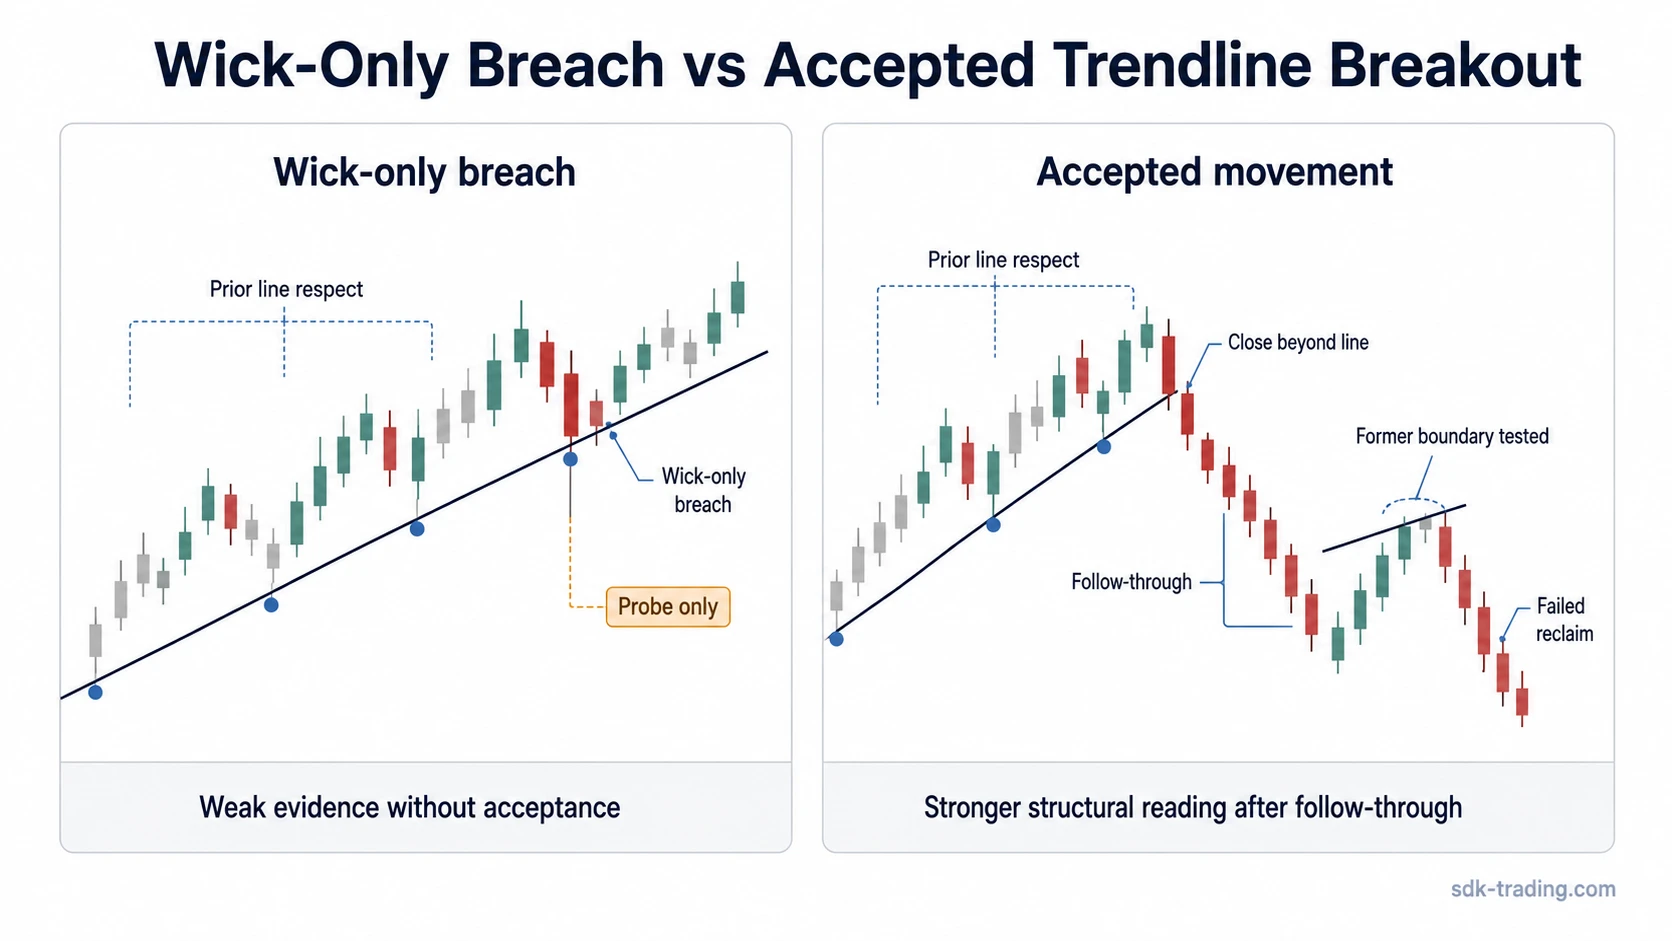
A brief pierce through a trendline can look important while the candle is forming, but the close and later behavior carry more diagnostic value. A wick that crosses the line and then closes back inside the old structure often shows a probe rather than accepted movement.
Not this: one wick beyond a diagonal line, followed by an immediate return inside the prior structure.
Instead this: a visible move beyond a previously respected line, a close that holds outside the boundary, follow-through on the new side, and later interaction that suggests the former line is no longer controlling price.
The distinction protects the reading from becoming mechanical. Price can cross a line for a moment because of volatility, thin liquidity, or a temporary test of orders near the boundary. A cleaner breakout reading needs behavior that remains outside the former line long enough to show that the old slope is being challenged.
What Makes a Trendline Breakout Reading More Defensible
A trendline breakout reading becomes more defensible when several pieces of evidence point in the same direction. None of them proves what will happen next. Their value is in separating a cleaner structural change from a brief violation.
| Evidence | What It Adds | What Still Needs Caution |
|---|---|---|
| Prior line respect | The line had enough previous reactions to act as a meaningful boundary. | A forced or repeatedly adjusted line can make the breakout look cleaner than it is. |
| Close beyond the line | The market did not only pierce the boundary intraperiod. | One close still does not prove that the old structure has fully changed. |
| Follow-through | Price continues to behave on the new side of the former boundary. | Fast return inside the old structure weakens the reading. |
| Retest behavior | The former line may act as a test area from the other side. | A retest is evidence only after it happens; it should not be treated as guaranteed. |
| Volume and candle quality | Higher participation and decisive candle structure can support an acceptance reading. | Volume and candle shape add context, but they do not prove continuation. |
A retest can show whether price still respects the former line or has begun to behave on the other side of it. If price returns to the broken line and then cannot reclaim the old structure, the breakout reading is more structurally defensible than a one-candle break with no later interaction.
Failed Trendline Breakouts
A failed trendline breakout happens when price moves beyond the line, cannot hold outside it, and then returns to the prior side of the boundary. The failure is more obvious when price rejects the former breakout area and the old structure absorbs the move instead of allowing acceptance beyond it.
Failed breakouts matter because a clean line cross can create a false sense of structural change. The market may appear to break the slope, but later candles can show that the move was only a probe. The breakout reading weakens when price reclaims the old side quickly, stalls near the former boundary, or shows no sustained behavior beyond the line.
Simple Trendline Breakout Example: Price has respected a rising diagonal line several times. A candle briefly trades below the line but closes back above it, leaving only a lower wick outside the boundary. That is weak evidence because the market has not accepted movement below the line.
Later, price closes below the same line and the next recovery attempt stalls near the former boundary. If price cannot reclaim the old slope and continues to behave below it, the reading becomes more defensible as a structural break. If price quickly closes back above the line and resumes the prior slope, the breakout reading remains unresolved or failed.
Trendline Break vs Trendline Breakout
A trendline break is the event: price crosses the diagonal line. A trendline breakout is the broader reading that may develop if later behavior supports the idea that the former line has lost relevance.
This distinction matters because a line can be broken without producing accepted movement. The break identifies where the question starts. The breakout reading depends on close location, follow-through, retest behavior, and whether price can or cannot reclaim the old side of the line.
| Term | Main Meaning | Weak Reading | Stronger Reading |
|---|---|---|---|
| Trendline break | Price crosses a diagonal boundary. | A single wick or brief pierce beyond the line. | A clear cross that begins the structural test. |
| Trendline breakout | Price behavior supports loss of respect for the former line. | Price immediately returns inside the old structure. | Price accepts the new side, follows through, or fails to reclaim the former line. |
Trendline Breakout vs Channel Break
A trendline breakout focuses on one diagonal boundary. A channel break involves a broader structure because a channel contains price between two roughly parallel boundaries. That difference matters when the chart has both an upper and lower boundary, not only one working trendline.
A break of one line inside an ascending channel structure should be separated from the loss of the full rising channel. One boundary may be tested or broken while the broader channel still needs separate evaluation.
A price channel adds the second boundary to the analysis. The question becomes whether price is only losing respect for one trendline or whether the two-boundary containment structure is breaking down.
Common Mistakes When Reading Trendline Breakouts
The most common mistake is treating the line cross as enough. A trendline breakout reading is weaker when the line was forced, the break is only a wick, or the next candles immediately return inside the prior structure.
- Forcing the line: a line that keeps moving to fit new candles creates unreliable breakout evidence.
- Overweighting one wick: a wick outside the boundary can show a test, not acceptance.
- Ignoring timeframe conflict: a lower-timeframe break may sit inside an unchanged higher-timeframe structure.
- Treating retest as guaranteed: a retest can help interpretation only if it actually occurs.
- Using volume as proof: volume can support the reading, but it does not guarantee continuation.
A more conservative reading treats the break as a structural condition first, then evaluates the evidence that follows. Acceptance, failed reclaim, and retest behavior give more information than the first contact with the line alone.
Limitations of Trendline Breakout Readings
Trendlines are partly subjective because different traders may choose different swing points, chart scales, or timeframes. A breakout reading built on a weak line inherits that weakness.
Market behavior around a diagonal boundary can also be noisy. Price may test beyond the line and then return because the broader structure is still intact. Volume, candle size, and momentum can improve the context, but they should remain supporting evidence rather than proof.
The cleanest use of a trendline breakout is diagnostic: it helps identify when a formerly useful slope may be losing relevance. It does not provide a complete trading plan by itself.
FAQ
What is a trendline breakout?
A trendline breakout is price movement beyond a previously respected diagonal trendline, followed by behavior that suggests the former line may no longer contain price.
Is one wick through a trendline enough?
One wick through a trendline is weak evidence by itself. A close beyond the line, follow-through, or later acceptance beyond the boundary supports a cleaner structural reading.
Does a trendline breakout need a retest?
A retest is not required, but it can add useful evidence. The retest matters only if it shows whether price still respects the former line or fails to reclaim it.
What makes a trendline breakout fail?
A trendline breakout fails when price moves beyond the line, cannot hold outside it, and returns to the old side of the boundary without sustained acceptance.
Does volume confirm a trendline breakout?
Volume can support the interpretation when it aligns with decisive price behavior, but it does not prove that the breakout will continue.