A price channel is a trading and technical-analysis structure where price rotates between an upper boundary and a lower boundary. The structure is more defensible when the two boundaries stay roughly parallel and price reacts near both sides more than once.
Two lines around recent movement are not enough. A defensible channel reading needs stable rotation, repeated reactions, and boundary logic that still holds after new swings appear.
Definition: A price channel is a chart structure formed by two roughly parallel boundaries that contain repeated price movement. The upper boundary marks the area where advances tend to stall or react, while the lower boundary marks the area where declines tend to stall or react.
Key Points
- A trading price channel depends on upper and lower boundaries around repeated price rotation.
- A stronger channel has roughly parallel spacing and reactions near both boundaries.
- A weak channel often depends on sparse contacts, uneven spacing, or repeated redrawing.
- A fixed-period price channel indicator is different from a manually classified chart channel.
What Is a Price Channel in Trading?
In trading, a price channel describes a bounded area of movement. Price may rise inside the channel, fall inside the channel, or move sideways between two visible boundaries. The slope can change the channel type, but the basic structure is the same: price is being read through a pair of boundaries rather than through a single trendline.
The upper boundary often acts as a resistance reference, and the lower boundary often acts as a support reference. These labels describe observed chart behavior, not guaranteed future reactions. A boundary can remain useful for classification even when price briefly tests beyond it, but the channel reading becomes weaker when price starts accepting movement outside the former structure.
What a Price Channel Is and Is Not
A price channel is an observable chart structure. It organizes price movement by showing whether reactions are occurring within a stable upper-lower boundary relationship.
A price channel is: a structural reading based on repeated reactions, boundary spacing, slope, and rotation quality.
A price channel is not: a mechanical trade trigger, a forced pair of lines, or proof that price must continue rotating between the same boundaries.
Because channels are partly discretionary, two traders can draw similar but not identical boundaries on the same chart. A defensible reading needs observable contact quality, not only a neat drawing after the move has already happened.
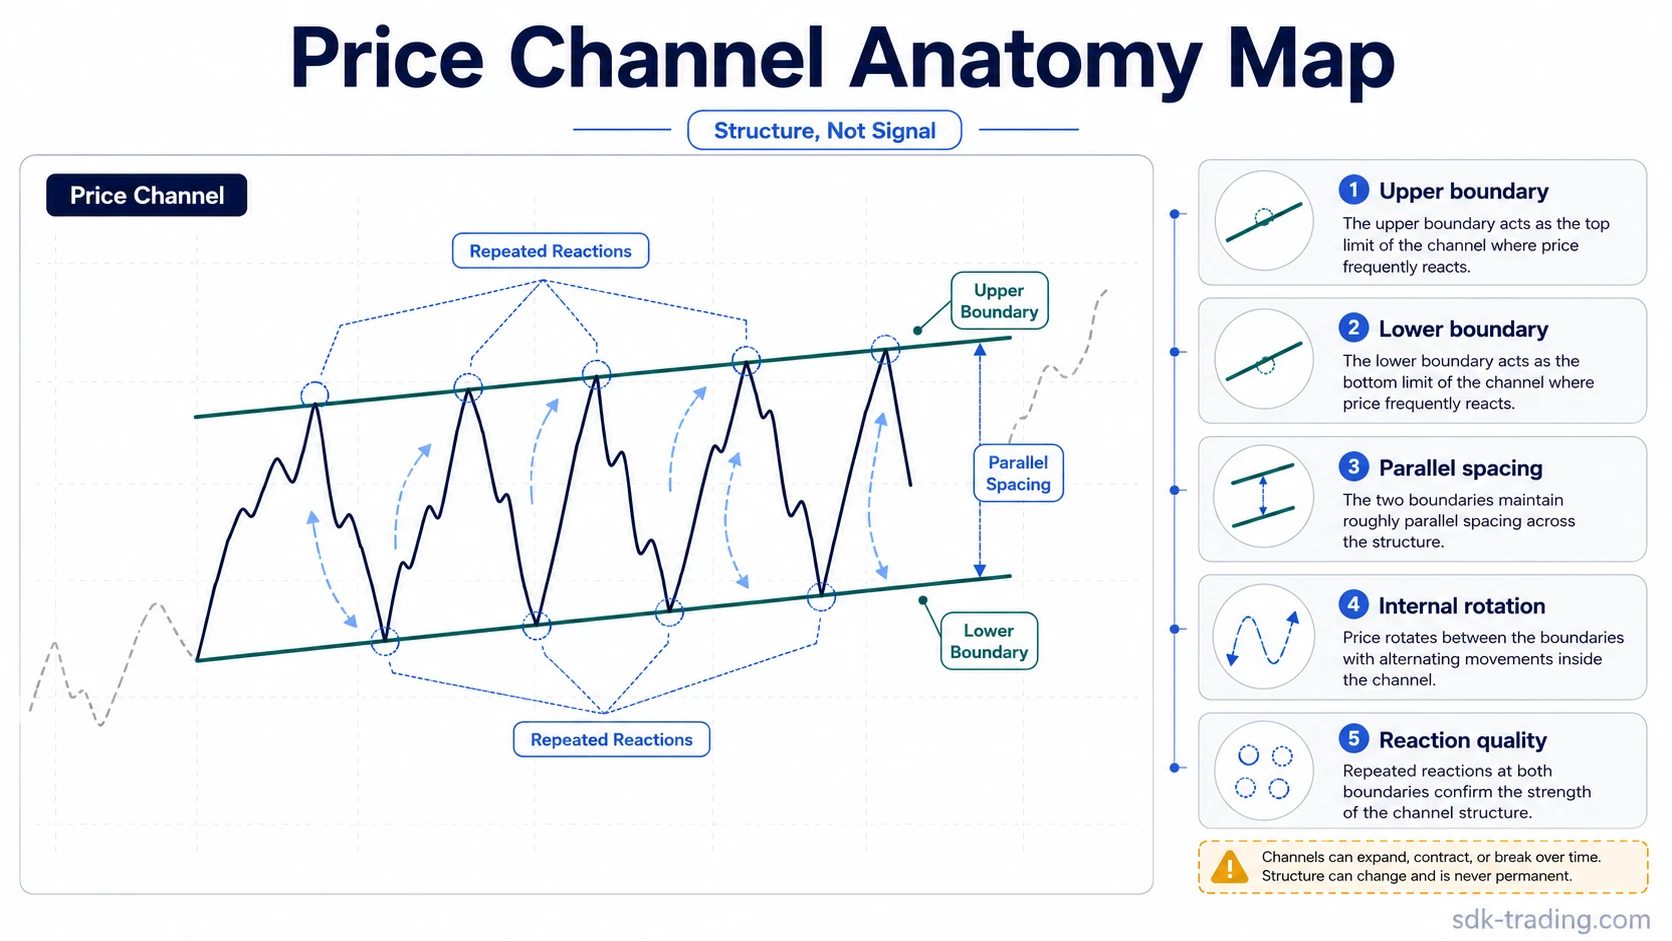
Price Channel Anatomy
A price channel usually starts with one side of the structure. In a rising channel, the lower boundary may be drawn through higher reaction lows before a parallel upper boundary is projected through reaction highs. In a falling channel, the upper boundary may be drawn through lower reaction highs before a parallel lower boundary is projected through reaction lows. In a sideways channel, both boundaries are closer to horizontal.
| Channel element | What to observe | Why it affects classification |
|---|---|---|
| Upper boundary | Repeated stalls, rejections, or pauses near the upper side | Shows whether advances are reacting to a similar upper area |
| Lower boundary | Repeated stalls, bounces, or pauses near the lower side | Shows whether declines are reacting to a similar lower area |
| Parallel spacing | Similar distance between the two boundaries over time | Separates a channel from a wedge, fan, or forced line pair |
| Internal rotation | Movement from one side of the channel toward the other | Shows whether price is rotating inside the structure rather than drifting randomly |
| Contact quality | Several meaningful reactions without constant boundary adjustment | Improves confidence that the structure is being observed rather than invented |
How to Identify a Price Channel
Channel classification starts with boundary geometry. A single trendline can describe direction, but a price channel needs two sides. The second line should be roughly parallel to the first and should make sense against visible swing behavior.
A practical identification sequence is to locate repeated swing reactions, check whether the opposite side can be drawn without forcing the chart, then look for rotation between the two sides. The reading improves when price reacts near both boundaries and the channel does not need to be redrawn after every new swing.
Identification check: A price channel is more defensible when it has at least two meaningful reactions on one side, a plausible parallel boundary on the other side, and enough internal movement to show rotation rather than a single directional line.
The weakest readings often appear when a trader starts with the desired channel shape and then adjusts lines around unrelated movement. If the boundaries only work after repeated redrawing, the structure is usually tentative or invalid rather than clean.
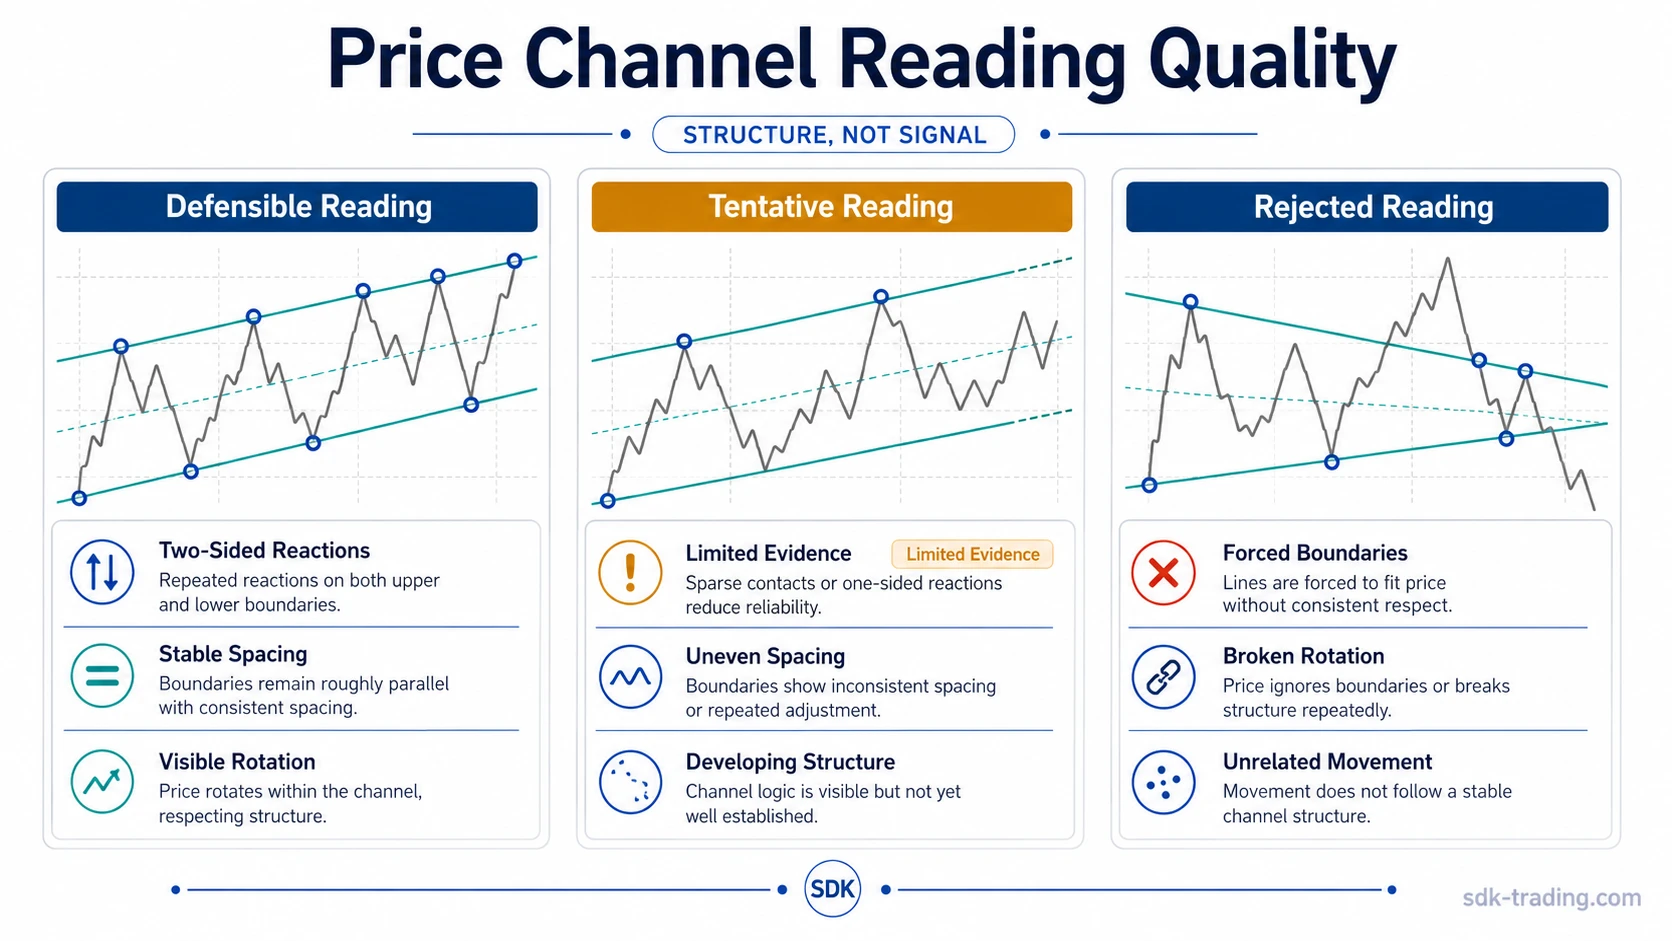
Clean, Tentative, and Invalid Price Channel Readings
Price channels are not all equal. The same general shape can be classified as clean, tentative, or invalid depending on reaction quality, spacing stability, and whether price continues to rotate inside the same structure.
| Reading quality | Observable criteria | Interpretation boundary |
|---|---|---|
| Clean | Repeated two-sided reactions, stable spacing, clear rotation, and no constant redrawing | The channel is defensible as a structural classification |
| Tentative | Sparse contacts, uneven spacing, one-sided reactions, or limited rotation | The structure may be forming, but the evidence is incomplete |
| Invalid | Converging lines, unrelated movement, broken rotation, or boundaries that must be repeatedly forced | The chart is better read through another structure or no channel at all |
This classification test gives the channel reading a quality filter. A clean channel does not predict the next move. It only means the structure is coherent enough to analyze as a channel.
Manual Price Channels vs Price Channel Indicators
A manually drawn price channel and a price channel indicator can look similar, but they are not the same tool. Manual channel classification uses visible swing behavior and boundary reactions. Indicator channels usually calculate upper and lower bands from a fixed period or formula.
| Type | How it is formed | Main limitation |
|---|---|---|
| Manual chart channel | Drawn from swing highs, swing lows, and roughly parallel boundaries | Requires judgment and can be forced if reaction quality is weak |
| Price channel indicator | Calculated from a period-based upper and lower range or band | May describe a formulaic range without matching the visible chart structure |
The distinction prevents a common misread. A period-based band can mark recent extremes, while a manual channel asks whether the market is actually rotating between two structural boundaries.
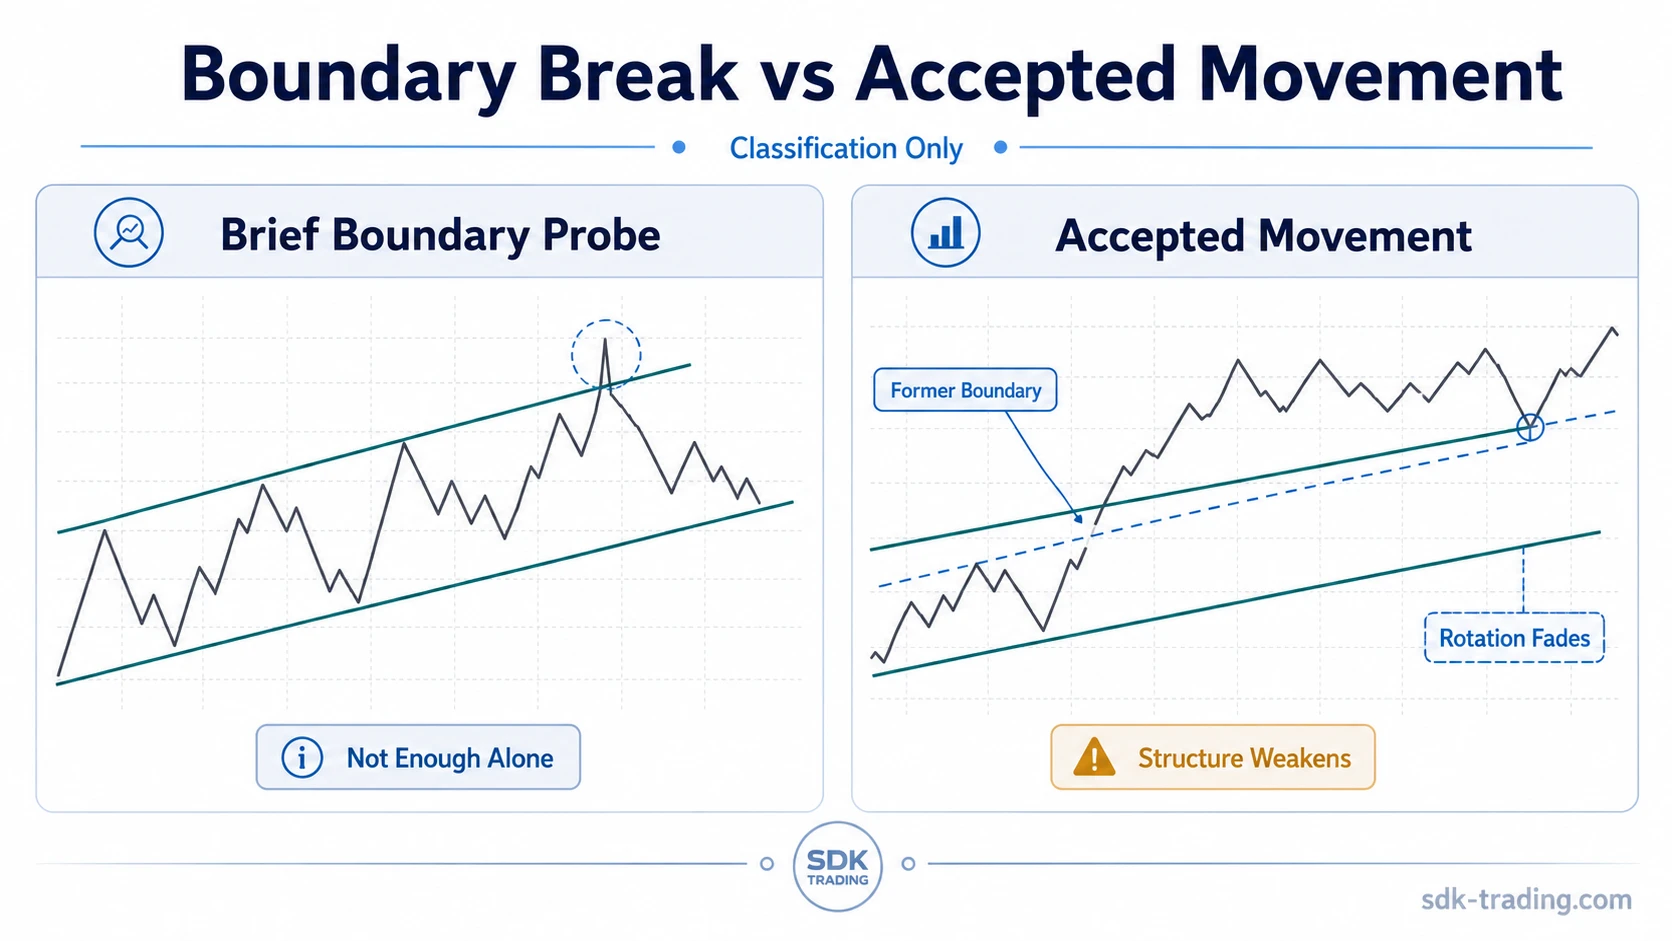
When a Price Channel Starts Losing Relevance
A channel can weaken before it fully disappears. One warning sign is failure to travel toward the opposite boundary after reacting from one side. Another is repeated pressure through the same boundary without a return to normal rotation.
A single wick or brief move outside the line is weaker evidence than repeated acceptance beyond the former boundary. The stronger change appears when price spends time outside the prior structure, retests the old boundary from the other side, or stops respecting the channel spacing that previously organized movement.
Limitation: A boundary break does not automatically classify the next move. The channel reading loses relevance when movement beyond the former boundary becomes accepted enough to change the structure.
Price Channel Example in Context
Price advances and reacts several times near a rising lower boundary, then stalls near a roughly parallel upper boundary. The structure looks clean while both sides receive meaningful reactions and the distance between boundaries stays stable.
The same chart becomes tentative if most reactions occur only near the lower side while the upper boundary is projected from one isolated high. It becomes invalid if later movement forces repeated boundary changes or if price accepts movement outside the former channel and no longer rotates between the same two areas.
The channel label is useful only while the same boundary structure remains visible without repeated line adjustments.
Related Channel Types
A price channel can slope upward, downward, or sideways. An ascending channel focuses on the rising version, where both boundaries generally move higher.
A descending channel focuses on the falling version, where both boundaries generally move lower.
A horizontal channel uses the same upper-lower boundary idea with less directional slope. The shared principle is repeated rotation between two boundaries; the slope changes the classification, not the need for reaction quality.
FAQ
What is a price channel in trading?
A price channel is a chart structure where price rotates between an upper and lower boundary. The channel is stronger when the boundaries are roughly parallel and price reacts near both sides more than once.
How many touches does a price channel need?
There is no fixed universal number, but a defensible channel needs meaningful reactions on both sides. A line pair based on one or two isolated points is usually tentative.
Is a price channel the same as a trendline?
No. A trendline describes one side of movement. A price channel uses two boundaries, so the analysis depends on both directional structure and rotation between the upper and lower sides.
Does a break outside a price channel confirm a breakout?
No. A brief move outside the boundary is only one observation. The channel reading weakens more when price accepts movement beyond the prior boundary and stops rotating inside the former structure.