A descending channel in trading is a technical-analysis structure where price moves between two downward-sloping, roughly parallel boundaries while forming lower highs and lower lows.
The upper boundary acts as descending resistance, the lower boundary acts as descending support, and the channel label describes the visible structure. It does not create a standalone trading signal.
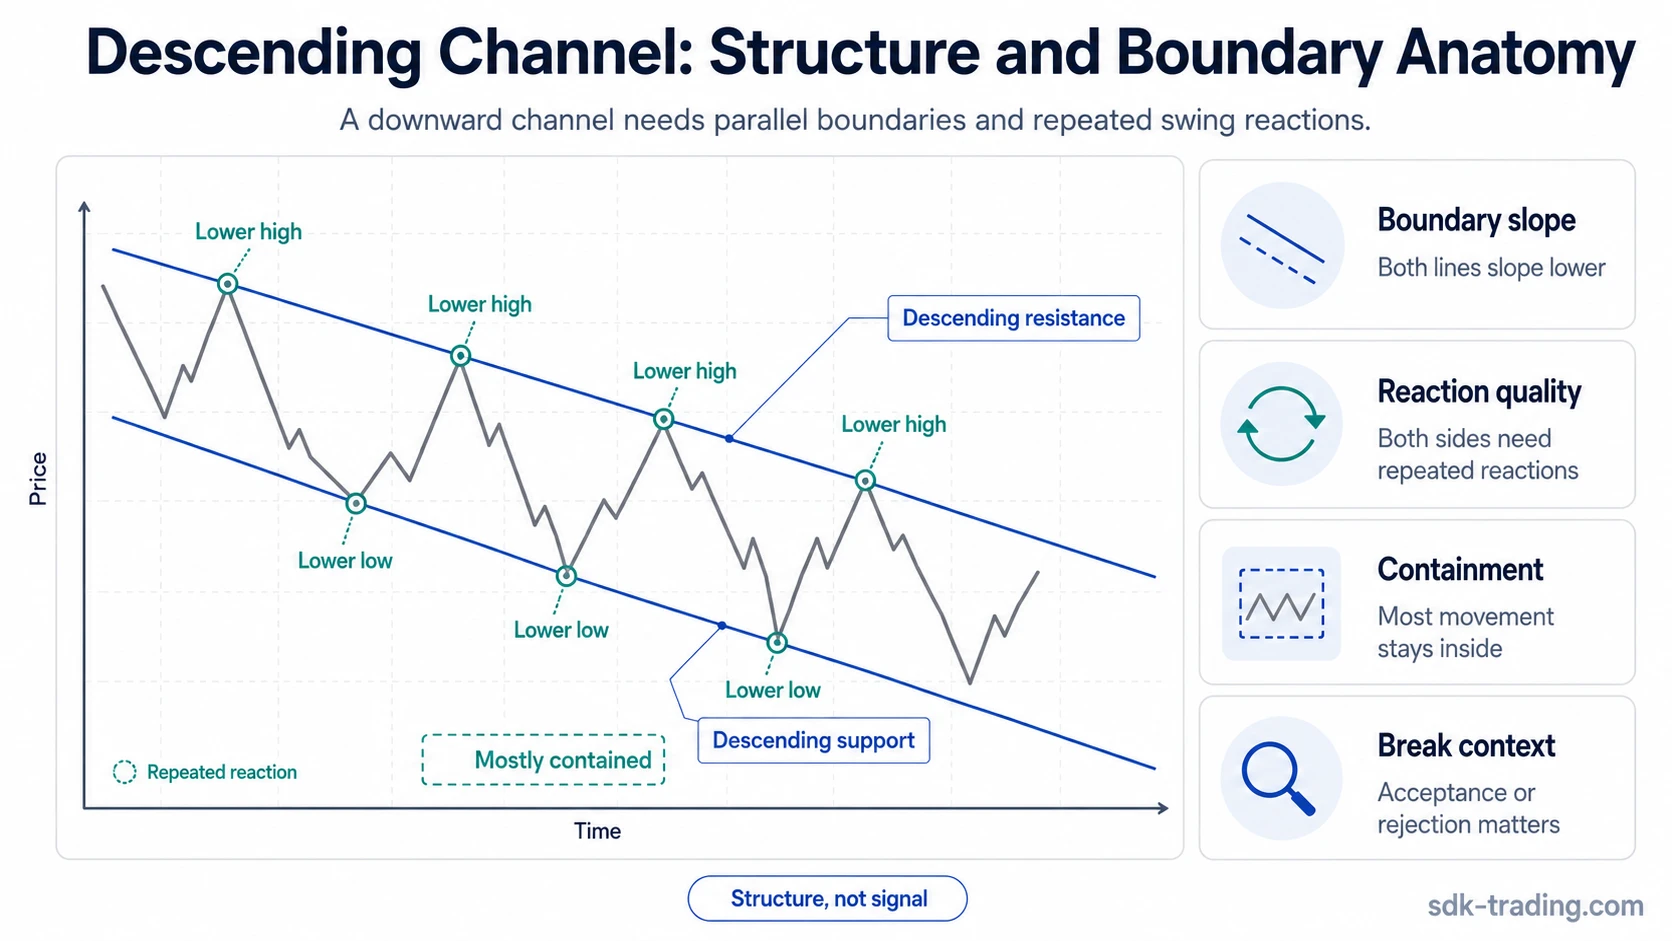
Definition: A descending channel is a downward-sloping price channel formed by repeated reactions between two mostly parallel trendlines. The structure is strongest when both boundaries are supported by multiple swing reactions and the swing sequence remains consistent.
Key Points
- A descending channel is identified by two downward-sloping, roughly parallel boundaries.
- The swing sequence usually contains lower highs and lower lows inside the channel.
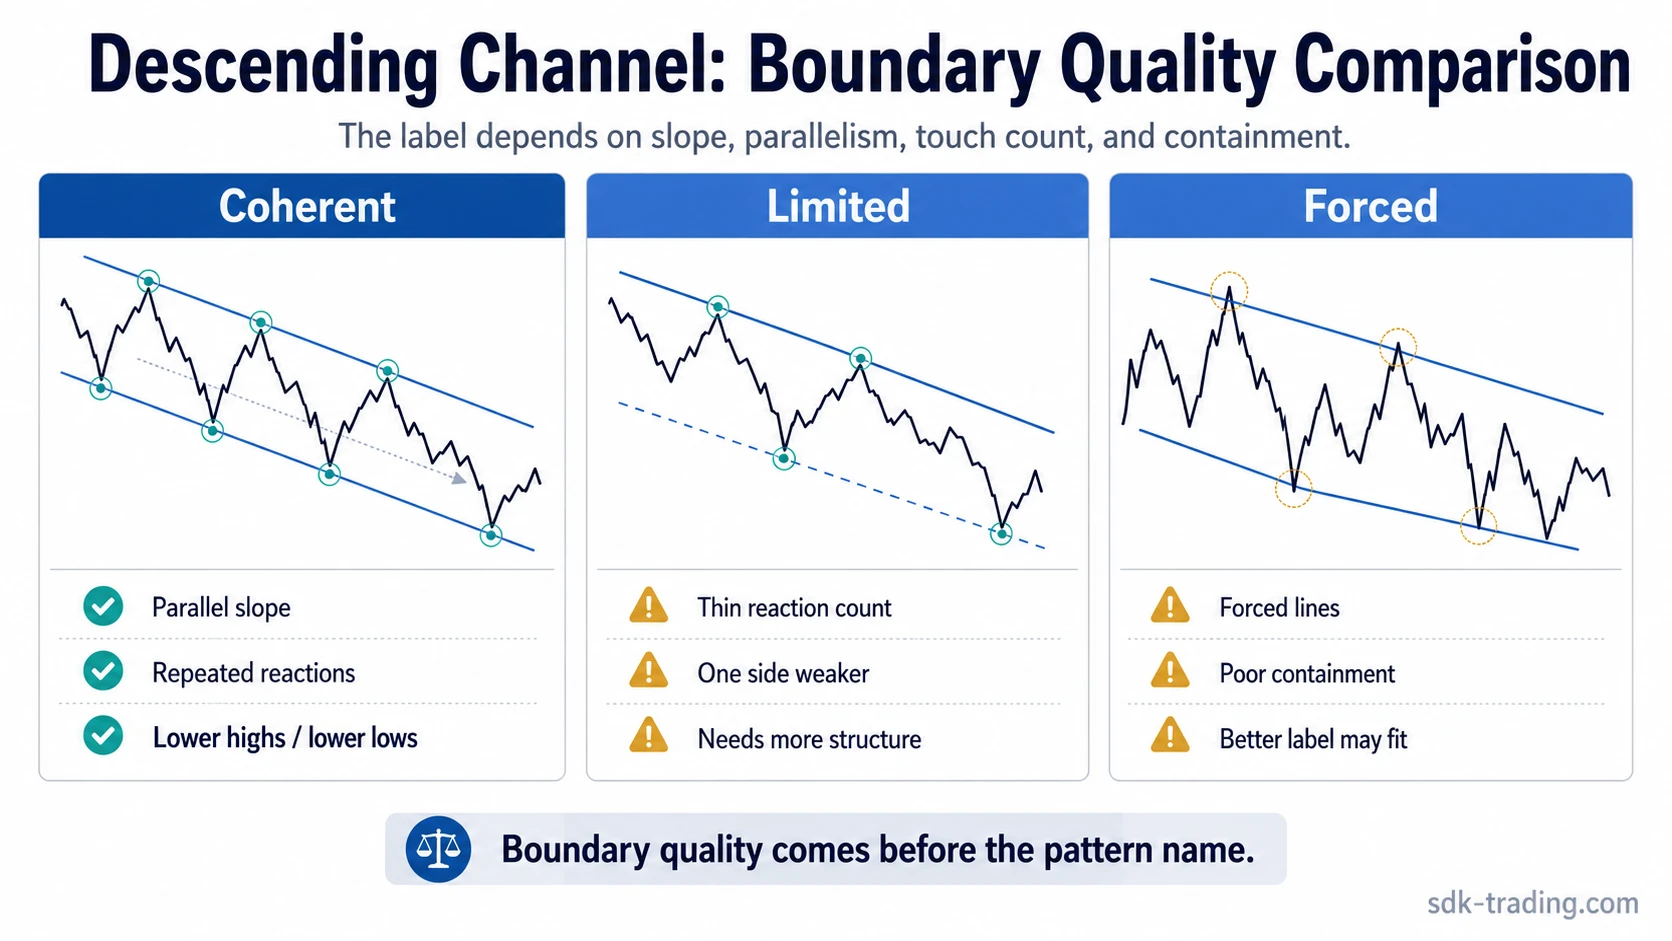
- Boundary quality matters more than visual resemblance alone.
- A break outside the channel needs acceptance or rejection context before the structure changes meaning.
- Forced lines, weak touch count, or non-parallel boundaries make the label less defensible.
What Is a Descending Channel?
A descending channel is a chart pattern that organizes a down-sloping price movement into two parallel boundaries. Price reacts near the upper boundary, returns toward the lower boundary, and repeats this behavior while the channel slopes lower.
Its specific feature is direction: both the resistance boundary and the support boundary slope downward. A clean channel can show that rallies are still being contained inside a downward structure, but it does not prove continuation, reversal, or a trade outcome.
How a Descending Channel Forms
A descending channel forms when each recovery attempt stalls below the prior recovery high while each decline reaches a lower area. Connecting the reaction highs creates the upper boundary. Connecting the reaction lows creates the lower boundary.
The two boundaries should move in the same downward direction and remain reasonably parallel. A channel with one clean trendline and one forced line is usually weaker than a channel with balanced reactions on both sides.
| Channel part | What it represents | What to check |
|---|---|---|
| Upper boundary | Descending resistance | Repeated failed recoveries near a similar downward slope |
| Lower boundary | Descending support | Repeated downside reactions near a parallel downward slope |
| Swing sequence | Lower highs and lower lows | Whether the price path supports the channel instead of forcing it |
| Channel width | Distance between boundaries | Whether the structure stays mostly parallel instead of expanding or contracting sharply |
How to Identify a Descending Channel
Start with structure, not with the pattern name. The channel label becomes more defensible when the visible swings, boundary reactions, and slope all support the same interpretation.
Identification checklist:
- Price is moving within a downward-sloping range.
- At least two reaction highs support the upper boundary.
- At least two reaction lows support the lower boundary.
- The two boundaries are reasonably parallel.
- The swing path shows lower highs and lower lows.
- Most price action stays inside the channel rather than ignoring the lines.
- Breaks outside the channel are judged by acceptance or rejection, not by the first wick alone.
A single descending trendline is not enough. Two random lows are not enough either. A valid reading needs both sides of the structure to participate.
Clean, Weak, or Invalid Descending Channel Readings
Boundary quality separates a useful descending channel reading from a forced pattern label. A chart can look organized at first glance, but touch count, slope, and containment decide whether the label holds up.
| Reading | What supports it | What it does not imply |
|---|---|---|
| Clean | Multiple lower highs and lower lows, coherent parallel boundaries, and repeated reactions near both sides of the channel | Guaranteed continuation or a confirmed directional outcome |
| Weak | Partial slope, limited reactions, unclear containment, or one boundary that is more convincing than the other | Automatic invalidation; more structure may be needed before the label is useful |
| Invalid | Forced lines, non-parallel boundaries, no consistent swing sequence, or price behavior that fits another structure better | A trade signal in the opposite direction |
Common mistake: drawing lines around price after the fact and calling the result a descending channel. The pattern label should follow observable structure, not force structure into a preferred label.
Descending Channel vs Related Channel Structures
A descending channel is one specific channel structure. It should not absorb every chart that slopes lower or every break of a trendline.
| Structure | Main difference | Why the distinction matters |
|---|---|---|
| Descending channel | Two downward-sloping, mostly parallel boundaries | Focuses on a controlled downward channel structure |
| Ascending channel | Two upward-sloping, mostly parallel boundaries | An ascending channel uses the opposite directional slope |
| Price channel | Broader family of parallel channel structures | A price channel can include upward, downward, or horizontal channel behavior |
| Falling wedge | Downward structure with converging boundaries | Boundary compression changes the pattern logic |
| Trendline breakout | A break of one line rather than the channel structure itself | Break behavior needs separate acceptance or rejection analysis |
What Weakens a Descending Channel Reading
A descending channel loses value when the chart no longer respects the structure that created the label. One brief move outside a line is less important than whether the channel still describes the actual behavior.
The label becomes less defensible when:
- Only one boundary has meaningful reactions.
- The lines are not close to parallel.
- The channel depends on one isolated high or low.
- Price repeatedly ignores one side of the structure.
- The swing sequence becomes sideways, expanding, or sharply compressed.
- A break outside the channel is accepted rather than rejected.
Volume can add context, especially around breaks or boundary reactions, but volume alone does not validate the channel. The structure still needs coherent swing behavior.
Breaks, Retests, and Failed Breaks
A break outside a descending channel can change the interpretation, but the first move beyond the line is not enough by itself. A wick above the upper boundary may be rejected quickly, while a close outside the channel followed by acceptance can show that the old structure is losing control.
A retest can clarify whether the broken boundary is being accepted or rejected. If price moves outside the channel and then returns back inside, the break may be only a failed break. If price holds outside the old boundary and stops reacting to the prior channel, the descending channel label becomes less useful.
The focus is structure quality only. No entry, exit, stop, target, or trade plan follows from the channel label alone.
Descending Channel Example Scenario
Price has been drifting lower for several swings. Each recovery stalls below the prior recovery high, and each decline reaches a lower area. When the reaction highs are connected, the upper line slopes downward. When the reaction lows are connected, the lower line also slopes downward at a similar angle.
The reading is cleaner if price reacts near both boundaries several times and remains mostly contained. A weaker version appears when the lower line depends on one sharp low, the upper line has only one meaningful reaction, or the two boundaries are not close to parallel.
If price briefly trades above the upper boundary but the next recovery attempt stalls near the old boundary instead of holding outside it, the break remains unresolved. If later candles hold outside the old boundary and stop respecting the prior channel, the original descending channel label becomes less useful.
FAQ
What does a descending channel mean in trading?
A descending channel means price is moving within a downward-sloping parallel structure. It describes the current chart structure, not a guaranteed future direction.
How do you identify a descending channel?
Look for two downward-sloping, roughly parallel boundaries supported by repeated reactions, plus a swing sequence that forms lower highs and lower lows.
Is a descending channel always bearish?
No. The structure slopes downward, but the label alone does not prove continuation. Later acceptance, rejection, and boundary behavior determine whether the original reading remains useful.
How is a descending channel different from a falling wedge?
A descending channel has roughly parallel boundaries. A falling wedge has converging boundaries, so the structure narrows instead of staying channel-like.