Triangle chart patterns are technical-analysis structures that form when price compresses between narrowing boundaries. The main types are ascending, descending, and symmetrical triangles, and each type depends on how resistance, support, reaction highs, and reaction lows shape the range.
The cleanest classification starts with the boundary: flat resistance, flat support, or two inward-sloping sides.
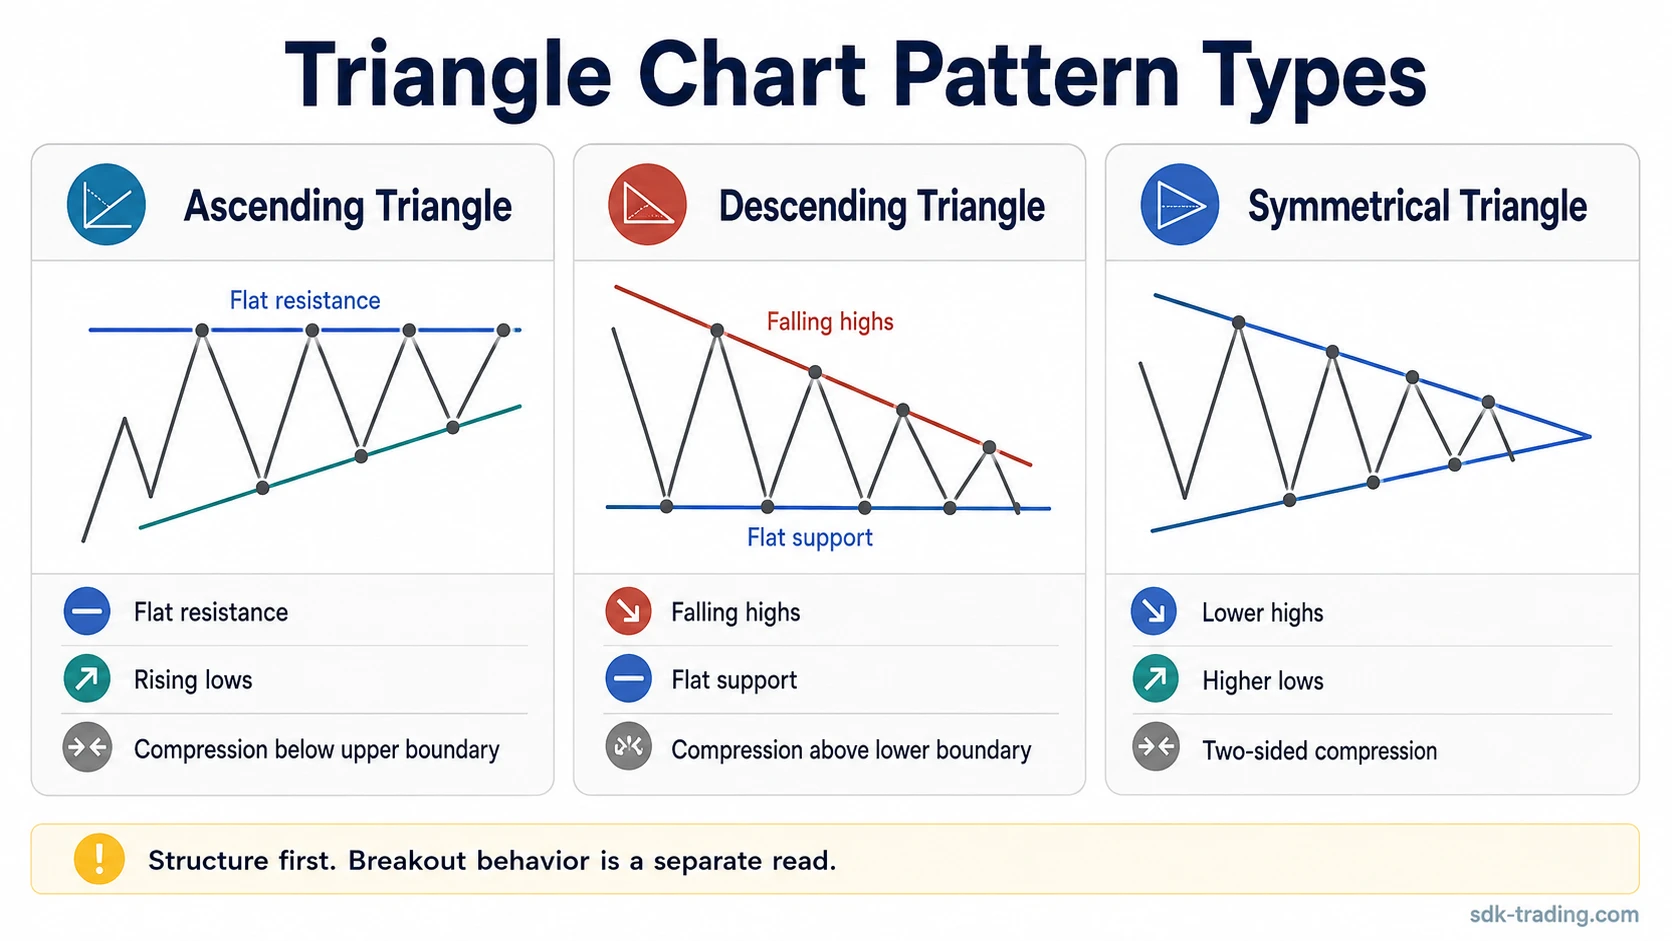
The useful first step is classification. A flat upper boundary with rising reaction lows points toward an ascending structure. A flat lower boundary with falling reaction highs points toward a descending structure. A narrowing range with both lower highs and higher lows belongs closer to a symmetrical structure. Breakout behavior comes after that structural read and should not be treated as the same question.
Definition: A triangle chart pattern is a technical-analysis structure where price movement narrows into a compressed range, usually between converging or partly converging boundaries. The pattern label describes the shape of that compression, not a guaranteed future move.
What Triangle Chart Patterns Mean in Trading
Triangle patterns describe compression. Price is still moving, but the distance between reaction highs and reaction lows becomes smaller. That contraction can show hesitation, balance, reduced directional range, or a market waiting for clearer acceptance beyond one side of the structure.
The pattern name matters because different triangle structures answer different chart-reading questions. An ascending triangle focuses on pressure against an upper area. A descending triangle focuses on pressure against a lower area. A symmetrical triangle focuses on two-sided compression where neither side has a clean flat boundary.
A triangle label becomes less useful when the boundaries are forced, the range is too wide and uneven, or price has already left the structure without later behavior clarifying acceptance or rejection. The structure should be readable before the label becomes useful.
Main Types of Triangle Chart Patterns
The three core triangle types are best separated by their boundaries, not by prediction. Each structure answers a different chart-reading question, so the classification should stay focused on the shape of compression.
| Triangle type | Typical structure | Use when the chart question is |
|---|---|---|
| Ascending triangle | Flat or repeated resistance area with rising reaction lows. | Whether compression is building below an upper boundary. |
| Descending triangle | Flat or repeated support area with falling reaction highs. | Whether compression is building above a lower boundary. |
| Symmetrical triangle | Lower highs and higher lows compress toward a narrowing apex. | Whether the range is contracting from both sides without a clear flat boundary. |
How to Choose the Right Triangle Pattern Explanation
Start with the boundary that is easiest to defend on the chart. A clean horizontal upper area changes the read. A clean horizontal lower area changes the read. When both sides are sloping inward, the structure usually needs a different classification.
| Chart observation | Closer classification | What still needs checking |
|---|---|---|
| Price repeatedly tests a similar upper area while reaction lows rise. | Ascending structure | Whether the upper area is actually flat enough to define the pattern. |
| Price repeatedly tests a similar lower area while reaction highs fall. | Descending structure | Whether the lower area is actually flat enough to define the pattern. |
| Reaction highs fall and reaction lows rise at the same time. | Symmetrical structure | Whether both boundaries are readable and the range is truly compressing. |
| Price leaves the range, then quickly returns inside it. | Breakout behavior question | Whether the move showed acceptance beyond the boundary or failed follow-through. |
Classification example: Price compresses below a repeated resistance area while reaction lows become progressively higher. That chart belongs closer to ascending-triangle classification. If the same range has both falling reaction highs and rising reaction lows, the better comparison is usually symmetrical compression. If the main uncertainty is what happened after price moved outside the boundary, the next read is acceptance, rejection, or failed follow-through rather than triangle type alone.
Triangle Structure vs Triangle Breakout Behavior
Triangle structure and breakout behavior are separate reads. Structure asks what kind of compression has formed. Breakout behavior asks whether price accepted a move beyond the boundary, rejected back into the range, or failed to create follow-through.
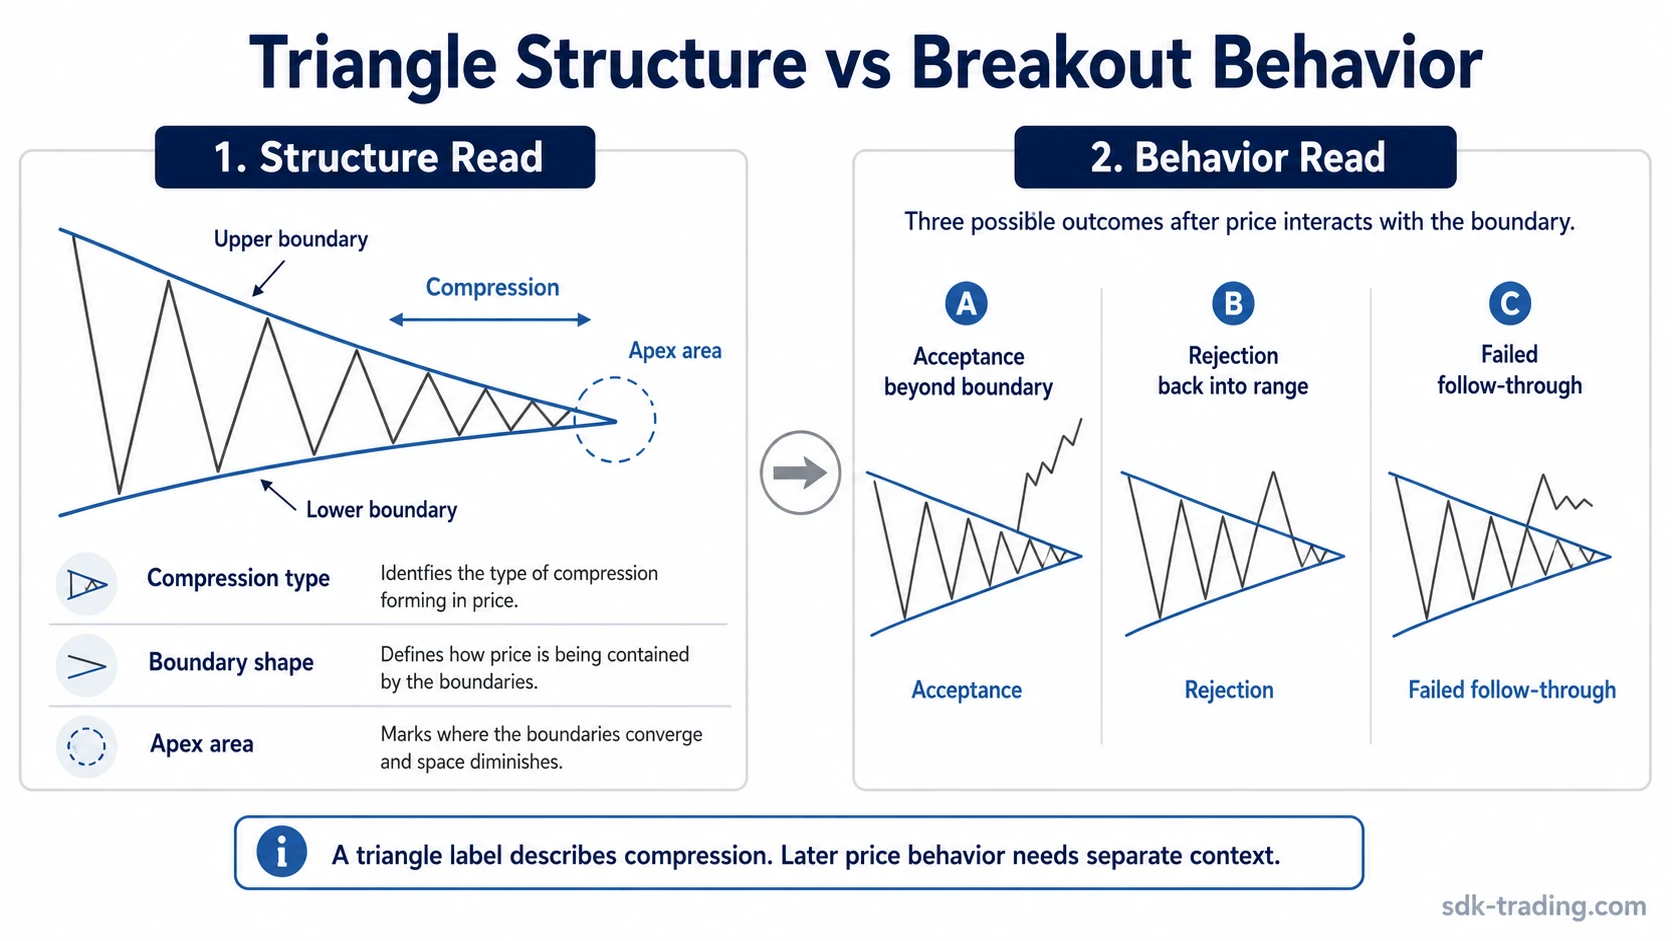
When the main issue is the move outside the boundary, triangle breakout behavior provides the cleaner context. That distinction prevents the triangle label from becoming a prediction by itself.
If the boundaries, apex, and compression mechanics are still unclear, general triangle pattern mechanics help clarify the structure before a specific type is assigned.
Common Mistakes When Reading Triangle Patterns
Forcing the label too early: A narrowing range is not automatically a clean triangle. The boundaries need to be readable enough to support the classification.
Treating the structure as a signal: The triangle shape describes compression. It does not prove direction, timing, or trade quality.
Ignoring failed acceptance: A move outside the range can weaken if price rejects back into the prior structure instead of holding beyond the boundary.
Confusing similar compression shapes: Some upward-compression structures look related at first glance. The distinction between an ascending triangle and a rising wedge depends on how the boundaries behave, not only on the fact that price is narrowing.
Related Triangle Pattern Topics
Directional triangle structures can look similar until the flat boundary is identified. A focused comparison of ascending and descending triangle structures helps separate pressure below resistance from pressure above support.
When upward compression is the confusing part, ascending triangle vs rising wedge is the sharper distinction because both can involve rising lows while the boundary logic differs.
FAQ
What are the main triangle chart patterns?
The main triangle chart patterns are ascending triangle, descending triangle, and symmetrical triangle. They differ by whether the range has flat resistance, flat support, or two sloping boundaries compressing toward an apex.
Is a triangle chart pattern the same as a breakout?
No. A triangle chart pattern describes the structure of compression. A breakout describes price behavior after price moves beyond one side of that structure.
When is a narrowing range not enough to call a triangle?
A narrowing range is not enough when the boundaries are unclear, the swings do not compress cleanly, or price has already left the range without later behavior showing whether the move was accepted or rejected.