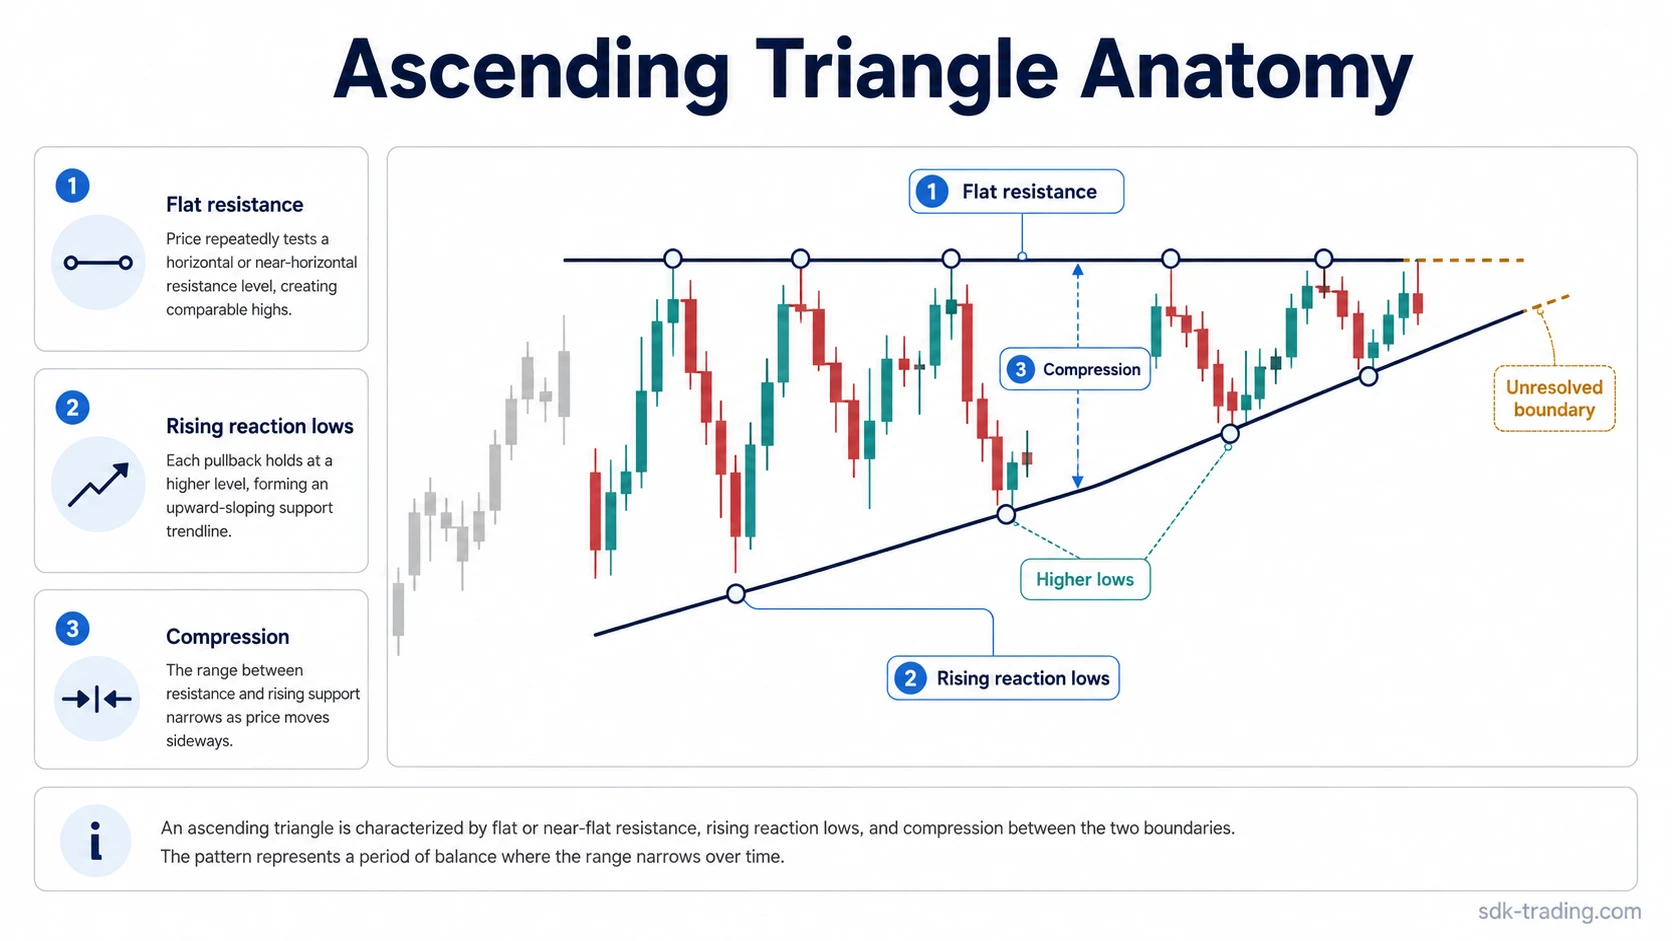
An ascending triangle is a triangle chart pattern formed by flat or near-flat resistance above price and rising reaction lows below it. The structure shows compression: buyers are stepping in at higher levels while sellers continue to defend a similar upper area.
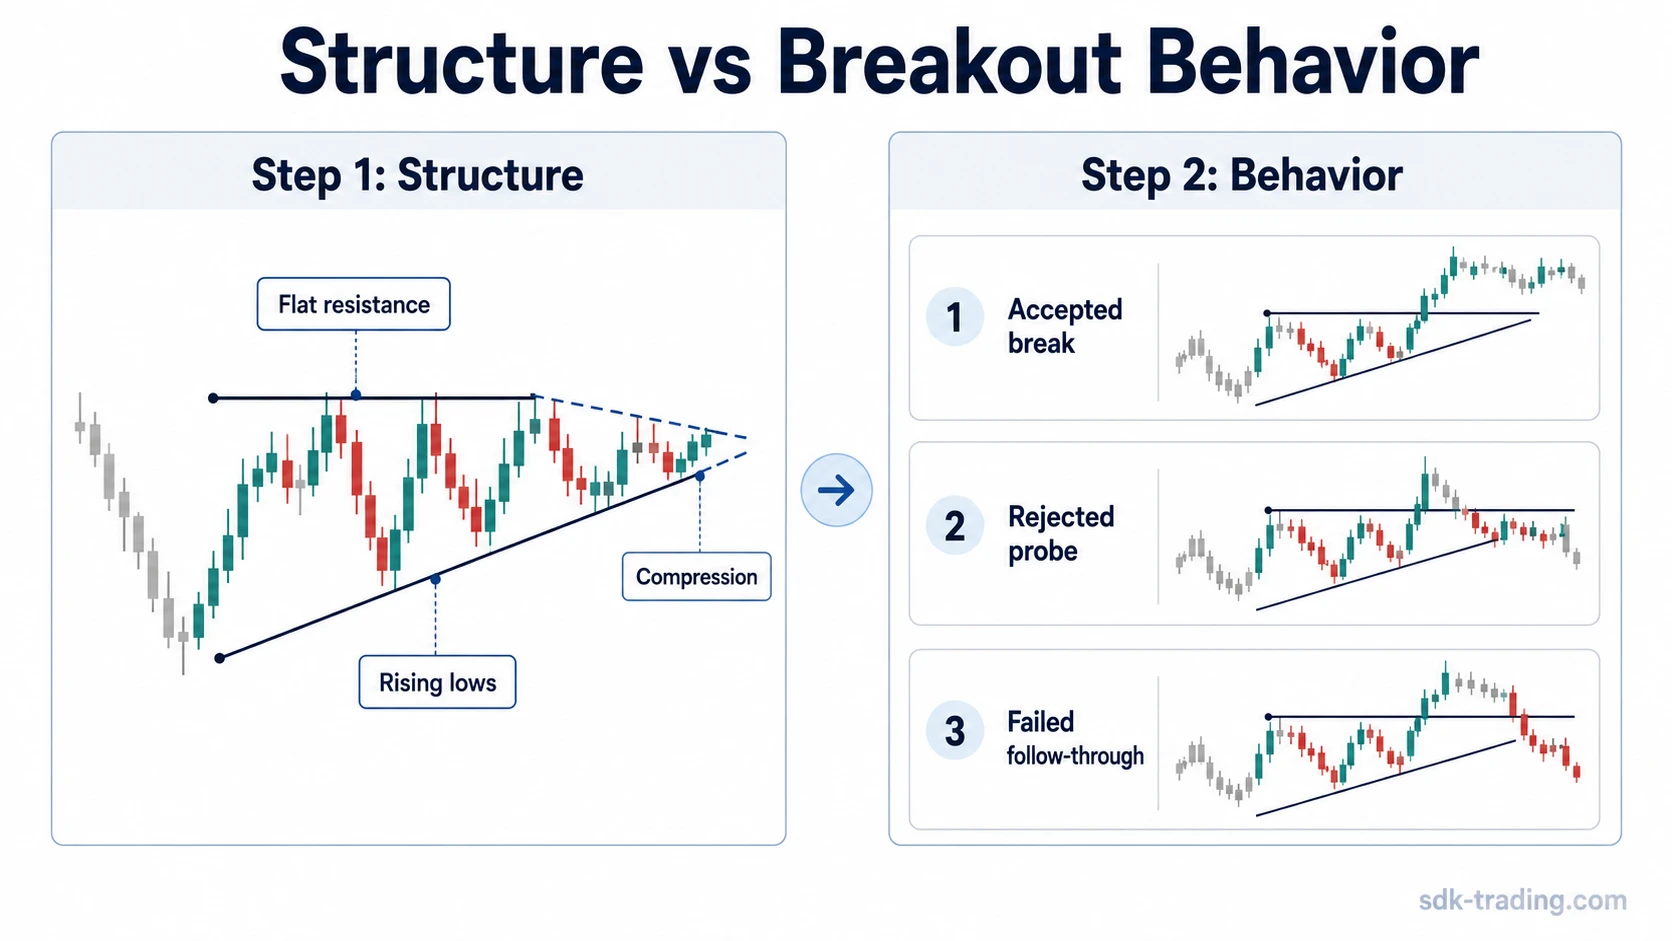
The pattern is often treated as a bullish or continuation structure, but the label alone does not prove continuation. The first job is to identify the structure. Breakout behavior comes later, when price either accepts above resistance, rejects back into the range, or fails to create follow-through.
Definition: An ascending triangle pattern forms when price repeatedly tests a similar resistance area while each reaction low forms higher than the prior one, creating a narrowing range that slopes upward from below.
Key Points
- An ascending triangle combines flat or near-flat resistance with rising reaction lows.
- The pattern belongs to the triangle chart pattern family, but its boundary shape is specific.
- Compression matters more than a perfectly drawn geometric triangle.
- A brief move above resistance is not the same as accepted breakout behavior.
- The reading weakens if price falls through the rising-lows structure or rebuilds inside the range after a break.
Ascending Triangle Classification Snapshot
| Reading Layer | Ascending Triangle Requirement | What It Does Not Prove |
|---|---|---|
| Structure | Flat or near-flat resistance with rising reaction lows | It does not prove continuation by itself |
| Behavior | Price later accepts above resistance, rejects, or fails to follow through | A wick above resistance is not acceptance |
| Boundary failure | The rising-low sequence breaks or the range rebuilds inside the structure | The original triangle label should not be forced |
What Is an Ascending Triangle?
An ascending triangle is a technical analysis pattern built around two boundaries: a horizontal or slightly uneven upper boundary and an upward-sloping lower boundary. The upper boundary marks the area where price repeatedly stalls. The lower boundary marks higher reaction lows that show the range compressing from below.
The structure is different from a general range because the lower reactions do not stay flat. They rise toward resistance. That rising pressure is the reason the pattern is commonly discussed as bullish, although the final interpretation still depends on later behavior around the boundary.
triangle patterns explained separates the broader triangle family by boundary shape, compression type, and how each structure behaves before a break or failure.
Ascending Triangle Structure
The basic structure has three parts: repeated resistance, rising reaction lows, and a narrowing range between them. The upper boundary does not need to be mathematically perfect. In real charts, highs may overshoot or undershoot the level slightly, but they should still form a comparable resistance area.
| Component | What to Look For | Why It Matters |
|---|---|---|
| Upper boundary | Several reactions near the same resistance area | Defines the level price has not yet accepted above |
| Lower boundary | Reaction lows that form at progressively higher levels | Shows compression from below rather than a flat range |
| Range compression | Price swings become more confined between the two boundaries | Separates a developing triangle from loose, unstructured noise |
| Boundary interaction | Price tests resistance without immediately accepting above it | Keeps the pattern unresolved until later behavior confirms or weakens the reading |
The pattern is not defined by a breakout. It is defined by the boundary relationship before the breakout attempt. A later break may resolve the structure, but it should not be used to rewrite weak or incomplete structure into a clean triangle.
How an Ascending Triangle Forms
An ascending triangle forms when sellers repeatedly defend an upper area while buyers respond at higher and higher lows. The result is a tightening structure. Each reaction low reduces the amount of space between support pressure from below and resistance from above.
This compression can appear during an existing advance, during a pause after a sharp move, or during a broader consolidation. The common feature is not the prior trend by itself. The common feature is the pressure pattern: similar highs above price and rising reactions below price.
Volume may contract as the range narrows, and some breakouts occur with expanding volume. That behavior can add context, but it is not a fixed requirement. Volume can be uneven, especially around news, low-liquidity periods, or volatile markets. Price structure and acceptance still carry the main diagnostic weight.
How to Identify an Ascending Triangle
Good identification starts with the boundary shape, not with the desired breakout direction. A clean ascending triangle usually has at least two comparable highs near resistance and at least two rising reaction lows. More touches can make the structure easier to see, but more touches do not automatically make the pattern stronger.
Chart pattern identification is stronger when the boundary, reaction points, and failure conditions are visible before interpretation is attached to the label.
| Identification Check | Cleaner Reading | Weaker Reading |
|---|---|---|
| Resistance area | Several highs stall near a similar upper boundary | Highs are scattered, far apart, or only loosely related |
| Reaction lows | Lows rise in a visible sequence | Lows flatten, overlap heavily, or break the rising structure |
| Compression | The range narrows as price moves toward the apex | The pattern remains wide, erratic, or expands instead of compressing |
| Boundary quality | Minor overshoots still respect the same resistance area | Repeated breaks above resistance fail to hold and make the boundary unclear |
| Volume context | Volume supports the reading without being the only reason for it | Volume is used to justify a structure that price has not formed |
Ascending Triangle Breakout Behavior
Breakout behavior is a later test of the pattern, not the definition of the pattern. A move through resistance can mean different things depending on whether price accepts beyond the boundary, quickly rejects back into the range, or stalls without follow-through.
| Behavior After Resistance Is Tested | Interpretation | Risk in the Reading |
|---|---|---|
| Acceptance above resistance | Price holds beyond the upper boundary and does not immediately rebuild inside the old range | The reading can still fail if follow-through fades and the breakout area is lost |
| Rejection back into the range | Price trades above resistance but closes or returns below it quickly | A wick through resistance may only show a failed probe |
| Failed follow-through | Price breaks the boundary but cannot continue or hold the new area | The structure may remain unresolved or turn into a false-break reading |
| Break of rising lows | Price loses the lower boundary that created the ascending structure | The original triangle reading weakens or becomes invalid |
A wick above resistance alone is not enough to prove acceptance. The stronger distinction is between structure and behavior: the triangle describes compression before the break, while later candles determine whether the boundary was actually accepted or rejected.
When the Pattern Becomes Weak or Invalid
An ascending triangle becomes less useful when the price action no longer supports the boundary logic. Weakness does not always mean immediate reversal. It means the structure no longer deserves the same label without qualification.
| Diagnostic Area | Stronger Reading | Weak or Invalid Reading |
|---|---|---|
| What it is | Flat or near-flat resistance with rising reaction lows | A random flat top without a clear rising-low sequence |
| What it is not | A compression pattern waiting for resolution | A guaranteed bullish continuation pattern |
| What strengthens the reading | Clean resistance, higher lows, narrowing range, and accepted behavior beyond the boundary | Messy highs, broken lows, wide swings, or repeated rejection after break attempts |
| What weakens it | Minor boundary imperfections that still preserve the structure | Price rebuilds inside the range after a break or loses the rising-lows structure |
| What invalidates it | The pattern remains intact while the lower boundary holds | The rising-low sequence fails and price no longer compresses toward resistance |
The most common invalidation problem is forcing the label after the lower boundary has already failed. Once price no longer forms rising reaction lows, the pattern may become a range, a failed breakout structure, or a different chart pattern entirely.
Is an Ascending Triangle Bullish or Bearish?
An ascending triangle is usually treated as bullish because rising lows show buyers becoming more active at higher prices while resistance remains fixed above the market. In an existing uptrend, that can support a continuation reading.
The bullish reading is conditional. If price cannot hold above resistance, or if the rising lows break before acceptance develops, the pattern can fail. A downside break through the rising lower boundary changes the structure and can shift the reading from compression to failure.
The safer interpretation is to separate bias from confirmation. The structure may lean bullish, but the market still has to show whether the upper boundary is accepted or rejected.
Ascending Triangle vs Related Patterns
Ascending triangles are often confused with other compression patterns because several patterns narrow before resolution. The distinction comes from boundary shape.
| Pattern | Boundary Shape | Main Distinction |
|---|---|---|
| Ascending triangle | Flat or near-flat resistance with rising lows | Compression pushes upward into a similar resistance area |
| descending triangle | Flat or near-flat support with falling highs | Compression pushes downward into a similar support area |
| symmetrical triangle | Lower highs and higher lows | Both boundaries slope inward, creating balanced compression |
| Rising wedge | Both boundaries usually slope upward | The whole structure rises, rather than pressing into a mostly flat upper boundary |
The rising wedge distinction is especially important. A structure with both support and resistance sloping upward is not the same as an ascending triangle with a flat upper boundary. Boundary shape should decide the label before any directional interpretation is added.
Common Ascending Triangle Mistakes
A frequent mistake is calling every flat top an ascending triangle. The flat top is only one part of the structure. Without rising reaction lows, the pattern is closer to a range or repeated resistance test.
Common misread: Price briefly trades above resistance, leaves a wick, and returns into the range. That does not prove acceptance. It may be a failed probe unless price later holds above the boundary and prevents the old range from rebuilding.
Another mistake is treating volume as proof. Contracting volume during formation or expanding volume near a break can support the interpretation, but volume does not fix broken structure. If the rising lows fail, strong volume on an isolated candle does not preserve the ascending triangle label.
A third mistake is turning structural projections into certainty. Some charting approaches estimate possible movement from the pattern height, but that measurement does not make the pattern reliable, tradable, or complete by itself.
Simple Ascending Triangle Example
Price advances into a prior resistance area and stalls several times near the same upper boundary. Each pullback holds above the prior reaction low, so the lower boundary slopes upward. The range narrows as price moves toward resistance.
If price later holds above the resistance area and avoids rebuilding the old range, the breakout behavior supports the structure. If the move above resistance leaves only a brief wick, returns inside the triangle, and the next recovery attempt stalls below the same area, the breakout attempt remains suspect.
If the rising lows break before price accepts above resistance, the original structure is no longer clean. The market may still form another pattern, but the ascending triangle label needs to be reconsidered.
Ascending Triangle Reading Checklist
A cleaner ascending triangle reading usually answers four questions before interpretation becomes useful.
| Question | Cleaner Answer | Warning Sign |
|---|---|---|
| Is resistance comparable? | Highs react near the same upper area | The supposed resistance level keeps shifting |
| Are lows rising? | Each reaction low generally forms higher than the previous one | The lower boundary flattens or breaks |
| Is the range compressing? | Price has less room between the two boundaries | Swings widen or become erratic |
| Has resistance been accepted? | Price holds beyond the boundary instead of immediately returning inside | The break becomes a wick, rejection, or failed follow-through |
FAQ
What is an ascending triangle?
An ascending triangle is a chart pattern with flat or near-flat resistance and rising reaction lows. The structure shows price compressing upward into an upper boundary.
Is an ascending triangle bullish or bearish?
An ascending triangle is usually treated as bullish or continuation-oriented, but that reading is conditional. It weakens if price fails to hold above resistance or breaks the rising-lows structure.
How do you draw an ascending triangle?
Draw the upper boundary across comparable highs near resistance, then draw the lower boundary through rising reaction lows. The two boundaries should create a narrowing range.
What invalidates an ascending triangle?
An ascending triangle becomes invalid or ambiguous when the rising reaction lows fail, the range no longer compresses, or price repeatedly returns inside the structure after breakout attempts.
Can an ascending triangle have false breakouts?
Yes. A false breakout can occur when price trades above resistance but quickly rejects back into the old range or fails to hold beyond the boundary.
How is an ascending triangle different from a symmetrical triangle?
An ascending triangle has a flat or near-flat upper boundary and rising lows. A symmetrical triangle has both boundaries sloping inward, with lower highs and higher lows.