A descending triangle pattern is a technical analysis structure formed by flat or near-flat support and a series of lower reaction highs. The pattern shows price compressing above a support area as each rally reaches a lower point than the previous one.
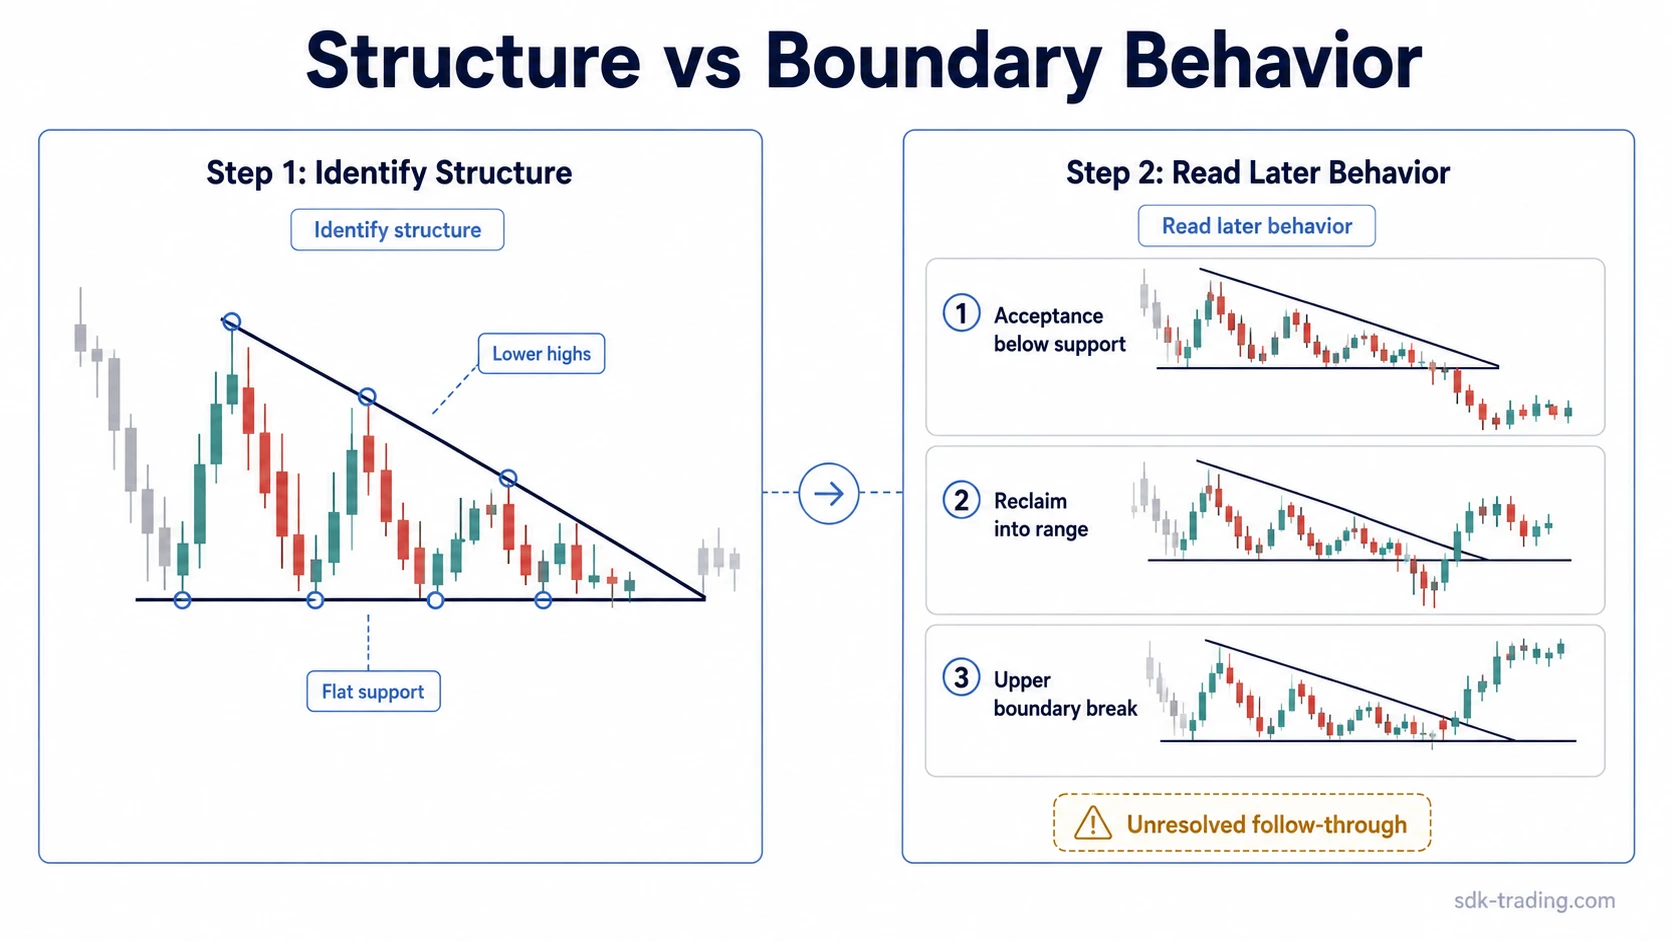
The structure should be read first as compression between a defended support area and rallies that keep losing reach. A later break, reclaim, rejection, or failed follow-through changes the interpretation only after price behavior around the support boundary becomes clearer.
Definition: A descending triangle is a chart pattern with a horizontal or near-horizontal support boundary below price and a declining upper boundary created by lower reaction highs.
Key Points
- A descending triangle pattern is defined by flat or near-flat support and descending reaction highs.
- The structure reflects compression as rallies weaken while support continues to be tested.
- The pattern often has bearish or continuation associations, but the shape alone does not predict the outcome.
- Breakout behavior should be read separately from structure: acceptance, rejection, reclaim, and follow-through all matter.
- False breaks, drifting support, and late-apex compression can weaken the pattern reading.
What Is a Descending Triangle Pattern?
A descending triangle pattern is a chart-pattern structure where sellers appear to press rallies lower while buyers continue defending a similar support area. The visible result is a narrowing range: a flat lower boundary and a downward-sloping upper boundary.
The pattern belongs to triangle chart patterns because price action compresses between two converging boundaries. Its defining feature is not simply a lower-high sequence. The lower highs must interact with a reasonably consistent support area so the range narrows toward an apex.
The bearish association comes from the pressure against support. If support keeps absorbing tests while rallies fade earlier, the market can look vulnerable to a downside resolution. That reading remains conditional, because price can also reject the lower break, reclaim the range, or break upward through the descending upper boundary.
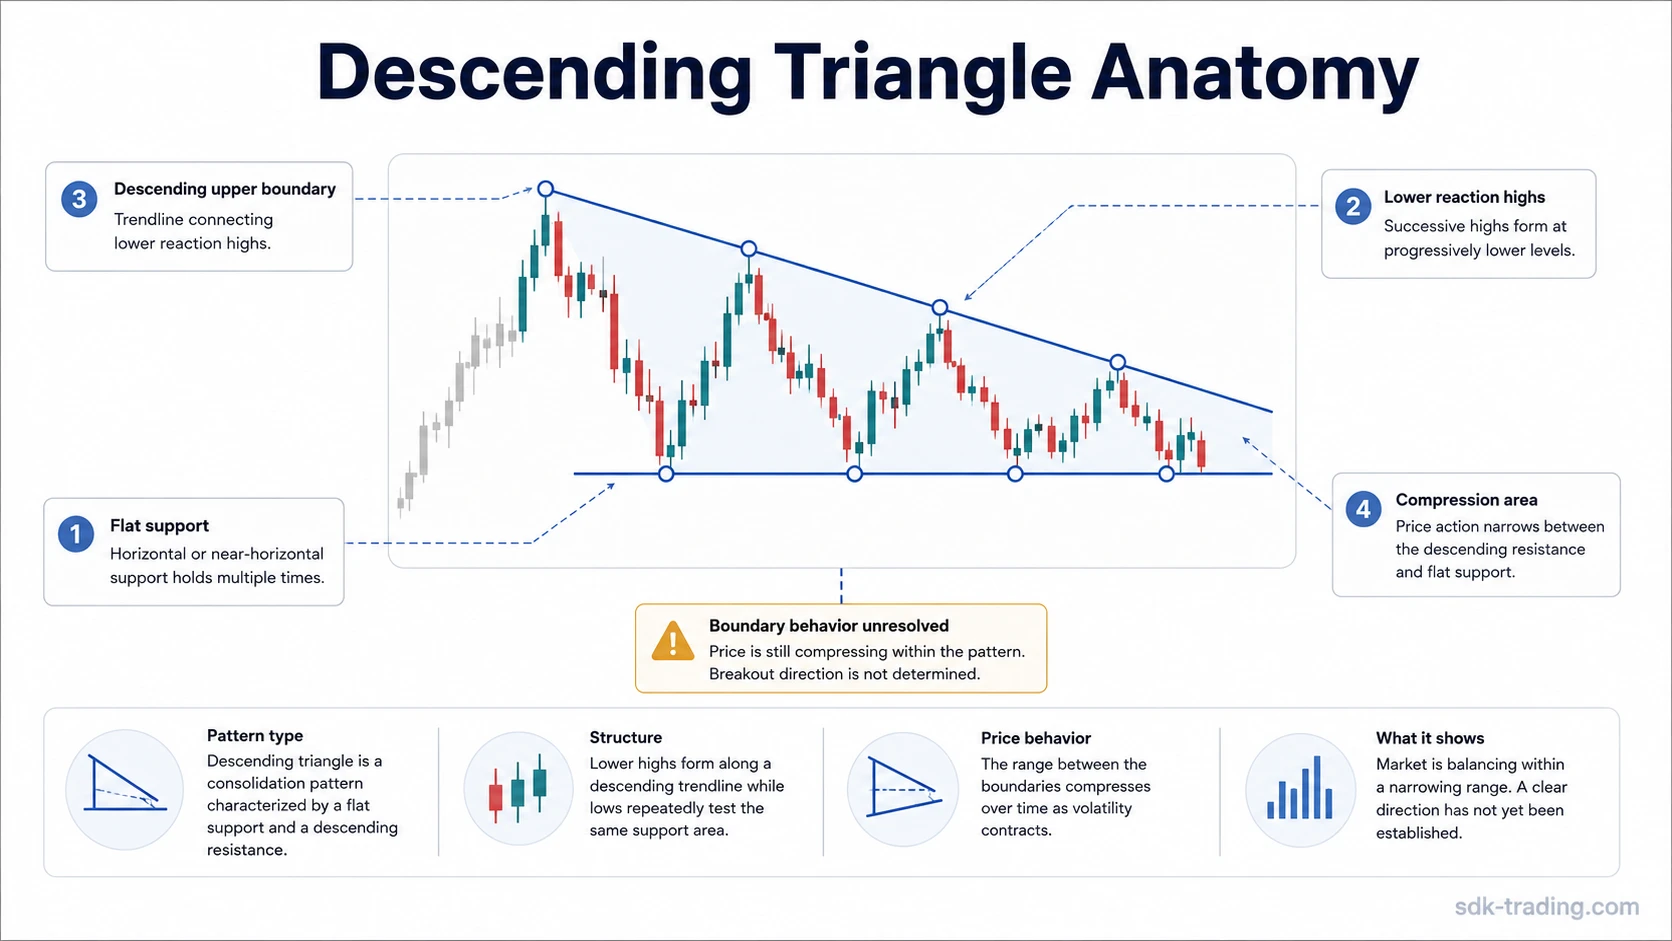
Descending Triangle Anatomy
The anatomy of a descending triangle is built from relationships between boundaries, not from one isolated swing. The support line, lower reaction highs, upper trendline, compression area, and later boundary behavior all have to work together.
| Component | What to observe | Why it matters |
|---|---|---|
| Support boundary | Price repeatedly reacts near the same lower area. | A stable support boundary gives the pattern its horizontal base. |
| Lower reaction highs | Each rally stalls below the prior rally high. | Declining rally reach creates the descending upper side of the triangle. |
| Upper trendline | A downward-sloping line can be drawn across the lower highs. | The line helps show whether compression is orderly or forced. |
| Compression area | The distance between support and the upper boundary narrows. | Volatility compression is the structural center of the pattern. |
| Apex drift | Price moves closer to the point where the two boundaries would meet. | Late-apex movement can reduce pattern quality if the range becomes too flat, thin, or indecisive rather than showing active compression. |
| Volume behavior | Volume may contract during formation and expand during resolution. | Volume can support the reading, but it does not prove the pattern by itself. |
| Resolution behavior | Price either accepts beyond a boundary, rejects, or returns into the range. | Later behavior separates the structure from the eventual interpretation. |
A clean structure has visible pressure from above and repeated interaction with the same lower area. If the support line drifts downward with every test, the pattern may be a falling range rather than a valid descending triangle.
How to Identify a Descending Triangle
Identifying a descending triangle starts with the support boundary. The lower boundary should be flat or close enough to flat that the market is repeatedly testing the same area. A perfectly horizontal line is not required, but a visibly sliding support base weakens the classification.
The second requirement is a lower-high sequence. Rallies should lose reach as the structure develops, creating a descending upper boundary. If the highs are random or only slightly lower by chance, the pattern becomes less reliable as a classification.
Identification sequence: Find the support area first, then check whether rallies are consistently failing at lower levels, then judge whether the range is narrowing in a way that creates real compression rather than random sideways movement.
- Support is tested more than once near a similar price area.
- Reaction highs step lower in a visible sequence.
- The upper boundary slopes downward toward the support boundary.
- The range narrows enough to show compression.
- The structure has enough symmetry quality to be recognizable without forcing the lines.
- Volume, if used, supports the reading rather than replacing structural evidence.
A common false positive appears when price makes several lower highs above a broad, messy area. That can be compression, but it remains only a descending triangle candidate until the support boundary and upper trendline are clear enough to separate pattern structure from ordinary range movement.
What the Pattern Can Indicate
A descending triangle often indicates pressure building against support. Sellers or supply-side pressure are able to stop rallies at lower points, while buyers continue defending a similar lower area. That combination can show weakening upside response inside the range.
The pattern is often described as bearish, especially when it forms after a decline or as a continuation structure. A more precise reading separates stable support tests from lower acceptance. If price presses below support but quickly returns into the range, the downside interpretation weakens because the market has not held below the boundary.
An upward resolution can still occur if sellers fail to keep rallies contained below the descending upper boundary. The important separation is structure first, then boundary behavior, then the quality of movement outside the range.
Clean, Weak, and Invalid Descending Triangle Structures
The cleanest descending triangle reading comes from visible boundary discipline. The weakest readings usually come from forcing the shape onto a noisy range, accepting poor support quality, or treating the first boundary break as proof before the market holds outside the structure.
| Reading | Observable features | What weakens it | What invalidates it |
|---|---|---|---|
| Clean descending triangle | Support is flat or near-flat, lower highs are clear, and the range compresses in an orderly way. | Volume evidence is thin, the structure forms too late near the apex, or one boundary needs minor adjustment. | Price breaks and accepts above the descending upper boundary, or support no longer acts as a recognizable base. |
| Weak descending triangle | Some lower highs are visible, but support is uneven or the upper boundary must be forced. | Support drifts lower, the range becomes too choppy, or the triangle shape depends on selective swing points. | The structure stops compressing and turns into a broad range, channel, or unrelated consolidation. |
| Invalid descending triangle | The chart has lower highs, but there is no consistent support boundary or no real convergence. | Any reading is already fragile because the core geometry is missing. | Price action no longer shows flat support plus descending reaction highs. |
| Unresolved break | Price trades beyond support or the upper boundary but does not sustain acceptance. | Fast reclaim, weak continuation, or immediate return into the range. | The break fails to change the range and price continues rotating inside the structure. |
Breakout Acceptance, Rejection, and False Break Risk
A descending triangle is first a structure. Breakout behavior is a later reading. Price can trade below support, but that move only becomes more meaningful if the market holds below the boundary instead of immediately reclaiming the prior range.
Downward acceptance appears when price spends time below the former support area and rallies struggle to regain it. Rejection appears when price dips below support but quickly recovers back into the triangle. A boundary failure appears when price moves outside the structure but cannot extend or remain beyond it.
False break risk is one reason the pattern should not be reduced to the first boundary break. A fast reclaim above support can weaken the bearish interpretation, while an upward break through the descending upper boundary can shift the reading toward failed compression rather than downside continuation.
Descending triangle example in context: Price tests the same support area several times while each recovery stalls sooner than the last. The classification is easier to defend when the lower highs are visible and the support boundary remains stable. It remains unresolved if price briefly slips below support but immediately returns into the range and cannot sustain movement beyond either boundary.
Volume and Context
Volume can add useful context to a descending triangle, but it should not replace the structure. Contracting volume during the formation can fit a compression reading, while heavier activity during resolution can show stronger participation around the boundary.
The limitation is that volume can expand for several reasons. A high-volume break is not proof by itself if price quickly reclaims the range or fails to hold outside the boundary. Volume is more useful when it aligns with whether price holds beyond the boundary or returns into the prior range.
Background trend also changes interpretation. A descending triangle after a decline may be read differently from a descending triangle after a strong advance or inside a broad sideways market. The same shape can carry different weight depending on where it forms and how cleanly the boundaries behave.
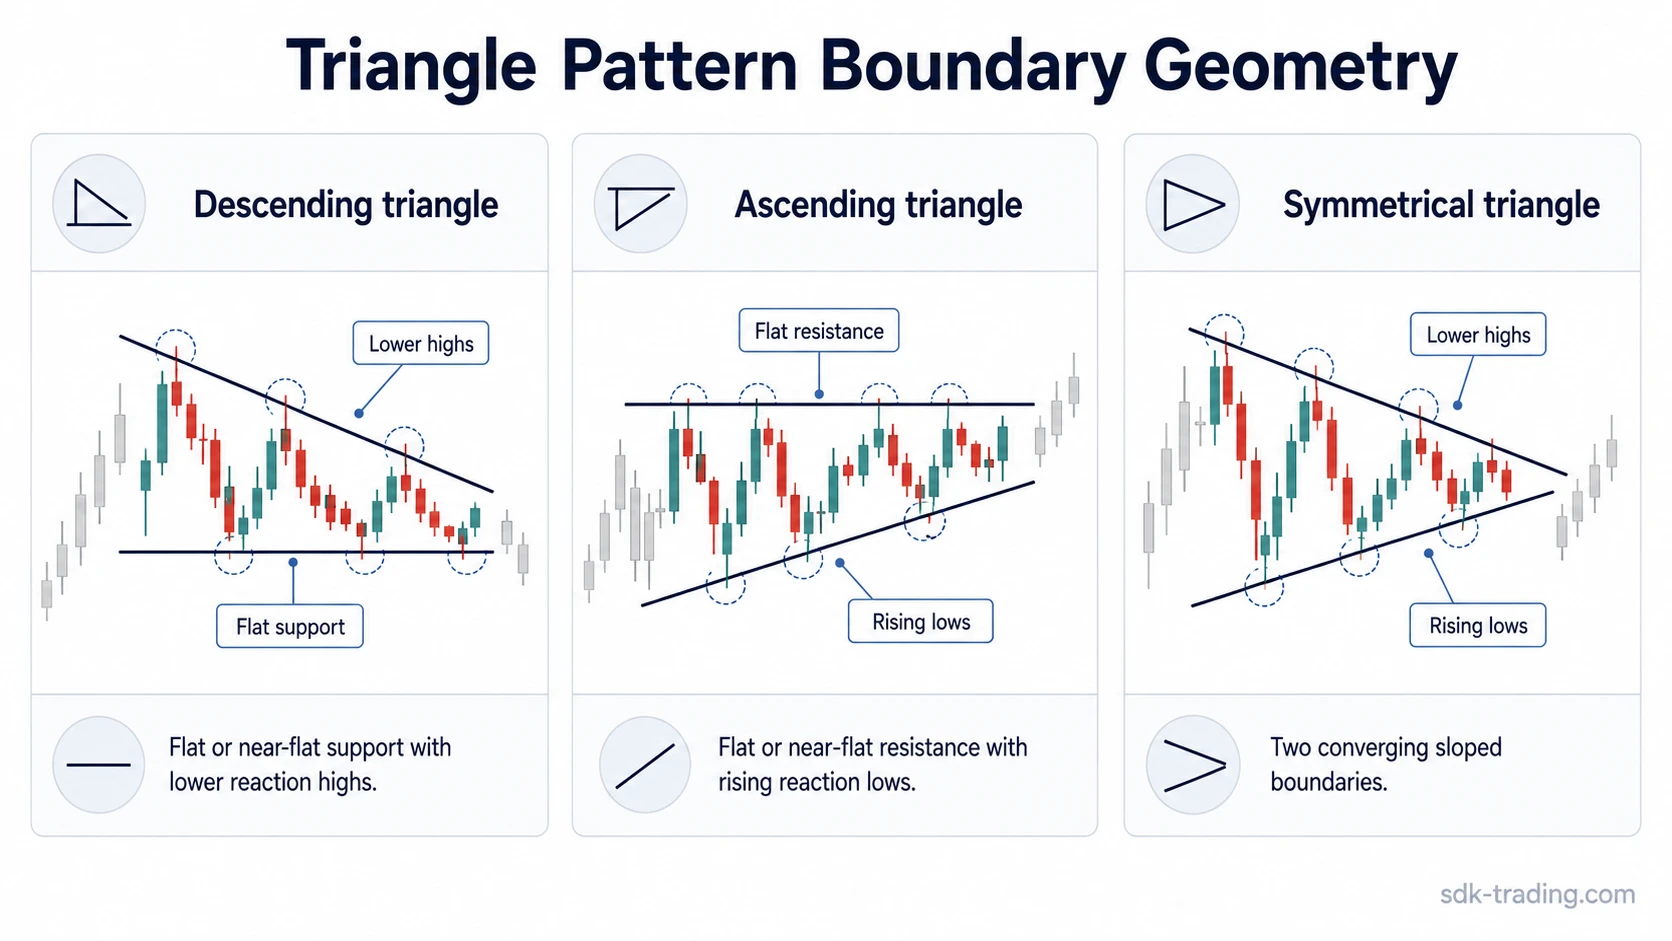
Descending Triangle vs Ascending Triangle vs Symmetrical Triangle
The difference between triangle patterns comes from boundary geometry. A descending triangle has a flat or near-flat support line and lower reaction highs. An ascending triangle reverses that structure with flat resistance and rising reaction lows.
A symmetrical triangle uses two sloping boundaries: lower highs from above and higher lows from below. Neither side is defined by a clearly horizontal support or resistance boundary in the same way.
| Pattern | Boundary shape | Main structural clue |
|---|---|---|
| Descending triangle | Flat or near-flat support, descending upper boundary | Support is tested while rally highs decline. |
| Ascending triangle | Flat or near-flat resistance, rising lower boundary | Resistance is tested while reaction lows rise. |
| Symmetrical triangle | Two converging sloped boundaries | Lower highs and higher lows compress toward each other. |
Broader triangle patterns explained context helps classify the family, but the descending triangle reading depends on one specific geometry: horizontal support pressure combined with declining rally reach.
Common Mistakes
Several mistakes weaken descending triangle analysis. Most come from treating a visual resemblance as enough evidence or from turning the pattern into a tactical conclusion before the structure and boundary behavior are clear.
- Forcing the triangle onto a messy range: lower highs alone do not create a descending triangle if support is unclear.
- Ignoring drifting support: a downward-sloping lower boundary may point to a channel or falling range rather than a descending triangle.
- Treating the first break as proof: a break that quickly reclaims the range can become a false break rather than a clean resolution.
- Overusing target projections: measured-move logic can make the reading sound more certain than the structure supports.
- Confusing structure with a trade plan: the pattern describes compression and boundary behavior, not entry, exit, stop, or target mechanics.
Limitation: A descending triangle can lose meaning when the boundaries need constant redrawing. If each new swing changes the structure, the pattern may be too unstable to classify cleanly.
FAQ
What does a descending triangle pattern mean?
A descending triangle pattern means price is compressing between flat or near-flat support and a series of lower reaction highs. It often reflects pressure against support, but the outcome depends on later boundary behavior.
Is a descending triangle bullish or bearish?
A descending triangle is often associated with bearish or continuation readings, especially when support is repeatedly tested. It can still resolve upward or fail after a downside break, so the structure should not be treated as deterministic.
How do you identify a descending triangle?
Identify the support boundary first, then check whether reaction highs are stepping lower and whether the range is narrowing. The pattern is weaker if support drifts, the highs are random, or the lines need to be forced.
Can a descending triangle have a false break?
Yes. A false break can occur when price moves beyond support but quickly reclaims the range or fails to sustain follow-through outside the boundary.
What makes a descending triangle invalid?
A descending triangle becomes invalid as a structure when flat support, descending reaction highs, or real compression are no longer visible. A sustained upward break through the descending upper boundary can also weaken the original bearish reading.