A triangle chart pattern is a trading-chart structure where price compresses between converging support and resistance boundaries. The pattern can appear as an ascending triangle, descending triangle, or symmetrical triangle, but the useful reading starts with compression quality rather than the name of the shape.
The common mistake is treating any narrowing price area as a finished triangle pattern. A cleaner reading checks whether the swings are actually contracting, whether both boundaries are respected, and whether later price behavior holds outside the structure or returns back into the old range.
Key Points
- Triangle chart patterns depend on converging boundaries and shrinking swing range, not only on a visual triangle shape.
- Ascending, descending, and symmetrical triangle patterns use different boundary geometry, but all require compression.
- A cleaner reading improves when price repeatedly interacts with the boundaries without random line-fitting.
- A weak reading appears when the structure is forced around ordinary sideways movement.
- Later boundary behavior can hold outside the structure, return into the old range, or leave the pattern unresolved.
Triangle Chart Pattern Types
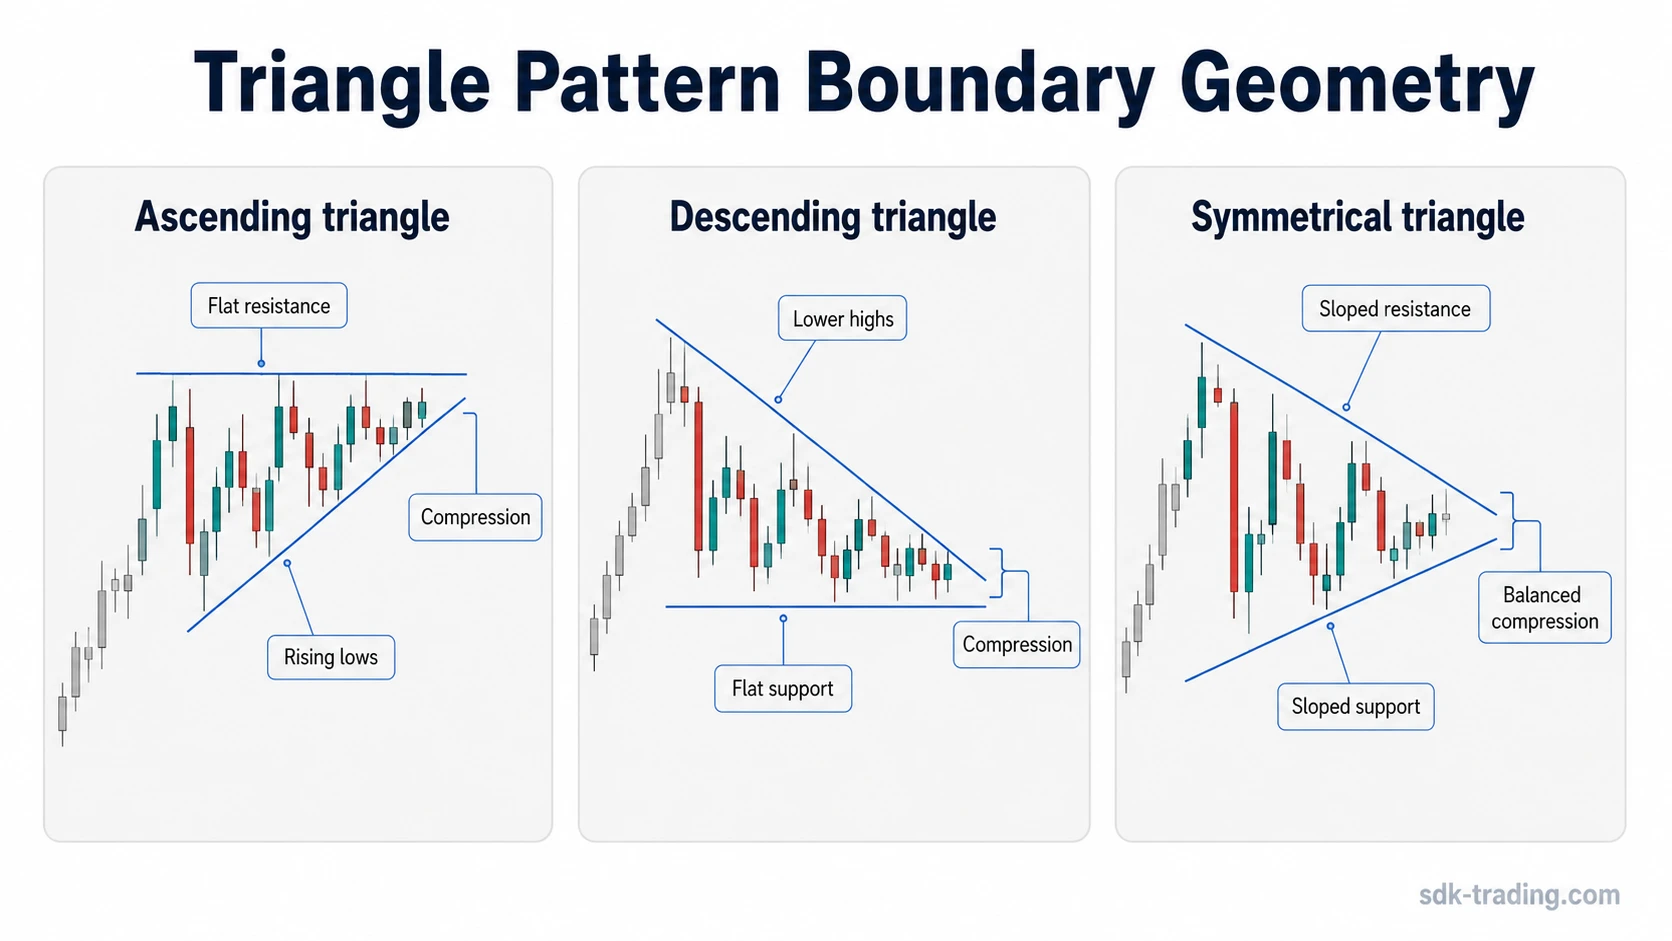
The three common triangle chart patterns are ascending triangles, descending triangles, and symmetrical triangles. Each type uses a different boundary structure, but all three depend on visible compression between support and resistance.
| Triangle pattern | Basic structure | Common interpretation | Main caution |
|---|---|---|---|
| Ascending triangle | Flat or near-flat resistance with rising reaction lows. | Often read as pressure building against resistance. | Weak if resistance is not clearly tested. |
| Descending triangle | Flat or near-flat support with lower reaction highs. | Often read as pressure building against support. | Weak if support depends on one isolated low. |
| Symmetrical triangle | Lower highs and higher lows compress between two sloped boundaries. | Often read as balanced compression before later resolution. | Direction should stay conditional until boundary behavior is clearer. |
How to Identify a Triangle Chart Pattern
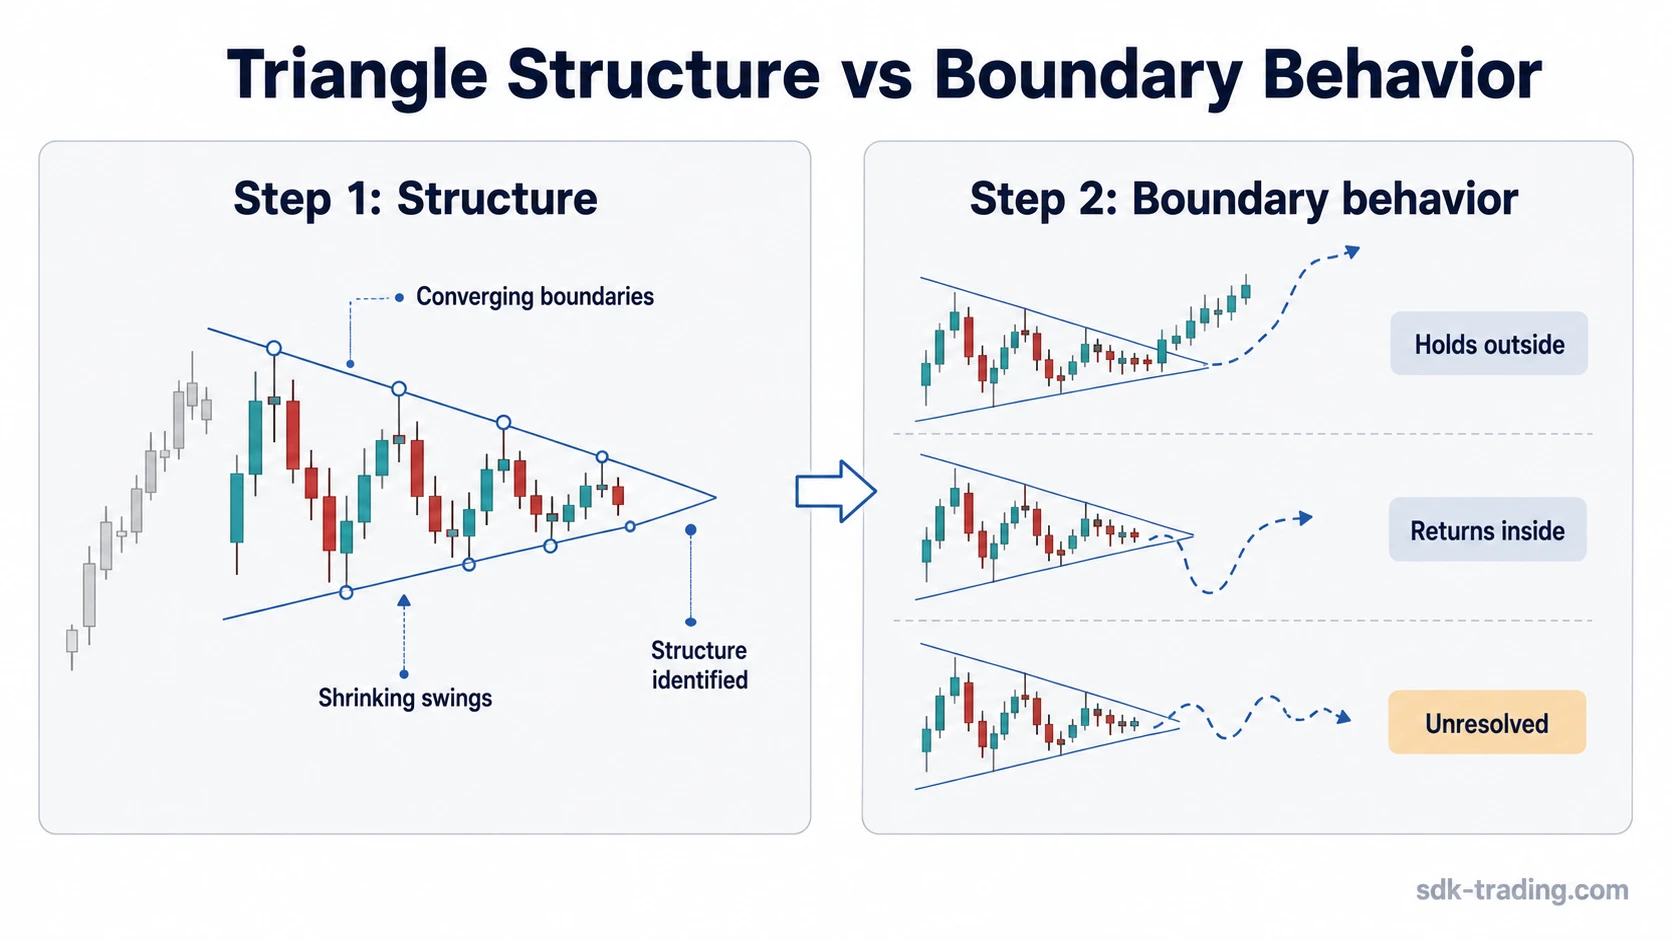
A triangle chart pattern is easier to identify when each swing contracts inside two converging boundaries. The upper boundary usually connects reaction highs, while the lower boundary connects reaction lows. The structure becomes cleaner when price interacts with both sides more than once and the range narrows without constant line adjustment.The label should stay conditional if the boundaries depend on selective candles, if price is only moving sideways without compression, or if the first break immediately returns into the old range.
| Diagnostic filter | Cleaner reading | Weaker reading |
|---|---|---|
| Boundary structure | Two clear converging boundaries contain the main swings. | Lines are adjusted repeatedly to fit unrelated highs and lows. |
| Swing contraction | The range narrows as reactions become smaller. | Price remains broadly sideways with no visible compression. |
| Boundary interaction | Price tests the boundaries more than once without immediately destroying the structure. | One isolated touch is used to label the whole pattern. |
| Later behavior | Movement outside the boundary is assessed by whether price maintains separation from the prior structure. | The first boundary break is treated as final before follow-through is visible. |
What Makes a Triangle Pattern Reading Cleaner?
A triangle pattern becomes more defensible when the market shows contraction. The distance between reaction highs and reaction lows should narrow, and each boundary should have enough interaction to make the structure visible without forcing the lines.The strongest diagnostic filter is not a fixed touch count. It is whether the swings show compression around meaningful areas. A chart can have two lines that meet visually, but if price is moving randomly inside them or the boundaries depend on selective points, the pattern reading remains weak.
Misread vs Safer Interpretation
The common misread is visual. Price narrows, two trendlines can be drawn, and the pattern is named too early. That shortcut ignores whether the boundaries are meaningful, whether swing size is actually contracting, and whether later price behavior respects the structure.
Shape is only the visible outline. The useful part is the structure behind it: smaller swings, clearer boundaries, and a boundary test that does not immediately neutralize the pattern.
Clean, Weak, and Failed Triangle Readings
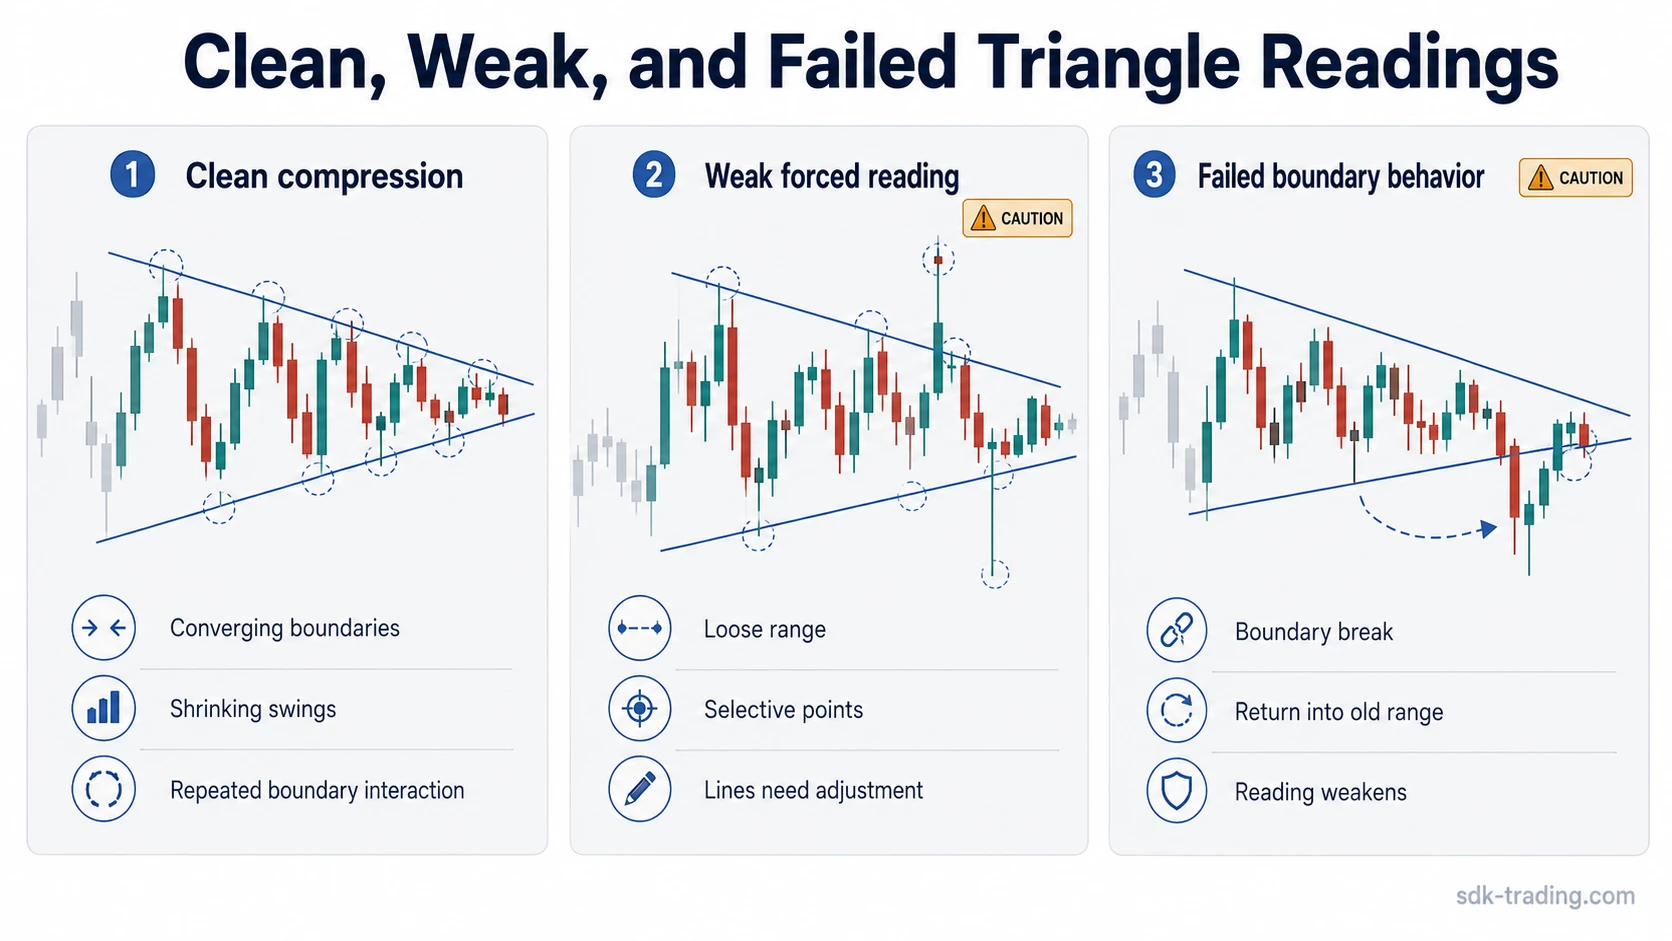
A clean triangle reading usually has visible compression before the boundary break. A weak reading has the appearance of compression but depends on selective line placement. A failed reading occurs when price breaks a boundary and then quickly returns into the old compression area.
| Reading state | What appears on the chart | Diagnostic meaning |
|---|---|---|
| Clean compression | Price forms smaller swings between boundaries that remain visible without constant adjustment. | The pattern label is more defensible, but still conditional. |
| Weak compression | The range narrows unevenly, boundaries are loose, or key touches depend on outlier candles. | The structure may be ordinary congestion rather than a well-supported triangle pattern. |
| Failed boundary behavior | Price breaks a boundary and then returns quickly into the prior compression area. | The first break loses clarity because the market failed to maintain separation from the structure. |
| Unresolved behavior | Price moves near the boundary but neither holds outside it nor clearly moves back through the range. | The reading remains incomplete until later candles clarify the boundary response. |
Triangle Patterns vs Breakout Behavior
The triangle structure is identified before breakout behavior is judged. First comes compression between converging boundaries. Only after that does the response around the boundary become relevant.A boundary break can produce different readings. Price may hold outside the old structure, return quickly into the compression area, or hover near the boundary without a clear result. Those outcomes describe the quality of later behavior, not the original triangle label.This distinction prevents a common sequencing error: treating the first boundary break as the whole interpretation. The structure asks whether compression was present. The later behavior asks whether the market maintained or lost separation from that structure.
Triangle Pattern vs Wedge vs Range
Triangles, wedges, and ranges can look similar because all three can appear during pauses in price movement. The difference is the boundary structure. A triangle needs converging compression, a wedge usually has both boundaries sloping in the same broad direction, and a range usually moves between more horizontal areas.
| Structure | What defines it | Why it gets confused with a triangle |
|---|---|---|
| Triangle pattern | Converging boundaries with contracting swings. | The narrowing shape is visually obvious. |
| Wedge pattern | Both boundaries usually slope in the same broad direction. | It also narrows, but the slope changes the structure. |
| Range | Price moves between mostly horizontal support and resistance. | A loose range may look triangular if lines are forced around it. |
Common Triangle Pattern Mistakes
- Forcing trendlines: Lines become unreliable when they need constant adjustment to keep the pattern alive.
- Assuming direction too early: Boundary geometry does not automatically settle the later market path.
- Ignoring failed separation: A quick return into the old compression area can weaken the first boundary break.
- Counting touches mechanically: A touch count is less useful when the swing structure is loose or the boundaries are arbitrary.
- Confusing triangles with wedges or ranges: A triangle needs converging compression; a loose range or steep wedge-like structure may need a different label.
Simple Triangle Pattern Example
When a Triangle Reading Should Stay Conditional
A triangle reading should stay conditional when compression is incomplete, the boundaries are not respected, or price quickly moves back through the tested boundary. The cleaner phrasing separates observation from interpretation: price is compressing, boundaries appear to converge, and later behavior will clarify whether the structure held, failed, or stayed unresolved.
FAQ
What is a triangle chart pattern?
A triangle chart pattern is a trading-chart structure where price compresses between converging support and resistance boundaries. The pattern becomes more useful when the swings contract and the boundaries remain visible without forced line drawing.
What are the main types of triangle patterns?
The main triangle pattern types are ascending triangles, descending triangles, and symmetrical triangles. They differ by boundary geometry, but all three require visible compression between support and resistance.
Are triangle patterns always bullish or bearish?
No. Triangle patterns describe compression first. Later boundary behavior may shift the interpretation, but the shape alone does not prove bullish or bearish outcome.
What makes a triangle pattern fail?
A triangle reading weakens when price breaks a boundary and quickly returns into the old compression area, or when the original boundaries were forced around ordinary sideways movement.