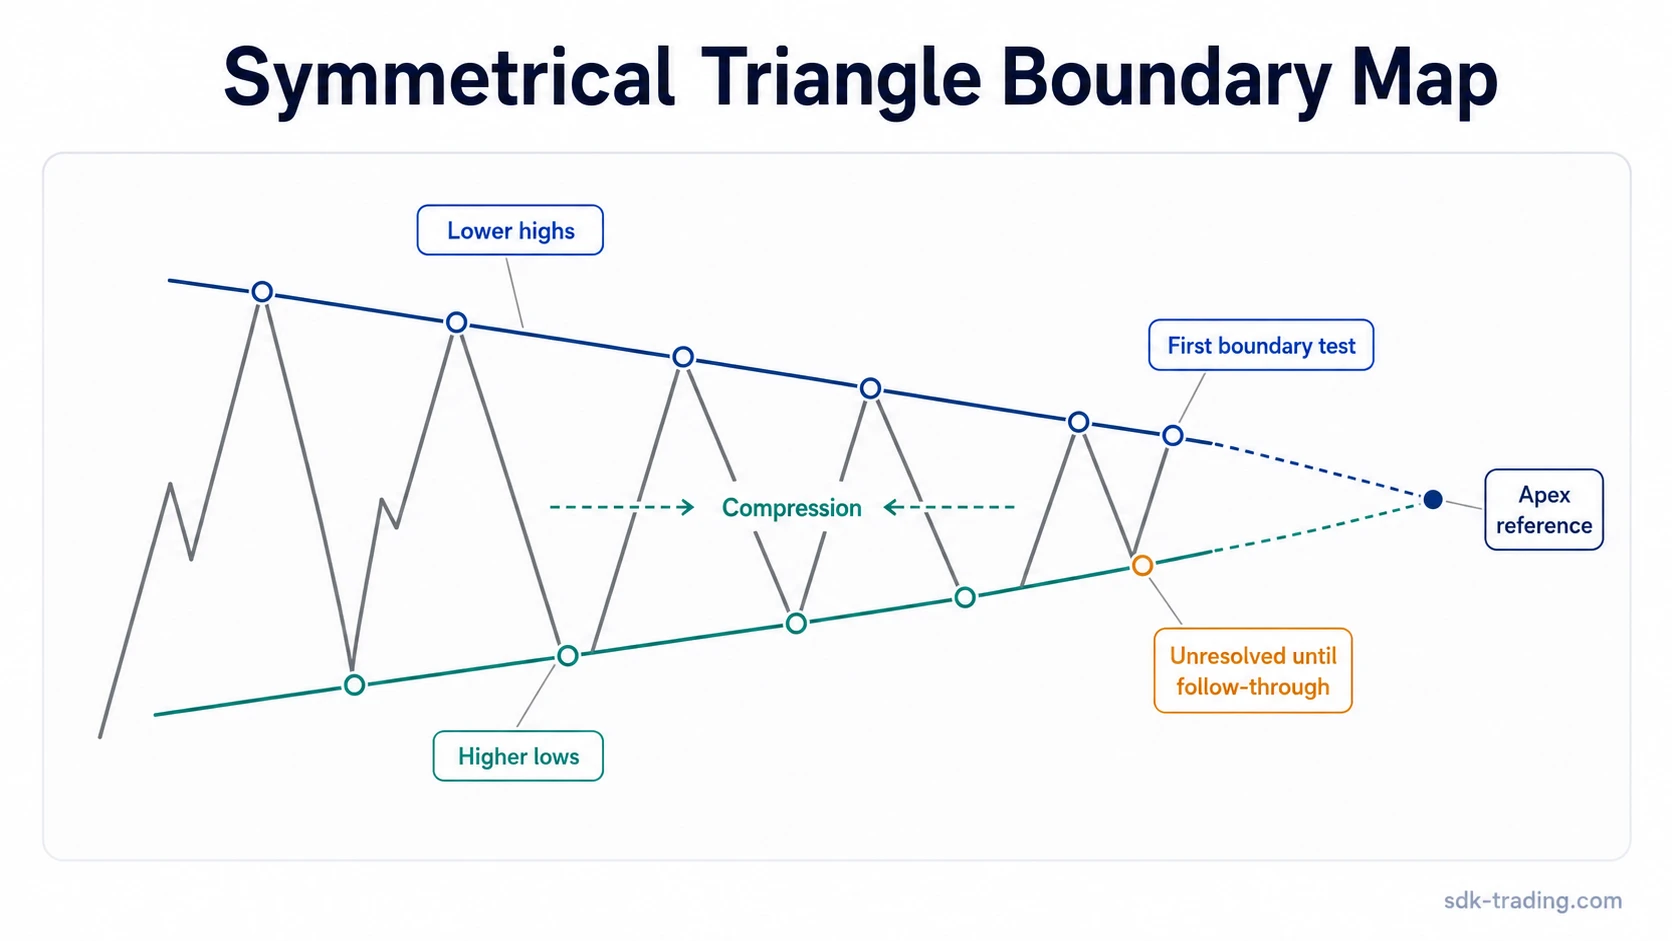
A symmetrical triangle pattern is a chart pattern formed when lower highs and higher lows compress price between two inward-sloping boundaries.
The structure shows volatility compression, not a fixed directional outcome. A cleaner reading depends on boundary quality, repeated swing contact, volume behavior, apex drift, and whether price later holds beyond a boundary or returns inside the compression.
Definition: A symmetrical triangle pattern is a technical-analysis structure where price narrows between a descending upper boundary and an ascending lower boundary. The upper side reflects lower highs, the lower side reflects higher lows, and the narrowing space between them marks compression.
Key Points
- A symmetrical triangle needs lower highs and higher lows, not just a random narrowing move.
- Both boundaries should slope inward; a meaningfully flat side can shift the classification.
- Volume often contracts during formation, but volume alone does not validate the structure.
- A first boundary break and a break that holds beyond the line are different chart-reading states.
What Is a Symmetrical Triangle Pattern?
A symmetrical triangle pattern forms when buying and selling pressure become more compressed over a series of swings. Sellers step in at lower highs, buyers step in at higher lows, and price moves toward a narrower decision area.
The pattern is usually read as a balance structure. Neither side has a clear structural advantage while price remains contained inside the two converging boundaries. That unresolved quality separates the shape itself from any later breakout interpretation.
The useful reading comes from more than the outline. Boundary quality, swing spacing, volume behavior, and follow-through after a boundary test determine whether the pattern remains a strong symmetrical triangle reading or weakens into a less reliable contraction.
Limitation: A triangle shape is only the surface. The reading becomes less useful when the boundaries are forced, the swing sequence is thin, or price repeatedly spends time outside the structure before clear compression has formed.
How to Identify a Symmetrical Triangle
A stronger symmetrical triangle reading begins with a visible swing sequence. The upper boundary should connect lower highs, and the lower boundary should connect higher lows. The boundaries do not need to be mathematically perfect, but they should describe real market behavior rather than a line drawn through unrelated candles.
| Feature | What to look for | Why it matters |
|---|---|---|
| Lower highs | Each major rally attempt stalls below a prior swing high. | Shows pressure from the upper side of the structure. |
| Higher lows | Each major pullback holds above a prior swing low. | Shows pressure from the lower side of the structure. |
| Two inward-sloping boundaries | The upper line slopes down and the lower line slopes up. | Separates a symmetrical triangle from flat-sided triangle types. |
| Repeated contact | Price interacts with both boundaries more than once. | Reduces the risk of labeling a minor pause as a pattern. |
| Narrowing swing breadth | Swings become smaller as price approaches the apex area. | Shows compression instead of normal choppy movement. |
| Mostly contained price | Most swing behavior remains between the two boundaries. | Frequent outside holding behavior weakens the pattern reading. |
A small wick through a boundary does not automatically destroy the structure. The stronger question is whether price quickly returns inside the pattern or begins spending time outside the boundary with follow-through.
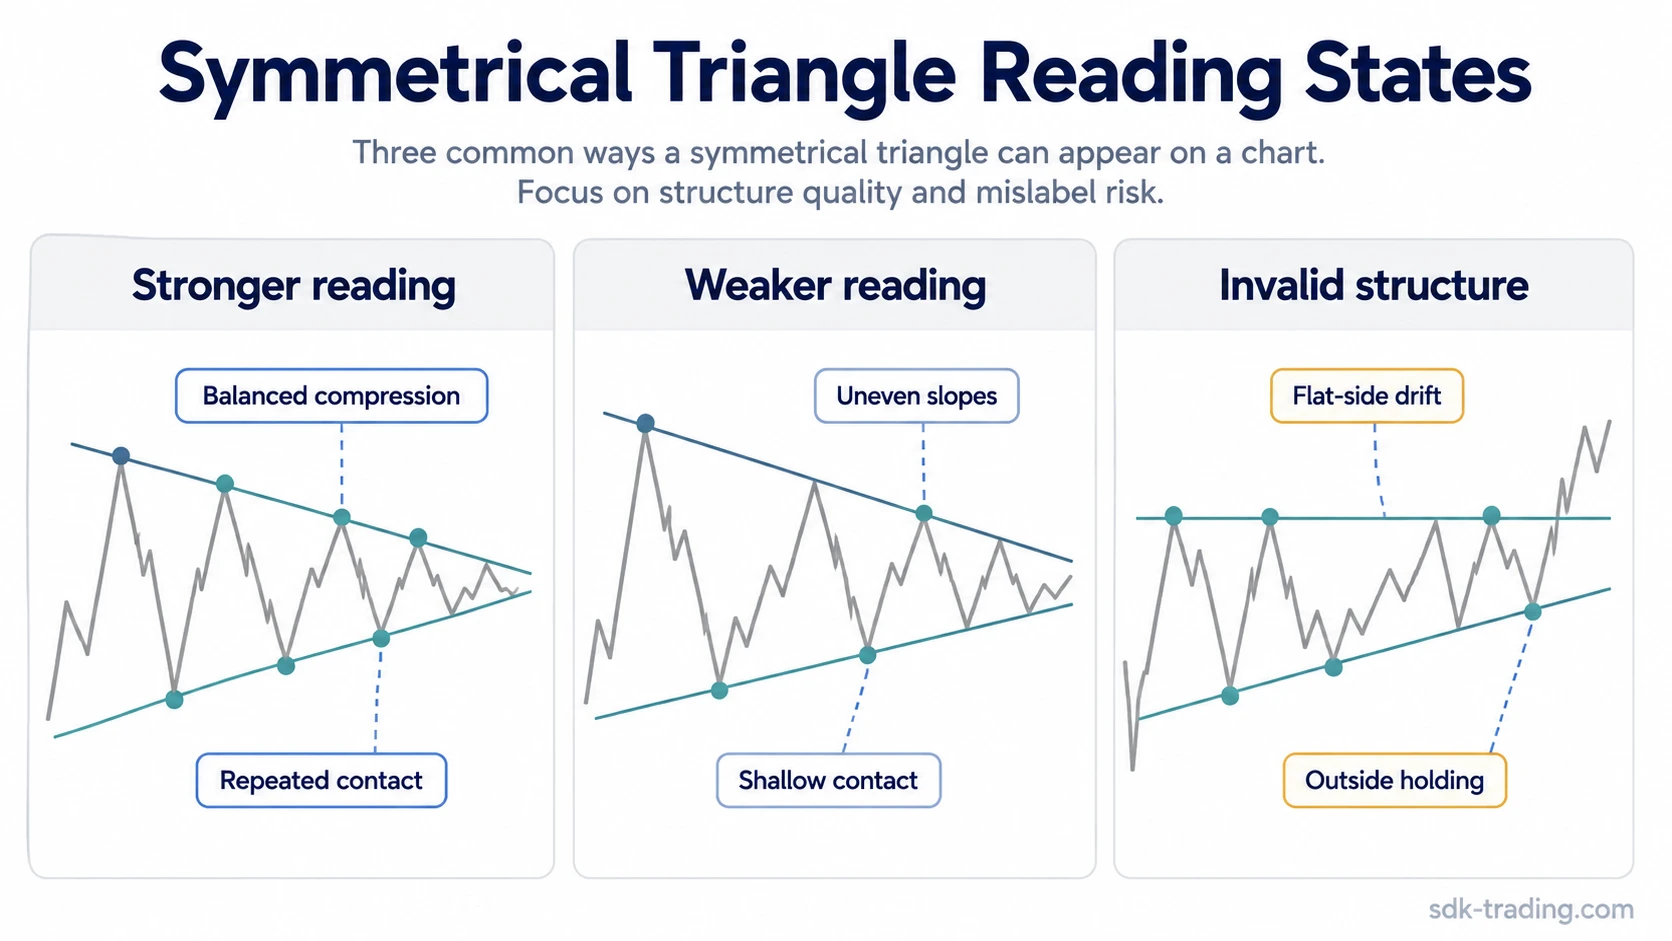
Clean, Weak, and Invalid Symmetrical Triangle Readings
Symmetrical triangles are easy to over-label because many markets temporarily narrow. A cleaner diagnosis separates a well-formed compression from a weak sketch or an invalid structure.
| Reading state | Typical structure | Diagnostic meaning |
|---|---|---|
| Clean reading | Several lower highs and higher lows form inside two balanced inward-sloping boundaries. | The market is compressing in a recognizable symmetrical triangle structure. |
| Weak reading | Touches are shallow, slopes are uneven, or one boundary needs a forced trendline. | The chart may be narrowing, but the pattern quality is not strong. |
| Invalid reading | One side becomes meaningfully flat, price repeatedly holds outside the structure, or no real swing sequence exists. | The structure no longer behaves like a symmetrical triangle. |
Common mistake: Not every tightening price move is a symmetrical triangle. The structure needs repeated swings on both sides, two inward-sloping boundaries, and enough compression to show that the market is narrowing rather than simply pausing.
Volume, Apex, and Boundary Follow-Through
Volume often contracts while a symmetrical triangle forms because each swing covers less ground and participation may become more cautious inside the narrowing range. That contraction is a tendency, not a rule. A pattern can still be messy if the swing structure is poor, even when volume declines.
The apex is the area where the two boundaries would meet if extended. Price does not need to touch the exact apex. A useful apex reading looks at whether compression is maturing, drifting, or becoming too late and crowded to classify cleanly.
A boundary break is only the first change in state. A break holds better when later price behavior spends time beyond the broken boundary instead of immediately returning inside the triangle. A failed break returns into the prior compression area and leaves the earlier boundary test unresolved.
Safe interpretation note: A first line break can remain unresolved until later behavior shows whether the market holds beyond the boundary or falls back into the structure. Volume expansion can show increased participation, but it should not be treated as a complete reading without price behavior after the break.
Symmetrical Triangle vs Ascending and Descending Triangles
The main distinction is boundary shape. A symmetrical triangle has two inward-sloping sides, while the neighboring triangle types have one side that is closer to flat.
| Pattern | Boundary structure | Classification cue |
|---|---|---|
| Symmetrical triangle | Descending upper boundary and ascending lower boundary. | Both sides compress toward the center. |
| ascending triangle | Flat or nearly flat upper boundary with rising lows. | The upper side is the key repeated stall area. |
| descending triangle | Flat or nearly flat lower boundary with falling highs. | The lower side is the key repeated hold area. |
Broader triangle patterns explained classification separates the triangle family before narrowing the reading to one specific boundary type.
Common Mistakes When Reading a Symmetrical Triangle
The most common mistake is drawing two converging lines before the market has produced a real swing sequence. A narrowing group of candles can look triangular, but a symmetrical triangle needs meaningful highs and lows that define both sides of the structure.
Another mistake is treating a wick outside the boundary as a completed breakout. A wick can be a probe, a temporary rejection, or the beginning of a more durable move beyond the line. The distinction depends on what happens after the boundary is tested.
A third mistake is ignoring classification drift. If the upper side becomes flat, the structure may resemble an ascending triangle. If the lower side becomes flat, it may resemble a descending triangle. If both sides are irregular and price repeatedly holds outside them, the triangle label becomes weaker.
Symmetrical Triangle Pattern Example in Context
Price advances, stalls, and then begins making smaller swings. The next rally stops below the prior high, while the next pullback holds above the prior low. Several swings later, the two boundaries slope inward and volume becomes lighter during the middle of the compression.
A brief move through the upper boundary follows, but the next candles hesitate near the broken line. If price spends time above the boundary and pullbacks do not quickly return into the triangle, the break is holding better. If price falls back inside the structure and the next recovery attempt stalls below the same area, the earlier break remains unresolved or failed.
The sequence matters more than the first break. The structure forms first, boundary quality determines whether the label is useful, and later behavior shows whether the break is holding or failing back into the compression.
When the Pattern Reading Weakens
A symmetrical triangle reading weakens when the chart no longer shows balanced compression. One-sided flattening, repeated holding behavior outside the boundaries, shallow boundary contact, or a missing swing sequence can all reduce the usefulness of the label.
The pattern also weakens when volume or price behavior is used in isolation. Lower volume during compression may support the reading, but it does not repair poor structure. Strong participation near a boundary can stand out visually, but the structure still needs follow-through rather than immediate failure back into the old range.
FAQ
What does a symmetrical triangle pattern mean?
A symmetrical triangle pattern means price is compressing between lower highs and higher lows. The structure reflects narrowing volatility and unresolved direction until later price behavior holds beyond a boundary or falls back inside it.
Is a symmetrical triangle bullish or bearish?
A symmetrical triangle is not inherently bullish or bearish while price remains inside the structure. The directional reading depends on the later break, follow-through, failure, and surrounding market context.
How many touches does a symmetrical triangle need?
A stronger reading usually has repeated contact on both boundaries. The exact count is less important than whether the highs, lows, and boundary reactions describe a real compression structure.
Does volume need to decrease in a symmetrical triangle?
Volume often contracts during the formation, but it does not have to decline perfectly. Volume is most useful when interpreted with boundary quality, swing structure, and later behavior around the boundary.
Does price have to reach the apex?
Price does not need to reach the exact apex. The apex is mainly a reference for how mature or compressed the pattern has become, not a required touch point.