Ascending and descending triangle patterns are trading chart patterns that both compress price between one horizontal boundary and one sloped boundary. The difference is which side stays flat and how the swings press toward that boundary: an ascending triangle has flat resistance with rising lows, while a descending triangle has flat support with falling highs.
Definition: Ascending and descending triangle patterns are compression structures used in technical analysis to compare how price behaves between a horizontal boundary and a sloped boundary. The pattern label is useful only when the boundary, swing progression, and later behavior point to the same structural reading.
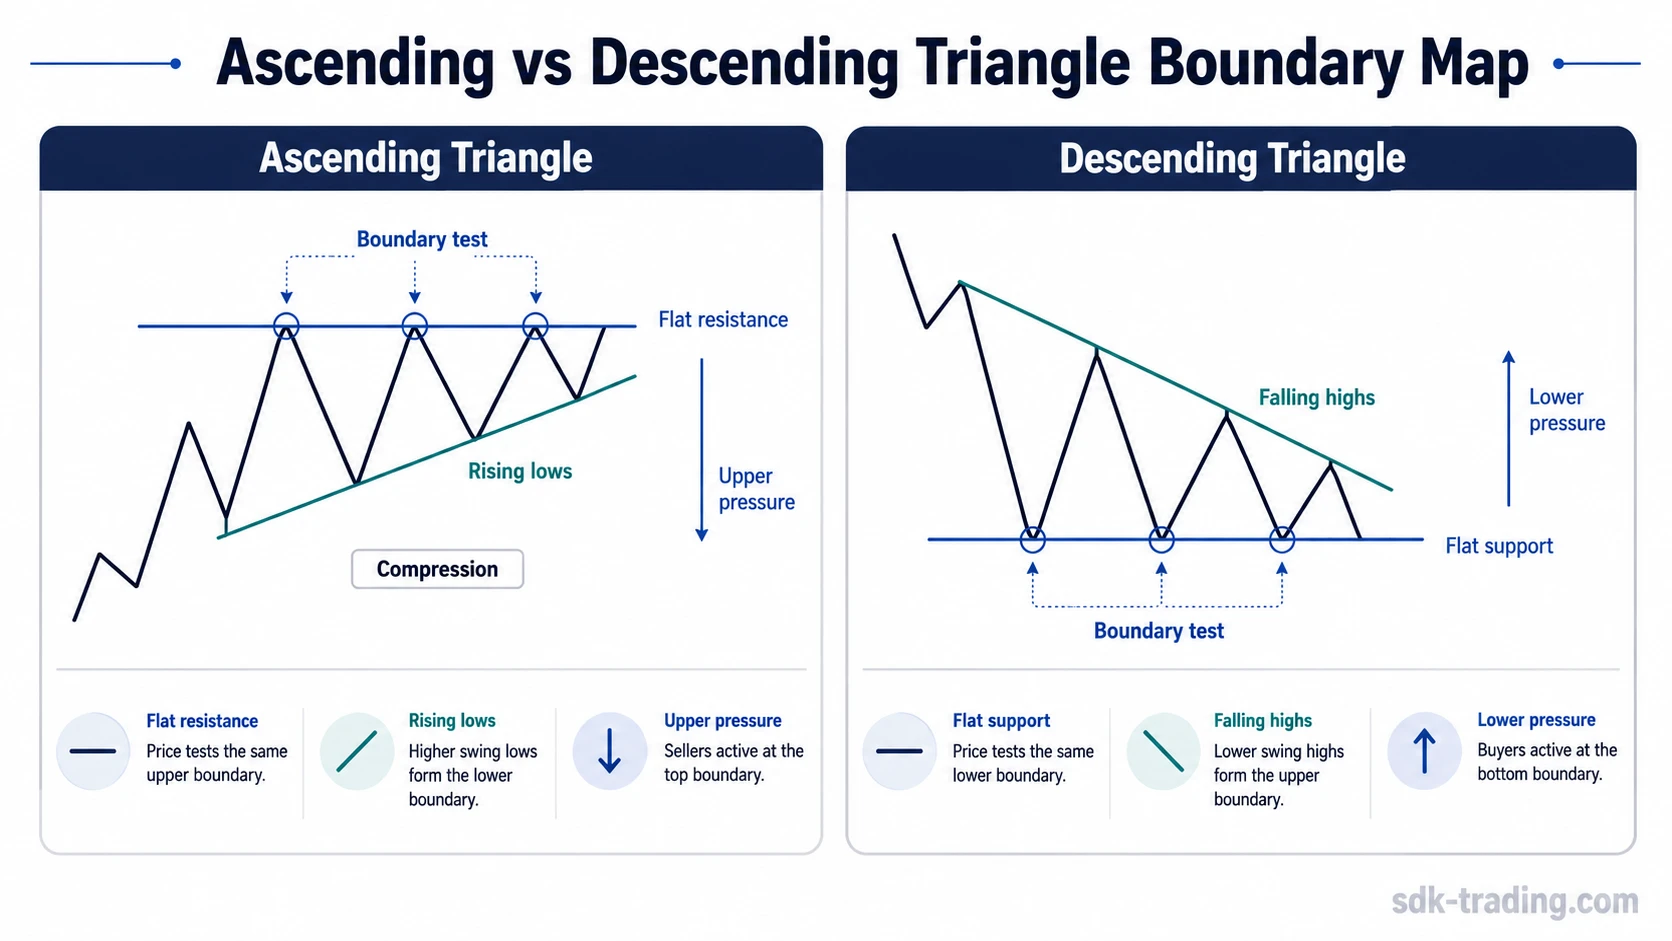
The shared feature is narrowing price action. The separating feature is pressure direction. Rising lows below a flat upper boundary show repeated attempts to press into resistance. Falling highs above a flat lower boundary show repeated attempts to press into support. Expected direction alone is not enough; the structure can weaken quickly if price only probes the tested area and returns into the range.
Key Points
- Both patterns compress price between one horizontal boundary and one sloped boundary.
- An ascending triangle uses flat resistance and rising lows.
- A descending triangle uses flat support and falling highs.
- Boundary behavior and failed-break risk decide whether the chart-reading label remains useful.
Ascending vs Descending Triangle Patterns: Core Difference
The core difference is the side of the structure that stays horizontal. In an ascending triangle, resistance remains relatively flat while each pullback holds at a higher low. In a descending triangle, support remains relatively flat while each rebound stalls at a lower high.
That boundary difference changes the interpretation. The ascending version focuses on pressure building into an upper boundary. The descending version focuses on pressure building into a lower boundary. Both can fail, both can break in unexpected ways, and both need later behavior before the label becomes more than a structural observation.
Shared structure: narrowing range, repeated boundary tests, and visible compression.
Main divergence: the flat boundary and swing progression point to different pressure sources.
Decision Lens: Boundary, Swing Structure, and Pressure
The cleanest comparison starts with the boundary, then checks the swing sequence, then judges whether later price behavior supports or rejects the tested area.
| Criteria | Ascending triangle | Descending triangle |
|---|---|---|
| Horizontal boundary | Flat or nearly flat upper resistance area | Flat or nearly flat lower support area |
| Sloped boundary | Rising lower boundary from higher lows | Falling upper boundary from lower highs |
| Swing progression | Pullbacks become shallower as lows rise | Rebounds become weaker as highs fall |
| Pressure source | Buying pressure appears to absorb supply near resistance | Selling pressure appears to absorb demand near support |
| Expected reading | Often treated as upward pressure, but only conditionally | Often treated as downward pressure, but only conditionally |
| What weakens the reading | Higher lows stop forming, or the upper boundary repeatedly rejects price | Lower highs stop forming, or the lower boundary repeatedly rejects price |
| What invalidates the structure | The rising-low sequence breaks and price holds below the lower boundary | The falling-high sequence breaks and price holds above the upper boundary |
| Closer structure focus | Use ascending triangle when the upper boundary and rising-low sequence need closer study | Use descending triangle when the lower boundary and falling-high sequence need closer study |
Use the ascending triangle label when the upper boundary is the fixed test area and higher lows show pressure building toward it. Use the descending triangle label when the lower boundary is the fixed test area and lower highs show pressure building toward it. If the swing sequence is unclear, the structure is only compression, not a clean ascending or descending triangle reading.
How an Ascending Triangle Differs
An ascending triangle forms when price repeatedly tests a similar upper area while pullbacks hold at progressively higher lows. The flat upper boundary marks the area being tested. The rising lows show that each retreat gives up less ground than the previous retreat.
The pattern becomes cleaner when the resistance area is visible, the higher lows are separated enough to form a real lower boundary, and price later spends meaningful time beyond the upper boundary instead of only making a brief probe. A quick wick above resistance followed by immediate rejection is weaker than sustained behavior above the boundary.
How a Descending Triangle Differs
A descending triangle forms when price repeatedly tests a similar lower area while rebounds stall at progressively lower highs. The flat lower boundary marks the area being tested. The falling highs show that each recovery attempt loses strength sooner than the previous attempt.
The structure becomes cleaner when the support area is visible, the lower highs create a clear upper boundary, and price later holds below the lower boundary instead of only making a brief lower probe. A fast move below support that quickly reclaims the range leaves the interpretation unresolved.
Same Compression, Different Boundary Message
Price can narrow into a tight range with repeated tests on both sides, yet the same compression can carry a different reading depending on which boundary is horizontal.
Example of a Basic Triangle Reading: Price advances into a well-watched area, pauses, and begins forming a narrowing range. If the upper boundary stays flat while each pullback holds higher, the structure points toward an ascending triangle reading. If the lower boundary stays flat while each rebound stalls lower, the same narrowing behavior points toward a descending triangle reading.
The distinction is not the narrowing range by itself. The useful evidence is whether the fixed boundary is being pressed by rising lows or falling highs, and whether the later boundary test is accepted or quickly rejected.
False equivalence is a common mistake. Both patterns compress, but they do not describe the same pressure source. Calling both structures “triangles” without checking the horizontal side removes the most important difference.
Clean, Weak, and Invalid Readings
A triangle comparison is more useful when the structure label is separated from reading quality. The label describes the shape. Later behavior decides whether the structure remains coherent.
| Reading quality | Ascending triangle | Descending triangle |
|---|---|---|
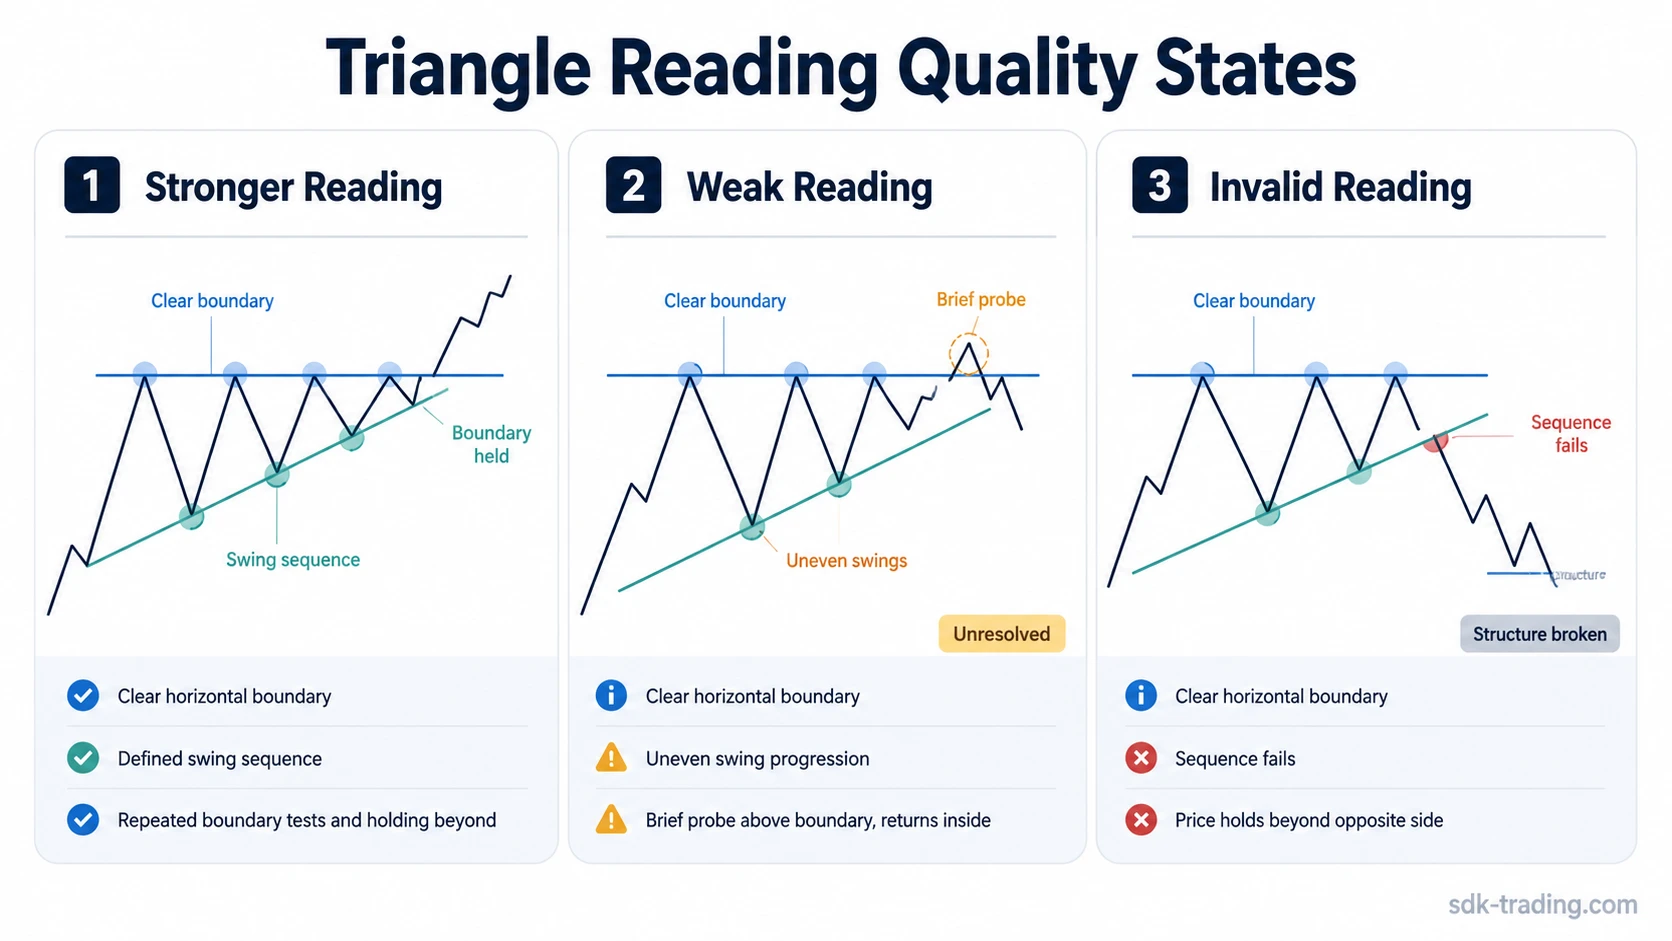
| Clean reading | Flat resistance, rising lows, repeated upper tests, and price behavior that holds beyond the upper boundary | Flat support, falling highs, repeated lower tests, and price behavior that holds beyond the lower boundary |
| Weak reading | Resistance is visible, but higher lows are uneven or the upper break is quickly rejected | Support is visible, but lower highs are uneven or the lower break is quickly reclaimed |
| Invalid reading | The rising-low sequence fails and price holds below the lower boundary | The falling-high sequence fails and price holds above the upper boundary |
Limitation: A first break of the horizontal boundary is only a test until price behavior shows whether the old range has changed character. A brief move through the boundary can still become a failed break if price returns into the range and the swing sequence no longer supports the original structure.
Breakout Acceptance and Failed-Break Risk
Breakout language can make triangle patterns sound more certain than they are. A cleaner reading separates a boundary probe from boundary acceptance.
Acceptance means price holds outside the tested area long enough to change the character of the prior compression. Rejection means price briefly crosses the boundary but returns into the range, leaving the structure weaker or unresolved.
Retest behavior can add context, but it should not become a mechanical rule. The useful question is whether the retest supports the original swing sequence or breaks it.
Common Mistakes When Comparing the Two Patterns
Mistake 1: treating compression as enough. Narrowing price action is shared by both patterns, but the horizontal boundary and swing progression create the distinction.
Mistake 2: reading only the horizontal boundary. A flat resistance or support area is not enough without a clear sequence of rising lows or falling highs.
Mistake 3: assuming the expected direction. Ascending triangles are often associated with upward pressure and descending triangles with downward pressure, but failed breaks and rejected boundary tests can change the interpretation.
Mistake 4: treating the first boundary break as final. The first break can be a probe. Reading quality improves only when later behavior supports the move beyond the tested area.
Where Volume Fits
Volume can add context near a triangle boundary, but it should not replace the structure. The comparison still depends on the horizontal side, the swing sequence, and whether the later boundary test is accepted or rejected.
FAQ
What is the main difference between ascending and descending triangle patterns?
The main difference is the horizontal boundary. An ascending triangle has a flat upper boundary with rising lows. A descending triangle has a flat lower boundary with falling highs.
Can both patterns appear during the same type of consolidation?
Yes. Both can appear during narrowing price action, but the swing sequence changes the reading. Rising lows pressing into resistance support an ascending triangle reading. Falling highs pressing into support support a descending triangle reading.
Is an ascending triangle always bullish?
No. An ascending triangle often reflects upward pressure, but the reading weakens if price cannot hold above resistance or if the rising-low sequence breaks.
Is a descending triangle always bearish?
No. A descending triangle often reflects downward pressure, but the reading weakens if price cannot hold below support or if the falling-high sequence breaks.
What makes a triangle reading invalid?
The reading becomes invalid when the swing sequence that defines the structure breaks and price holds beyond the opposite side of the pattern. For an ascending triangle, that usually means the rising-low sequence fails. For a descending triangle, that usually means the falling-high sequence fails.