Triangle breakouts are only meaningful when price behavior shows that a converging triangle boundary is no longer containing the range. A wick through the line, a brief pierce, or one isolated close outside the pattern can still leave the breakout unresolved.
The stronger interpretation comes from evidence of acceptance outside the triangle. That evidence can include separation from the boundary, follow-through, participation through volume, a useful retest, and no quick return back into the old compression area.
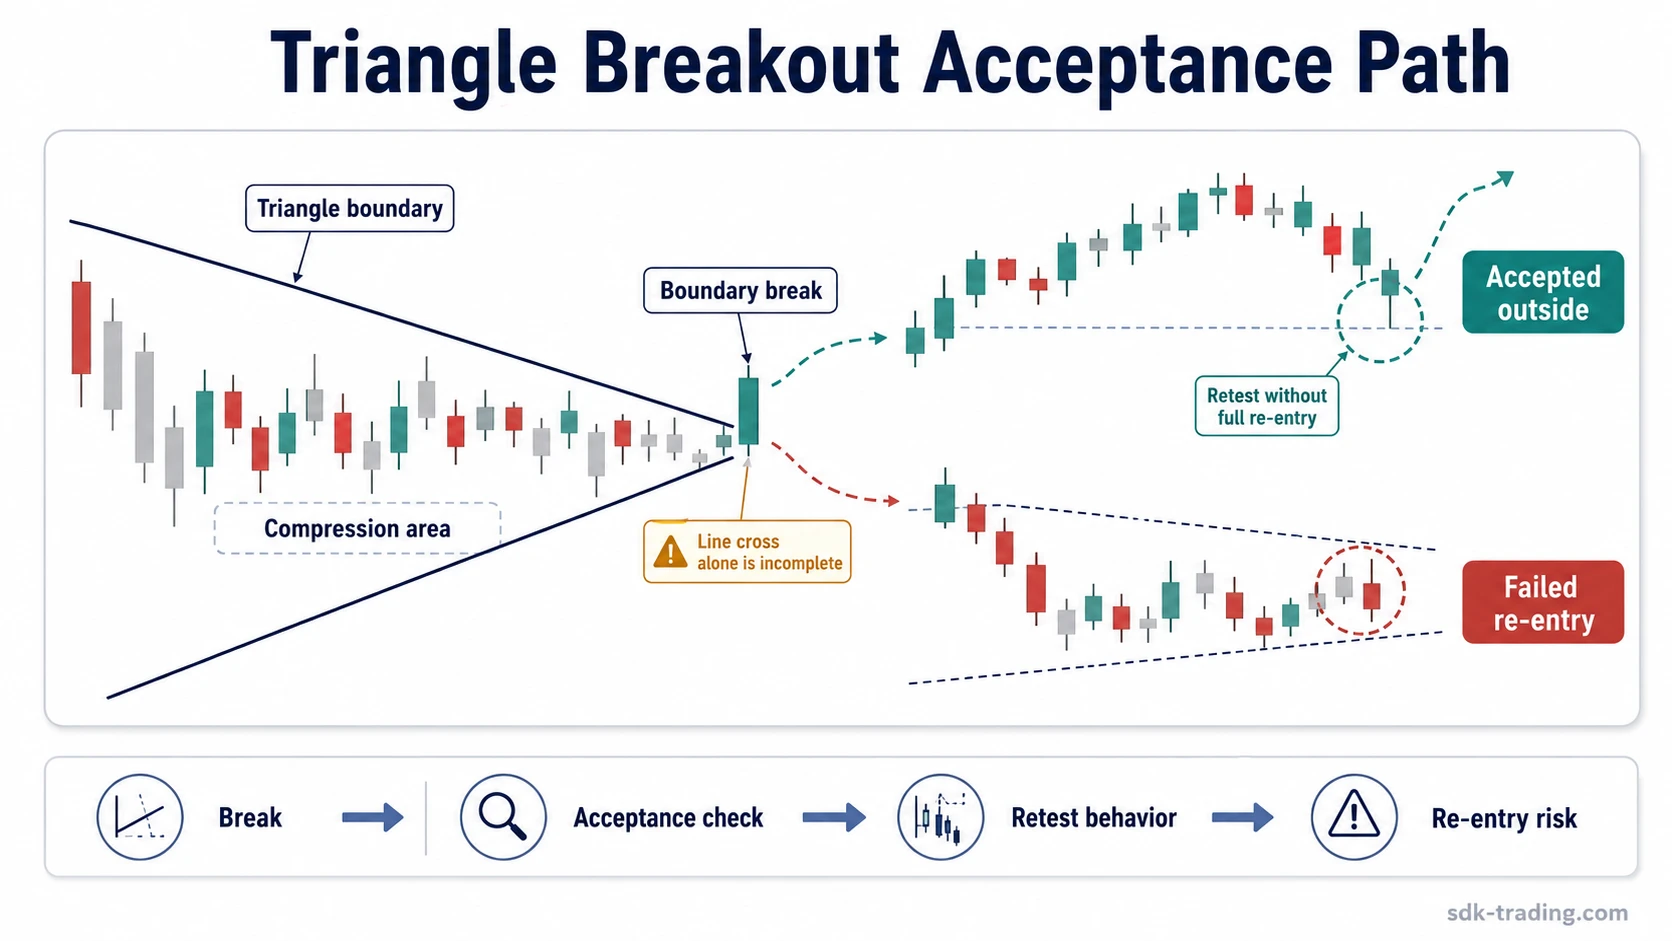
Definition: A triangle breakout is a chart-reading event where price moves beyond a triangle boundary and begins to behave as if the old compression range has lost control. The breakout improves only when later behavior supports that boundary shift.
Key Points
- A boundary break is not automatically an accepted triangle breakout.
- Acceptance, follow-through, volume, and retest behavior help judge whether the move has support.
- A fast return inside the triangle weakens the breakout and may turn it into a failed breakout.
- Breakout behavior changes with triangle type because each pattern uses different boundary geometry.
- Measured moves are rough chart measurements, not promised outcomes.
What Counts as a Triangle Breakout
A triangle breakout begins when price challenges one of the converging boundaries and moves beyond the area that previously contained the range. The important question is not only whether the line was crossed, but whether the market continues to accept price outside that boundary.
A clean breakout usually has three parts: the boundary is broken, price remains outside the prior compression area long enough to show acceptance, and later candles do not immediately reject the move back into the triangle. Without those parts, the break may still be only a test.
The boundary itself should also be credible. If the triangle is drawn from noisy, inconsistent swings, the breakout line may not represent a useful structure. A break of a weak boundary gives weaker information than a break of a boundary that many prior reactions respected.
When a Boundary Break Is Not Enough
A triangle line can be crossed without changing the actual market structure. This happens when price briefly trades outside the boundary, fails to separate from it, and returns to the old range before acceptance becomes visible.
Not enough evidence: A wick through the boundary, a close barely outside the line, or a late move near the apex does not automatically confirm a breakout. The interpretation remains weaker until price shows acceptance beyond the boundary and avoids fast re-entry into the triangle.
Late moves near the apex deserve extra caution because the range has already compressed heavily. A small push outside a narrowing structure can look clean on the chart while still lacking meaningful participation or follow-through.
Noisy compression also reduces confidence. If the market repeatedly cuts through both boundaries before the breakout attempt, the line may be more of a drawing aid than a reliable decision boundary.
Evidence Needed Before the Breakout Reading Improves
The evidence for a triangle breakout is best read as a sequence, not as a single candle. Each layer answers a different question about whether the old triangle boundary has stopped controlling price.
| Evidence layer | What to look for | What it clarifies |
|---|---|---|
| Boundary break | Price moves beyond the upper or lower triangle boundary. | Shows that the old compression line has been challenged. |
| Acceptance | Price holds outside the boundary instead of snapping back inside. | Suggests that the market is no longer treating the boundary as containment. |
| Follow-through | Later candles extend or stabilize outside the triangle. | Reduces the chance that the break was only a brief probe. |
| Volume participation | Activity expands or at least does not collapse during the move. | Helps judge whether the break has visible participation behind it. |
| Retest behavior | The former boundary is tested without immediate full re-entry. | Shows whether the old line is behaving differently after the break. |
| Re-entry check | Price returns inside the triangle and fails to reclaim the breakout area. | Weakens the breakout and can shift the interpretation toward failed acceptance. |
The sequence does not need to appear perfectly. A breakout can develop with uneven candles, pauses, and tests. The main point is whether the total behavior supports acceptance or points back to rejection.
Valid, Weak, and Failed Triangle Breakouts
Triangle breakouts are easier to read when they are separated into accepted, weak, and failed behavior. This avoids treating every line violation as the same event.
| Breakout type | Typical behavior | Interpretation | Main caution |
|---|---|---|---|
| Accepted breakout | Price breaks the boundary, holds outside the triangle, and avoids immediate re-entry. | The old compression boundary appears to have lost control. | Acceptance can still fail if later behavior rejects the new area. |
| Weak or unconfirmed breakout | Price crosses the line but does not create separation, participation, or stable follow-through. | The market has tested the boundary, but the breakout remains incomplete. | A single close outside the line may be overread as confirmation. |
| Failed breakout | Price moves outside the triangle, then quickly returns inside and cannot reclaim the breakout area. | The attempted boundary shift has been rejected or not accepted. | The failure should be read as structure behavior, not as an automatic opposite signal. |
A failed breakout does not need to be dramatic. The key behavior is failed acceptance: price had a chance to hold beyond the boundary, but the market returned to the prior compression area instead.
Triangle Breakout Example in Context
Price compresses inside a triangle after several lower reaction highs and higher reaction lows. Near the apex, the next candle briefly closes above the upper boundary, but the close is only slightly outside the line and the following candle returns into the prior range.
The first close creates a possible breakout, but the quick return keeps the evidence incomplete. The case becomes more constructive only if price can regain the boundary area and hold outside it. If the recovery attempt stalls below the broken line, the more cautious interpretation is failed acceptance rather than a confirmed breakout.
The first outside print starts the question, but the later boundary behavior decides whether the move shows acceptance, rejection, or unresolved compression.
How Breakout Behavior Differs by Triangle Type
Triangle type changes which boundary matters most and how the breakout is judged. The breakout logic remains similar, but the geometry behind the boundary is different.
An ascending triangle uses flat or near-flat resistance with rising reaction lows. A breakout attempt usually focuses on whether price can move above that resistance area and remain accepted above it.
A descending triangle uses flat or near-flat support with lower reaction highs. A downside break is not automatically meaningful unless the market accepts below support instead of quickly reclaiming the former range.
A symmetrical triangle uses two converging sloped boundaries. Because neither boundary is flat, the breakout depends heavily on clean boundary respect, separation from the line, and whether the move avoids drifting sideways through the apex.
Volume, Retests, and Follow-Through
Volume is useful because it can show whether more participation appears as price leaves the triangle. Expanding activity does not guarantee that the breakout will hold, but a breakout with collapsing activity often deserves a weaker interpretation.
A retest can clarify acceptance because it shows how price behaves when it returns toward the former boundary. If the old boundary now holds as a reference area and price does not fully re-enter the triangle, the breakout has more support. If the retest turns into a full return inside the range, acceptance is weaker.
Follow-through does not mean a large move must happen immediately. It means the market continues to behave as if the boundary break mattered. Stable holding outside the triangle can be more useful than a sharp candle that reverses immediately.
Common Triangle Breakout Mistakes
The most common mistake is treating the first boundary pierce as confirmation. A line break opens the question; it does not answer it by itself.
Common mistake: Reading a triangle breakout as confirmed before checking acceptance, follow-through, retest behavior, and re-entry. This can turn a normal boundary probe into an overstated breakout interpretation.
Another mistake is ignoring the quality of the triangle. A breakout from clean compression carries more information than a breakout from a pattern where the boundaries were repeatedly violated before the final move.
Volume can also be misread in both directions. Stronger participation can support the breakout, but volume alone does not confirm the whole structure. Weak volume does not automatically invalidate every breakout, but it lowers confidence when acceptance and follow-through are also missing.
Measured moves create a separate risk. The height of the triangle can be used as a rough chart measurement, but that measurement is not an outcome forecast. Treating it as a promised move turns a structural observation into unsupported certainty.
Limitations of Triangle Breakout Readings
Triangle breakout readings are conditional. They can help organize chart behavior, but they do not remove uncertainty or replace broader market context.
The interpretation becomes less reliable when the triangle is drawn from inconsistent swing points, when the breakout appears very late near the apex, when participation fades, or when price quickly returns into the old range.
Direction also needs care. A breakout above an upper boundary can suggest upside acceptance, while a break below a lower boundary can suggest downside acceptance, but neither direction guarantees continuation. Later rejection, news, volatility, or broader market pressure can change the structure after the initial break.
The safer use of a triangle breakout is diagnostic: identify the boundary break, test whether acceptance is present, and keep the failed-breakout path visible until the market proves otherwise.
FAQ
What confirms a triangle breakout?
A triangle breakout is better supported when price breaks the boundary, holds outside the prior compression area, shows follow-through, and avoids quick re-entry. Volume and retest behavior can add evidence, but no single factor confirms the reading by itself.
Is one close outside a triangle enough?
One close outside a triangle can start a breakout reading, but it is often not enough on its own. The reading is stronger when later candles show acceptance beyond the boundary instead of immediately returning inside the pattern.
What is a failed triangle breakout?
A failed triangle breakout occurs when price moves beyond a triangle boundary but then returns inside the prior range and cannot regain the breakout area. The key issue is failed acceptance, not simply that price moved back after the first break.
Does volume matter in triangle breakouts?
Volume matters because it can show participation behind the move. Stronger activity may support the breakout reading, while weak or fading activity can make the move less convincing, especially when follow-through is also missing.
Why do triangle breakouts fail near the apex?
Breakouts near the apex can fail because the range has already compressed so tightly that a small move may cross a boundary without showing real acceptance. The later behavior after the break is usually more important than the line cross itself.
Are triangle measured moves reliable?
Triangle measured moves are rough chart measurements, not reliable outcome forecasts. They can help frame possible range expansion, but acceptance, market context, and later behavior matter more than the measurement alone.