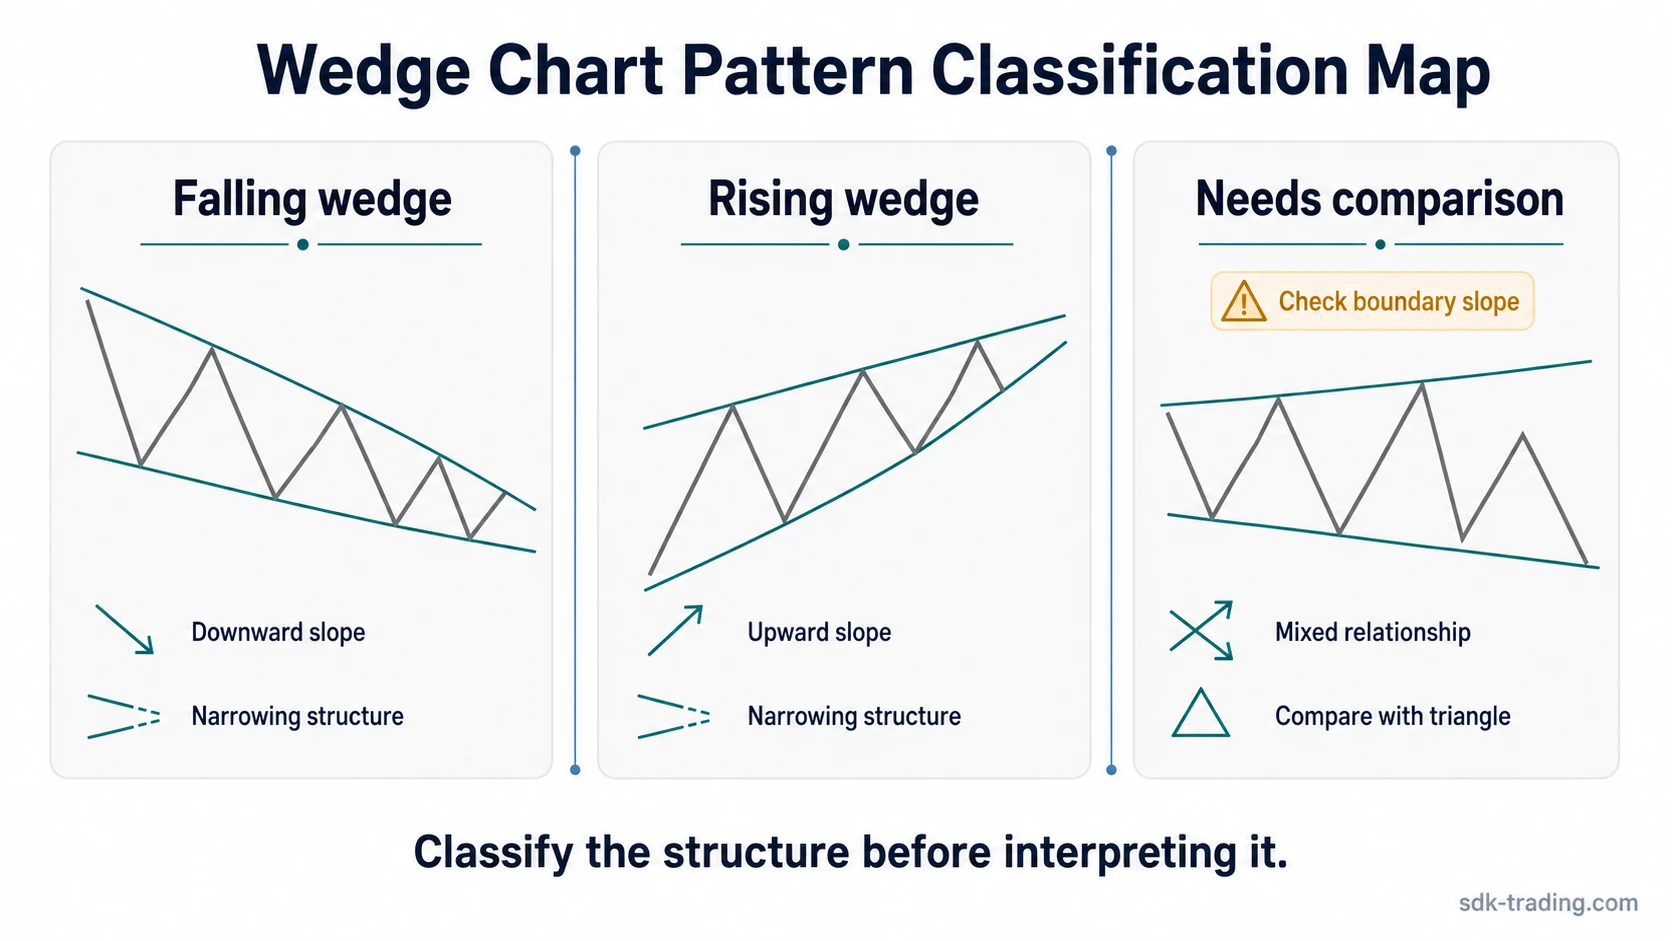
Wedge chart patterns are converging price structures in technical analysis. The useful first distinction is slope: a falling wedge slopes downward, a rising wedge slopes upward, and similar compression may need a triangle comparison before the pattern label is trusted.
Definition: A wedge chart pattern is a narrowing price structure formed by two converging boundaries that usually lean in the same general direction. The label helps classify the structure, but it does not confirm direction, timing, probability, or trade outcome by itself.
The cleanest starting point is structural: identify the boundary slope, separate the wedge type, then check whether the shape is better explained as a wedge, a triangle, or an unresolved compression pattern.
Key Points
- Use a falling wedge reading when both boundaries generally slope downward.
- Use a rising wedge reading when both boundaries generally slope upward.
- Use a wedge-vs-triangle check when price compresses but the boundary relationship is not clearly wedge-shaped.
- Use broader wedge-pattern interpretation only after the structure, context, and later price behavior have been separated.
How Wedge Chart Patterns Are Grouped
Wedge patterns group chart structures by the direction of their converging boundaries. A downward-leaning structure belongs closer to the falling wedge family, while an upward-leaning structure belongs closer to the rising wedge family.
The slope matters because wedge labels can look similar at first glance. A shallow compression, a narrowing pullback, and a triangle-like pause can all appear close on a chart, but they do not describe the same structure.
Classification note: Shape recognition comes before interpretation. A wedge reading becomes more useful only after the structure, boundary behavior, and later price acceptance are checked together.
Which Wedge Pattern Page Should You Read First?
Use this wedge pattern hub as a routing point. If the question is broad, start with the general wedge pattern explanation. If the wedge type is already clear, move directly into the falling wedge or rising wedge page.
| Reader question | Best next page | Why |
|---|---|---|
| What is a wedge pattern in trading? | wedge pattern structure | Use this when the main question is the broader pattern logic, not one specific wedge type. |
| What is a falling wedge pattern? | falling wedge pattern | Use this when both boundaries generally slope downward and the structure needs a dedicated reading. |
| What is a rising wedge pattern? | rising wedge pattern | Use this when both boundaries generally slope upward and the structure needs a dedicated reading. |
| Is this a wedge or a triangle? | wedge vs triangle pattern | Use this when compression is visible but the boundary relationship is not clearly wedge-shaped. |
Choose the Right Wedge Pattern
The first choice is between the two core wedge types. Each one uses converging boundaries, but the slope relationship changes the chart-reading problem.
| Chart structure | Best fit | Use when |
|---|---|---|
| Both boundaries generally slope downward while price compresses. | Falling wedge | The main question is how a downward-leaning compression structure should be identified. |
| Both boundaries generally slope upward while price compresses. | Rising wedge | The main question is how an upward-leaning compression structure should be identified. |
When the Wedge Label Needs a Comparison
Some chart-reading problems are not solved by choosing rising or falling first. The better question may be whether the structure is a wedge at all, or whether two wedge types are being confused.
| Question | Better next check | Why it matters |
|---|---|---|
| The structure is narrowing, but the wedge type is unclear. | compare rising and falling wedge behavior | The comparison separates slope direction, structure quality, and the kind of mislabel that often appears between the two wedge types. |
| The structure compresses, but the boundaries do not lean together cleanly. | Separate wedge structure from triangle structure. | Triangle structures also compress, so the boundary relationship needs to be checked before a wedge label is used. |
| The wedge shape is visible, but the interpretation is still too broad. | Check structure, context, and later acceptance. | A broader structure check helps separate the visual pattern from confirmation, invalidation, and later market behavior. |
Wedge Patterns vs Triangle Patterns
Wedges and triangles can both show compression, but the boundary relationship is different. A wedge usually has two converging boundaries leaning in the same general direction, while a triangle comparison becomes more relevant when the structure is more balanced or the slope relationship is mixed.
The practical mistake is naming every narrowing structure as a wedge before checking the boundary slope. A cleaner reading starts with the geometry, then tests whether later price behavior supports or weakens the reading.
When a Wedge Label Is Not Enough
A wedge label is only a structural reading. It does not confirm direction, timing, probability, or outcome. Later behavior still matters because price can break, fail, reclaim, or continue compressing without making the original reading more reliable.
Limitation: A wedge structure should not be treated as a standalone trade conclusion. The reading is more useful when it is paired with boundary quality, acceptance or rejection around the structure, and clear invalidation of the alternative interpretation.
Simple Wedge Classification Example
Price compresses while each rebound stops lower than the previous rebound and each pullback also stays inside a downward-leaning structure. That geometry belongs closer to a falling wedge reading than a rising wedge reading.
If the same compression begins leaning upward, the rising wedge reading becomes the closer structural fit. If the boundaries converge but neither side leans clearly, the wedge-triangle boundary should be checked before the pattern name is used.