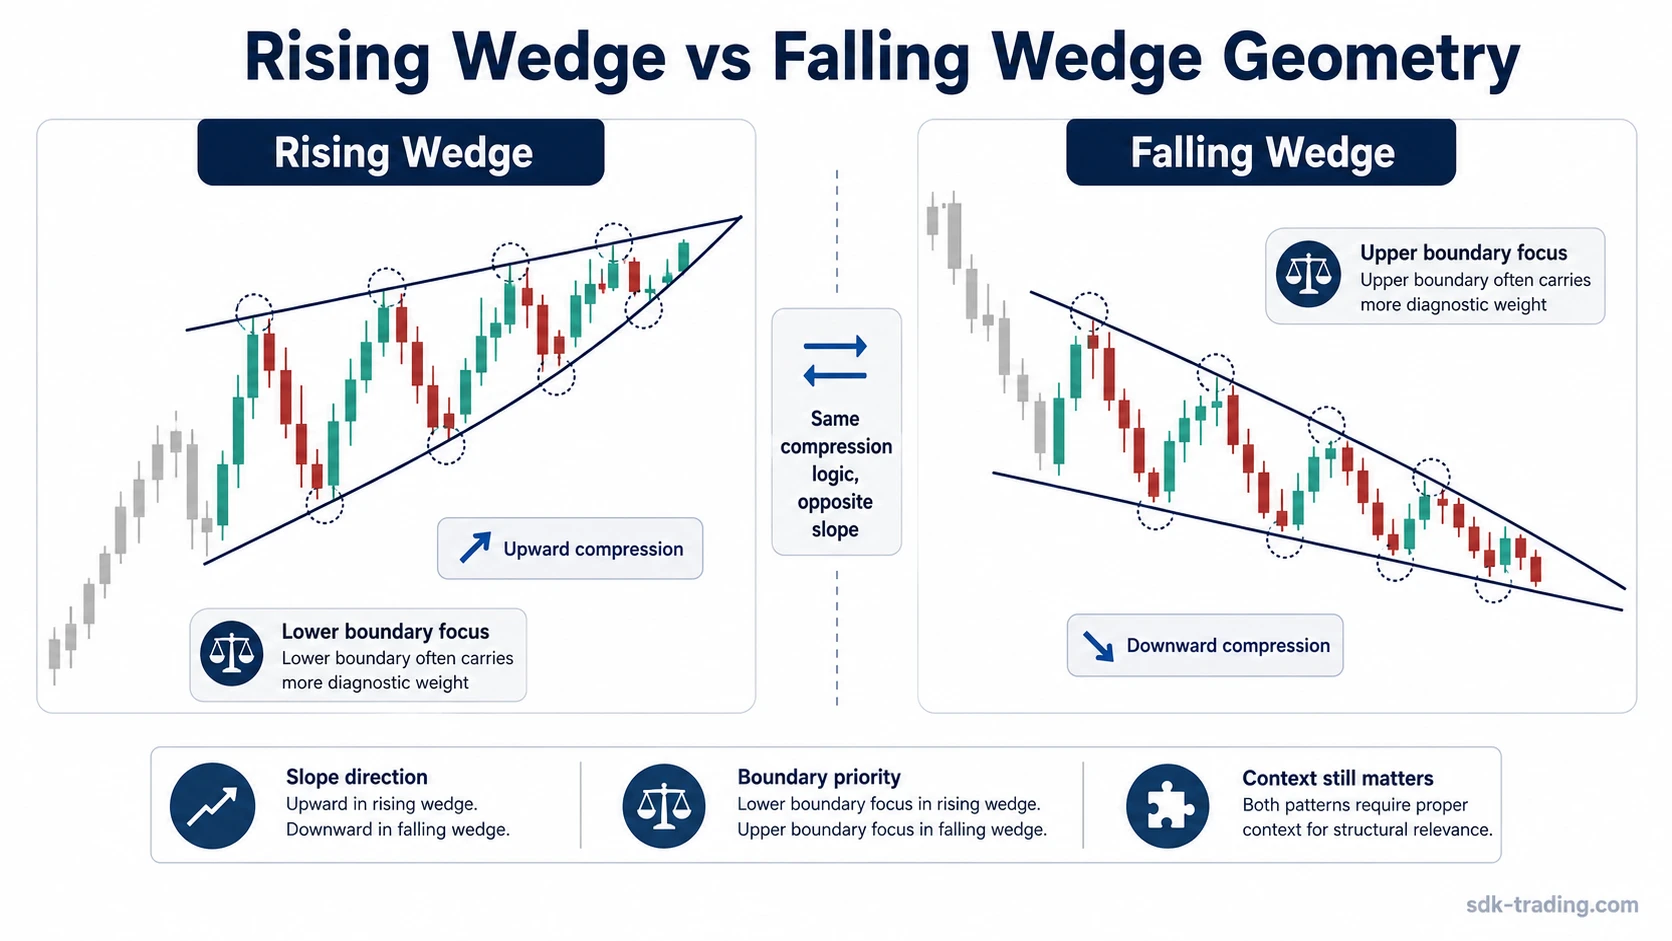
Rising wedge vs falling wedge patterns differ mainly by slope direction, boundary priority, and chart context. A rising wedge compresses price upward between rising, converging boundaries, while a falling wedge compresses price downward between falling, converging boundaries.
The distinction is not only visual. A rising structure usually puts more diagnostic weight on the lower rising boundary and the way price responds after upward compression. A falling structure tends to put more diagnostic weight on the upper falling boundary and the way price responds after downward compression.
Definition: A rising wedge is an upward-sloping compression structure. A falling wedge is a downward-sloping compression structure. Both require converging boundaries, repeated interaction with those boundaries, and enough swing structure to avoid forcing lines onto random price movement.
Key Points
- A rising wedge slopes upward; a falling wedge slopes downward.
- Both patterns narrow as price swings compress between converging boundaries.
- The more important boundary changes with the structure: rising wedges often focus on lower-boundary behavior, while falling wedges often focus on upper-boundary behavior.
- The surrounding move changes the reading, so neither wedge should be treated as a standalone forecast.
- The label becomes less reliable when trendlines are forced, boundary touches are selective, or price quickly returns into the old compression area after a break.
Rising Wedge vs Falling Wedge: The Core Difference
A rising wedge forms when price continues to push higher, but the swings narrow between two upward-sloping boundaries. A falling wedge forms when price continues to push lower, but the swings narrow between two downward-sloping boundaries.
The confusion comes from the shared compression. Both structures can show narrowing volatility, repeated boundary tests, and converging trendlines. The difference is the direction of compression and the boundary that later becomes most important for interpretation.
A rising wedge reading focuses on upward compression, weakening expansion, and how price behaves around the lower boundary.
A falling wedge reading focuses on downward compression, narrowing selling pressure, and how price behaves around the upper boundary.
Rising Wedge vs Falling Wedge Comparison Table
The fastest way to separate the two structures is to compare the mechanism, not only the label. The same narrowing shape can produce a different reading when the slope direction, boundary priority, and surrounding trend are different.
| Comparison point | Rising wedge | Falling wedge | Diagnostic lens |
|---|---|---|---|
| Boundary slope | Both boundaries rise and converge. | Both boundaries fall and converge. | Start with slope direction before assigning meaning. |
| Swing structure | Higher highs and higher lows usually become narrower. | Lower highs and lower lows usually become narrower. | The swings should compress naturally, not require forced trendlines. |
| Boundary priority | The lower rising boundary is often watched for loss of support within the structure. | The upper falling boundary is often watched for acceptance outside downward compression. | The important boundary depends on the wedge direction. |
| Usual interpretation | Often read as weakening upward progress, especially after an advance. | Often read as weakening downward pressure, especially after a decline. | The word “often” matters because market context can alter the reading. |
| Continuation or reversal context | Can appear as a continuation or reversal structure depending on the preceding move. | Can appear as a continuation or reversal structure depending on the preceding move. | Do not assign bullish or bearish meaning from the wedge label alone. |
| Weak reading | Weakens if the upper and lower boundaries are nearly parallel, or if only one side has meaningful interaction. | Weakens if the decline does not compress, or if the upper boundary is drawn through selective points. | Clean convergence is more important than making the pattern fit. |
| What to check next | Check whether price loses the rising support area or remains accepted inside the structure. | Check whether price holds outside the falling resistance area or returns into compression. | Acceptance around the tested line matters more than a single wick or one isolated candle. |
Boundary Geometry: Upward Compression vs Downward Compression
In a rising wedge, price is still moving higher, but each push tends to cover less distance. The upper boundary rises, the lower boundary also rises, and the distance between them contracts. That narrowing distance is the structural feature that separates a wedge from a simple channel.
In a falling wedge, price is still moving lower, but each downward swing tends to lose momentum inside a narrowing range. The upper boundary falls, the lower boundary also falls, and the space between them contracts as the structure develops.
A clean wedge needs more than two convenient points. The boundaries should describe repeated price behavior, not a line drawn after the fact to force a label. If the boundaries are almost parallel, the structure may be closer to a channel. If the boundaries barely interact with price, the wedge reading remains weak.
Why Traders Confuse Rising and Falling Wedges
Rising and falling wedges are easy to confuse because both are compression patterns. Each can show smaller swings, contracting volatility, and trendlines that move toward each other. The shared feature is narrowing structure; the separating feature is the direction of that narrowing.
Another common confusion is treating the pattern name as a complete interpretation. A rising wedge is not automatically useful without context, and a falling wedge is not automatically useful without later boundary response. The label only describes the structure. The interpretation comes from trend context, boundary quality, and what price does after testing the structure.
Diagnostic note: A wedge reading is more defensible when the slope, convergence, swing sequence, and boundary interaction all point to the same structure. It becomes less reliable when one of those elements is missing or forced.
Same Compression, Different Meaning
Price advances into a prior resistance area and begins to narrow. If the swings continue to make higher highs and higher lows while both boundaries rise, the structure is closer to a rising wedge. The question becomes whether upward progress is losing quality and whether the lower rising boundary remains respected.
Price can also compress after a decline into the same broad chart area. If the swings continue to make lower highs and lower lows while both boundaries fall, the structure is closer to a falling wedge. The question changes: the upper falling boundary becomes more important because price must show whether movement outside the old downward compression is accepted or quickly rejected back inside the structure.
The same broad market area can therefore produce two different readings. The difference is not the location alone. It is the direction of compression, the swing sequence, and which boundary later controls the interpretation.
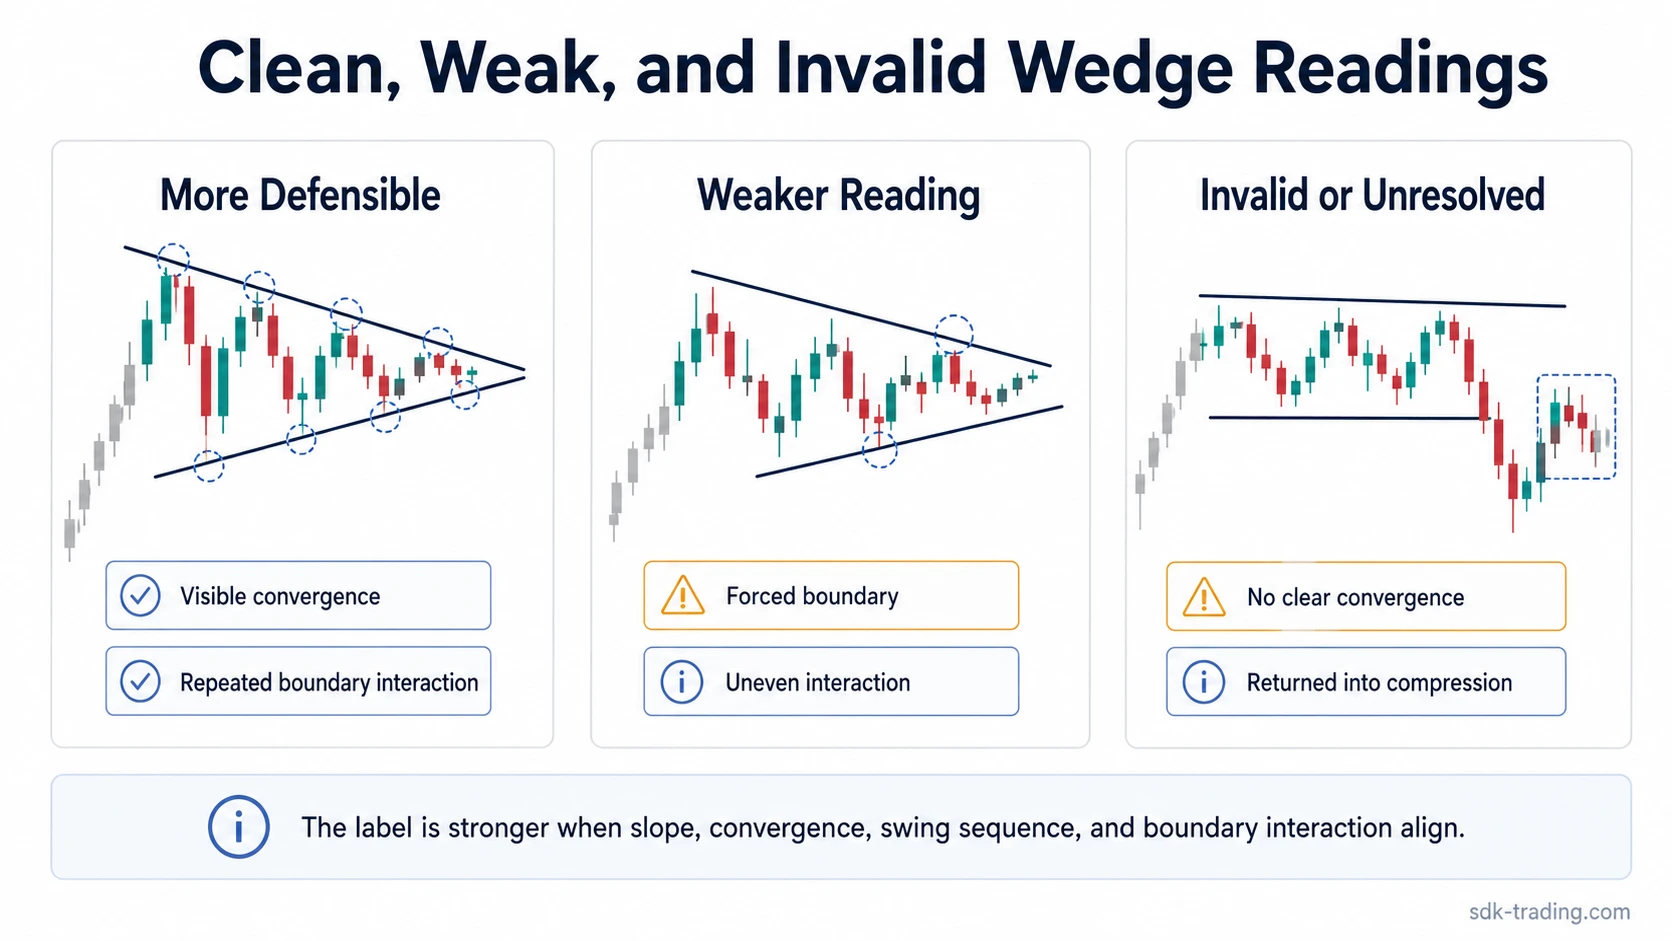
Clean, Weak, and Invalid Wedge Readings
A clean comparison starts by separating structure quality from later boundary response. A wedge can be structurally clean and still unresolved. It can also break a boundary without producing a durable interpretation if price quickly returns into the compression area.
| Reading quality | What it looks like | How to treat the interpretation |
|---|---|---|
| Clean | Clear slope direction, visible convergence, repeated interaction with both boundaries, and a coherent swing sequence. | The pattern label is more defensible, but later boundary response still matters. |
| Weak | Trendlines fit only selected points, one boundary has little interaction, or the structure looks more like a channel than a wedge. | The label should stay tentative because the structure may be overfitted. |
| Invalid | Boundaries do not converge, price no longer respects the shape, or the supposed break quickly returns into the old compression area. | The wedge reading should be dropped or treated as unresolved until clearer structure appears. |
Limitation: A single boundary break does not settle the reading by itself. The next response around the old wedge area is often more informative than the first touch, wick, or close outside a line.
Continuation, Reversal, and Context
Rising and falling wedges are often discussed through bullish or bearish labels, but that shortcut can create weak analysis. The same shape may appear during a larger continuation move or near a possible reversal area. Context determines whether the structure is acting as a pause, a loss of momentum, or an unresolved compression.
A rising wedge after an extended advance may suggest that upward progress is becoming less efficient. A rising wedge inside a larger decline can carry a different meaning if it behaves like a corrective rally. A falling wedge after a decline may suggest that downward pressure is narrowing. A falling wedge inside a larger advance can act differently if it is only a pullback structure.
The safer reading is conditional: identify the wedge, check whether the boundaries are clean, compare the structure with the surrounding trend, then watch whether later price behavior confirms or weakens the interpretation.
Common Mistakes When Comparing Rising and Falling Wedges
Mistake 1: Treating slope alone as enough. Slope direction separates rising from falling wedges, but convergence and repeated boundary interaction are still required.
Mistake 2: Drawing trendlines after the fact. A wedge should describe visible price behavior. If the lines need selective points to work, the pattern may be weak or invalid.
Mistake 3: Turning the pattern into a forecast. Wedge labels describe compression. They do not guarantee continuation, reversal, or directional follow-through.
Mistake 4: Ignoring failed boundary response. A break that quickly returns into the old wedge area can leave the structure unresolved instead of confirming a clean reading.
When Each Wedge Label Fits Better
Use the rising wedge label when the structure compresses upward, both boundaries rise, the swings narrow, and the lower boundary becomes the main support reference inside the pattern. Use the falling wedge label when the structure compresses downward, both boundaries fall, the swings narrow, and the upper boundary becomes the main resistance reference inside the pattern.
If the structure is narrowing but the slope direction is unclear, delaying the label is usually cleaner. If price action does not respect either boundary, the pattern may not be a wedge at all. A delayed label is often safer than forcing a clean pattern name onto unclear structure.
FAQ
What is the main difference between a rising wedge and a falling wedge?
A rising wedge compresses upward between rising, converging boundaries. A falling wedge compresses downward between falling, converging boundaries. The difference changes the swing structure, boundary priority, and later interpretation.
Are rising wedges always bearish and falling wedges always bullish?
No. Those labels are common shortcuts, but the interpretation depends on trend context, boundary quality, and later price behavior. A wedge should not be treated as a standalone directional forecast.
Why do rising and falling wedges look similar?
They look similar because both use converging boundaries and narrowing swings. The separating feature is slope direction: rising wedges compress upward, while falling wedges compress downward.
What makes a wedge reading weak?
A wedge reading weakens when the trendlines are forced, the boundaries do not converge clearly, one side has little interaction, or price quickly returns into the old compression area after a boundary break.
Can a wedge fail after breaking a boundary?
Yes. A boundary break can fail if price quickly moves back into the old compression area. In that case, the structure may remain unresolved or the wedge interpretation may need to be dropped.