A falling wedge is a chart pattern where price moves lower between two downward-sloping, converging boundaries while each swing becomes narrower. The pattern is defined by structure first: lower reaction highs, lower reaction lows, contraction in the trading range, and repeated interaction with both boundaries.
The falling wedge pattern can appear after a decline or inside a larger advance. Its label does not decide direction by itself. Interpretation depends on whether the boundaries are real, whether contraction is visible, and whether later price behavior holds outside the old structure or returns back into it.
Definition: A falling wedge is a downward-sloping, contracting chart pattern formed by two converging trendlines. It shows a declining price path with narrowing swings, not simply any market that moves lower.
Key Points
- A falling wedge forms when price declines inside two downward-sloping, converging boundaries.
- The pattern depends on narrowing swings, not only a falling price path.
- It can appear in reversal or continuation context, so direction should not be assumed from the label alone.
- A boundary break becomes more meaningful only if later behavior shows acceptance outside the old compression area.
- Forced trendlines, widening swings, or fast re-entry into the wedge weaken the reading.
What Is a Falling Wedge?
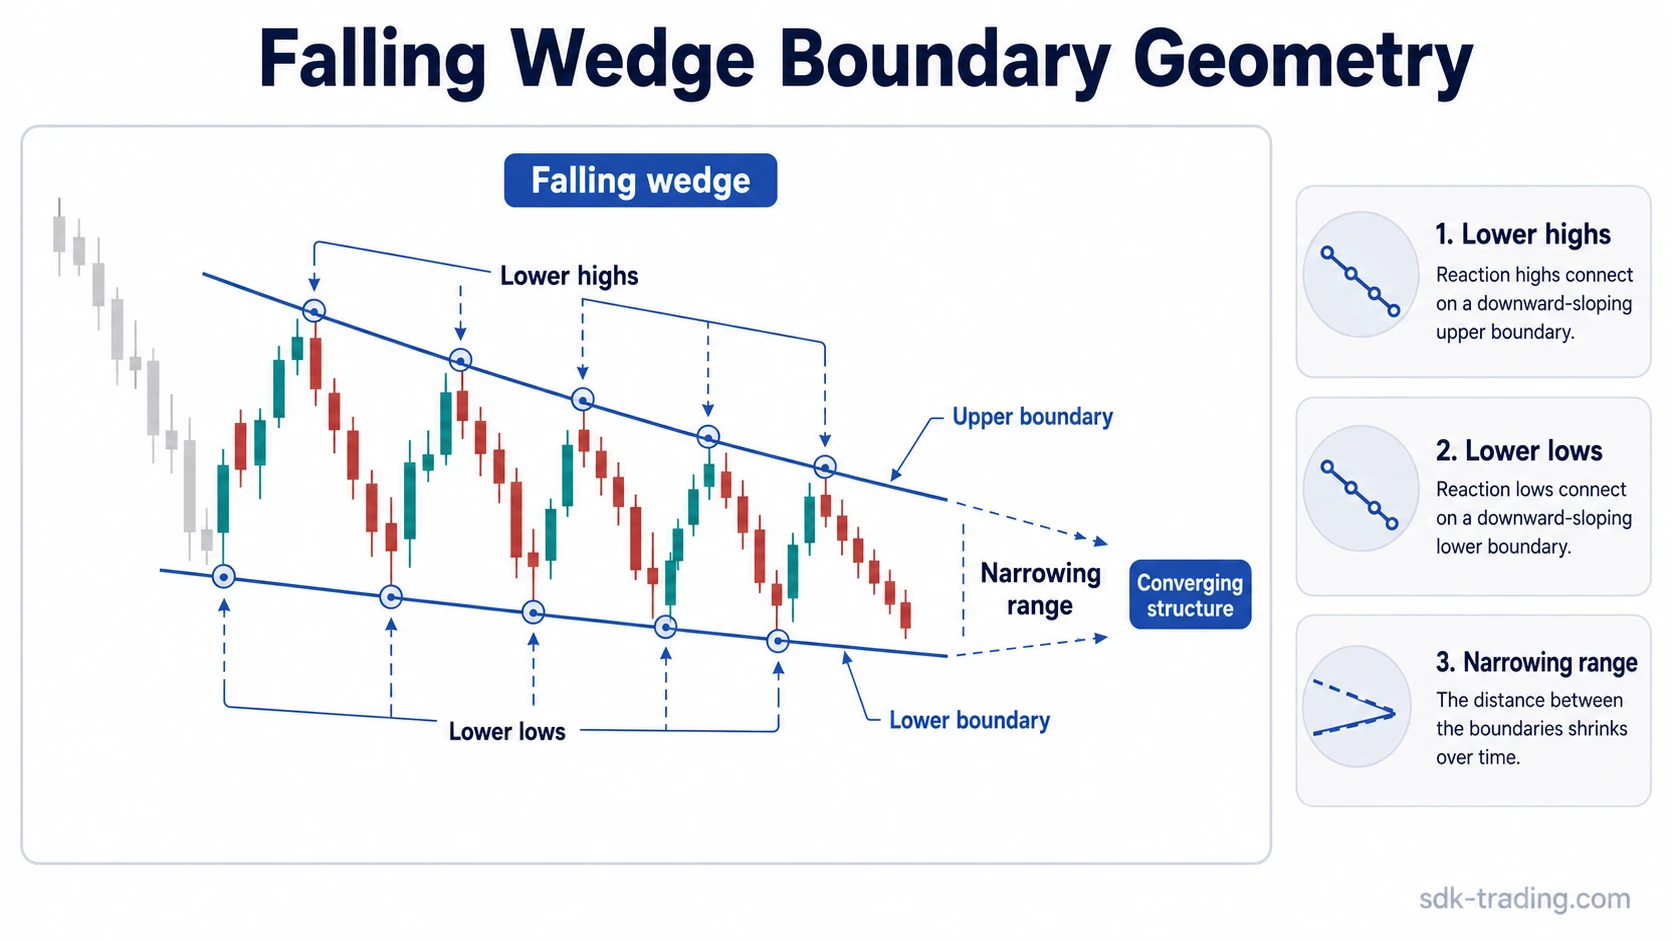
A falling wedge is a technical analysis pattern built from contracting price movement. The upper boundary slopes downward through lower reaction highs, and the lower boundary also slopes downward through lower reaction lows. Because the two boundaries converge, the distance between swings becomes smaller as the pattern develops.
The important feature is contraction. A descending channel can also move lower, but its boundaries usually remain more parallel. A falling wedge needs visible narrowing. Without a shrinking range, the structure is closer to ordinary downward channel behavior than a wedge.
The pattern is often discussed as a bullish reversal candidate after a decline, but that framing is incomplete. A falling wedge can also develop as a continuation structure after a prior advance. Classification and later boundary behavior should be separated: the wedge label describes structure, while the later reaction tests whether price has gained acceptance outside its boundaries.
Falling Wedge Structure and Boundary Geometry
A valid falling wedge starts with boundary geometry. Both trendlines slope downward, but the upper line typically falls faster than the lower line. That difference creates convergence. Price continues to make lower highs and lower lows, yet each push covers less distance than the earlier swing.
The shape becomes easier to read when price interacts with both sides more than once. One reaction high and one reaction low are not enough to prove a wedge. Several visible reactions help show that price is contracting between two active boundaries rather than drifting lower without a defined structure.
| Structure element | What to observe | Why it matters |
|---|---|---|
| Upper boundary | A downward-sloping line across lower reaction highs | Shows that rallies are still being capped while the pattern develops |
| Lower boundary | A downward-sloping line across lower reaction lows | Shows that price is still declining, but inside a visible boundary |
| Convergence | The two boundaries move closer together | Separates wedge contraction from a parallel descending channel |
| Swing contraction | Later swings cover less distance than earlier swings | Supports the idea that downside movement is narrowing inside the structure |
| Reaction quality | Price respects both boundaries without excessive line forcing | Reduces the risk of drawing a wedge around random noise |
How to Identify a Falling Wedge Pattern
Identification starts with the visible price path. Price should be moving lower, but not in a wide, uncontrolled decline. The pattern should show lower highs and lower lows that become progressively tighter as the two boundaries converge.
A clean falling wedge usually has several observable traits. The upper boundary connects meaningful reaction highs. The lower boundary connects meaningful reaction lows. The space between those lines narrows. Later swings lose range compared with earlier swings. The shape should still be visible without moving the trendlines around every minor candle.
Diagnostic sequence: first check boundary slope, then convergence, then swing contraction, then reaction quality. Only after structure is established does later breakout behavior become useful to interpret.
A slope-quality filter helps prevent weak labels. If the lower boundary falls at nearly the same angle as the upper boundary, the market may be forming a descending channel. If the trendlines are drawn through isolated spikes while most price action ignores them, the wedge reading is weaker. If the structure widens instead of narrows, it is no longer a falling wedge.
Clean, Weak, and Invalid Falling Wedge Readings
A falling wedge reading becomes more useful when the structure can be tested. The label is strongest when the boundaries, reactions, and later behavior all point to contraction. It becomes weaker when the chart requires selective line placement or when price returns into the old structure too quickly after a break.
| Reading type | Observed behavior | Diagnostic implication |
|---|---|---|
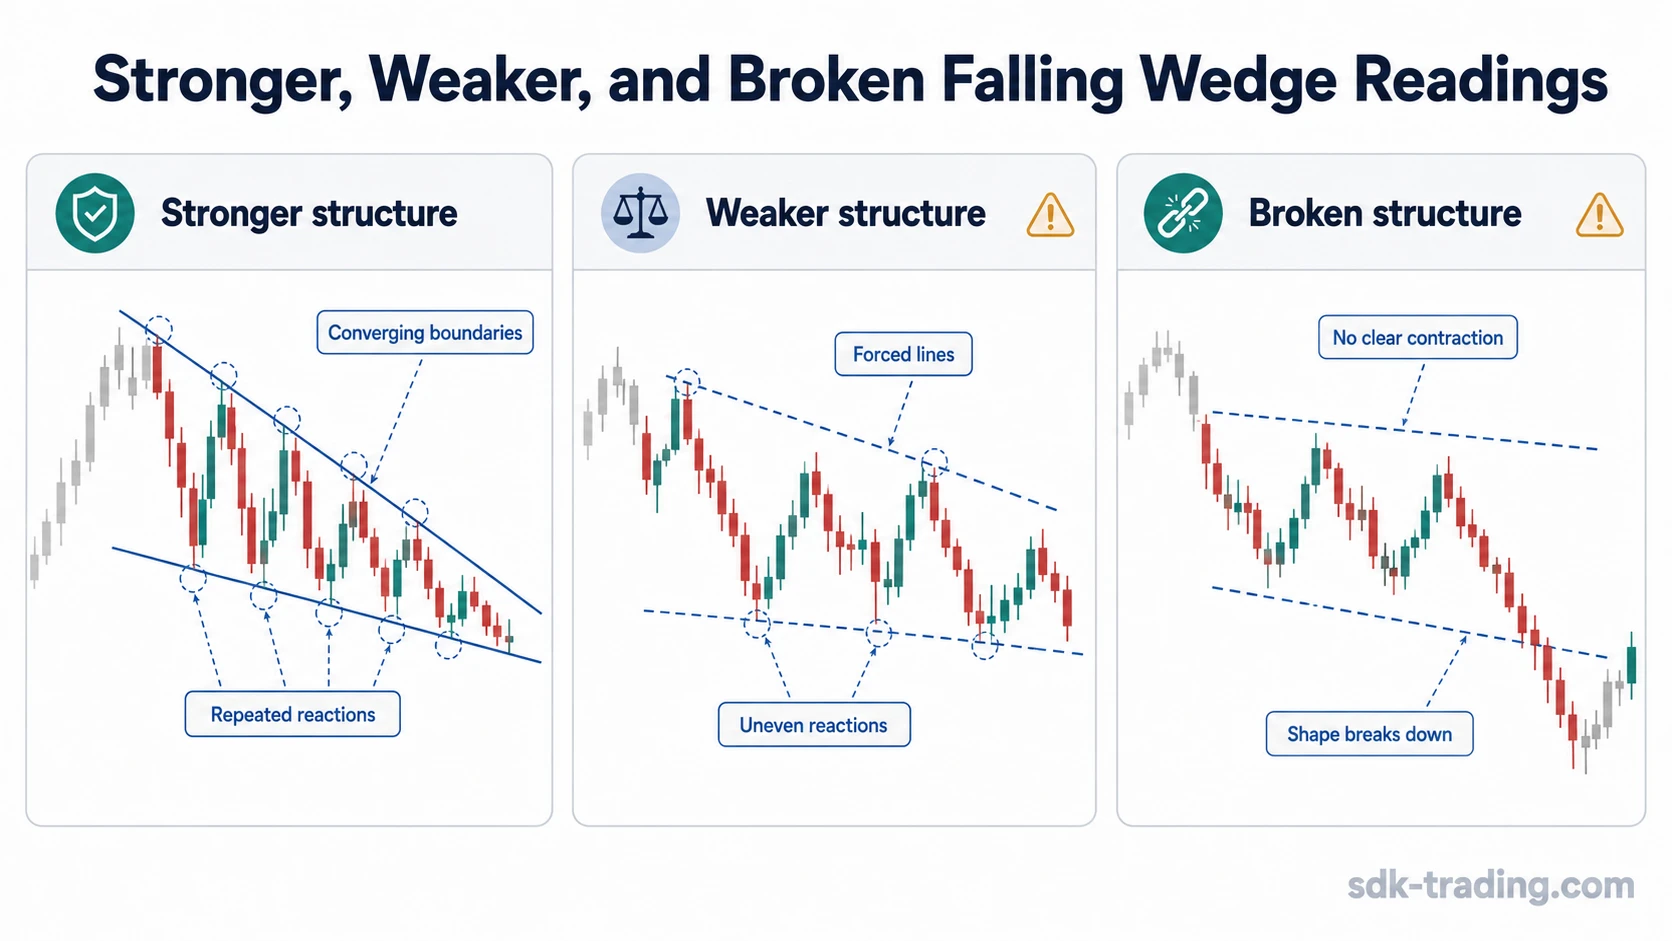
| Clean falling wedge | Two downward-sloping boundaries converge, swings narrow, and price reacts several times near both boundaries | The structure is easier to classify as a contracting wedge |
| Weak falling wedge | Trendlines depend on selective highs or lows, reactions are uneven, or price action looks more like a broad channel | The pattern label may be forced and should be treated cautiously |
| Invalid structure | Boundaries do not converge, swings widen, or price no longer respects either side | The falling wedge classification breaks down |
| Failed boundary behavior | Price breaks outside the wedge but quickly returns into the old compression area | The boundary break has not shown acceptance outside the structure |
The initial shape classifies the pattern; later boundary behavior tests whether the break actually changed the prior compression. A wedge that looks clean before a break can still become less useful if the move outside the boundary is immediately rejected.
Falling Wedge Breakout Acceptance and Failure
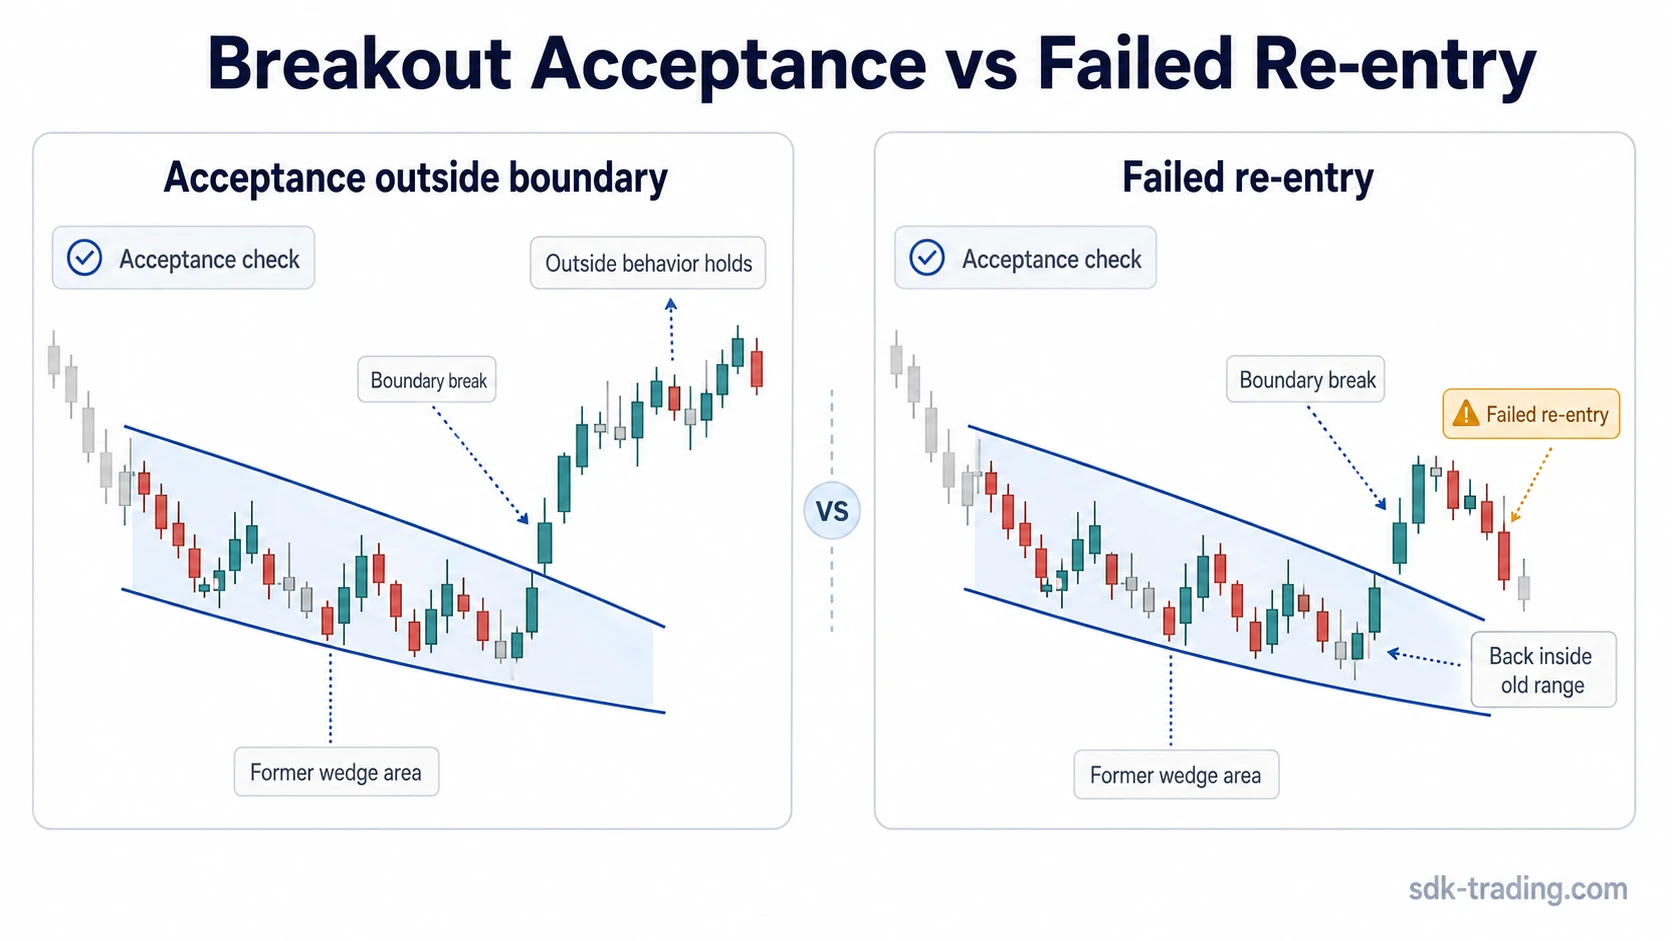
A falling wedge breakout is a move outside one of the pattern boundaries. The break itself is only the first event. The more important diagnostic question is whether price behavior accepts the area outside the wedge or returns back into the old compression zone.
A break shows that the boundary has been tested. Acceptance requires later behavior outside the former wedge area; a fast return inside the structure weakens the breakout reading.
| Stage | What happens | How to read it |
|---|---|---|
| Boundary test | Price reaches or slightly crosses the upper or lower wedge boundary | The structure is being tested, but the result is not clear yet |
| Outside behavior | Price spends time outside the former wedge area | The break starts to show acceptance if the market does not quickly return |
| Throwback or pullback test | Price retests the old boundary area from the outside | The retest can clarify whether the boundary has changed role |
| Failed breakout re-entry | Price breaks outside the wedge, then moves back into the old wedge area soon after the break | The breakout reading weakens because acceptance outside the structure did not hold |
Limitation: A breakout candle should not be treated as a complete reading. The structure describes contraction; later behavior tests whether the market has accepted movement outside that contraction.
Falling Wedge as Reversal or Continuation
A falling wedge can appear in different market contexts. After a sustained decline, it may be read as a possible reversal structure because downside swings are contracting while price continues to drift lower. Inside a larger advance, it may act as a continuation structure if the decline represents a contracting pause within the broader upward move.
The context changes the interpretation, but it does not remove the need for structure. The same label is weaker if the boundaries are poorly formed, the swing range is not contracting, or the move outside the wedge fails quickly.
| Context | Typical reading | What still needs checking |
|---|---|---|
| After a decline | Possible reversal structure if selling pressure appears to contract | Boundary quality, swing contraction, and later acceptance outside the wedge |
| Inside a larger advance | Possible continuation pause if the pullback contracts rather than expands | Whether the broader structure still supports continuation and whether the wedge remains clean |
| Inside sideways movement | Often less clear, especially if boundaries are forced | Whether the pattern has enough slope and convergence to justify the label |
Falling Wedge vs Rising Wedge, Triangle, and Descending Channel
A falling wedge should be separated from nearby chart structures. A rising wedge also uses converging boundaries, but its structure slopes upward instead of downward. The direction of the boundaries changes the chart geometry and the type of contraction being analyzed.
Broader wedge patterns explained through convergence and contraction can clarify the shared mechanics, while the falling wedge remains a specific downward-sloping structure.
| Nearby structure | Main difference | Classification cue |
|---|---|---|
| Rising wedge | Both boundaries slope upward instead of downward | Contraction occurs while price rises, not while price declines |
| Triangle | Triangle boundaries may be flat, rising, falling, or symmetrical depending on the type | The structure is classified by its own boundary relationship, not by wedge slope alone |
| Descending channel | Boundaries usually remain more parallel | A channel lacks the same degree of convergence and swing contraction |
| Ordinary pullback | May decline without forming clean boundaries | No wedge label is needed if contraction is not visible |
Common Mistakes With Falling Wedge Patterns
One common mistake is calling every downward consolidation a falling wedge. A market can decline in a channel, move sideways with a slight downward bias, or chop lower without forming real convergence. A falling wedge needs boundary contraction.
Another mistake is forcing trendlines around noise. If a boundary only works after excluding several meaningful reactions, the structure may be less reliable as a classification tool. The cleaner reading usually comes from obvious reactions that do not require repeated adjustment.
A third mistake is assuming that every break above the upper boundary is accepted. Price can move outside the wedge and then return into the old compression area. That return changes the reading because the market has not held outside the prior structure.
The broadest mistake is treating the pattern label as a trading decision. The falling wedge label can organize observation, but it does not replace risk definition, broader market context, or later evidence from price behavior.
Falling wedge example in context: Price declines through a series of lower highs and lower lows while each swing becomes smaller. The upper boundary and lower boundary both slope down, and the distance between them narrows. Price then moves above the upper boundary but quickly slips back into the old compression area. The structure may still have looked like a falling wedge, but the breakout reading weakens because acceptance outside the wedge did not hold.
FAQ
What is a falling wedge?
A falling wedge is a chart pattern where price declines between two downward-sloping, converging boundaries while the swing range contracts. It is defined by lower highs, lower lows, and narrowing price movement.
Is a falling wedge bullish or bearish?
A falling wedge is often treated as a bullish candidate after a decline, but it is not automatically bullish. It can also appear as a continuation structure, and the reading depends on boundary quality and later price behavior.
How do you identify a falling wedge pattern?
Look for two downward-sloping boundaries that converge, repeated reactions near both boundaries, lower highs and lower lows, and a narrowing swing range. If the boundaries are parallel or forced, the label is weaker.
What makes a falling wedge breakout stronger?
A falling wedge breakout becomes stronger when price behavior holds outside the old compression area instead of quickly returning into the wedge. The boundary break alone is not the full reading.
What invalidates a falling wedge reading?
The reading weakens or fails when the boundaries do not converge, swings widen instead of contract, price ignores the trendlines, or a breakout quickly returns into the old wedge area.
How is a falling wedge different from a descending channel?
A falling wedge has converging boundaries and shrinking swings. A descending channel usually has more parallel boundaries, so price declines without the same visible compression.