A rising wedge is a trading chart pattern where price moves higher between two upward-sloping boundaries that converge as the range narrows.
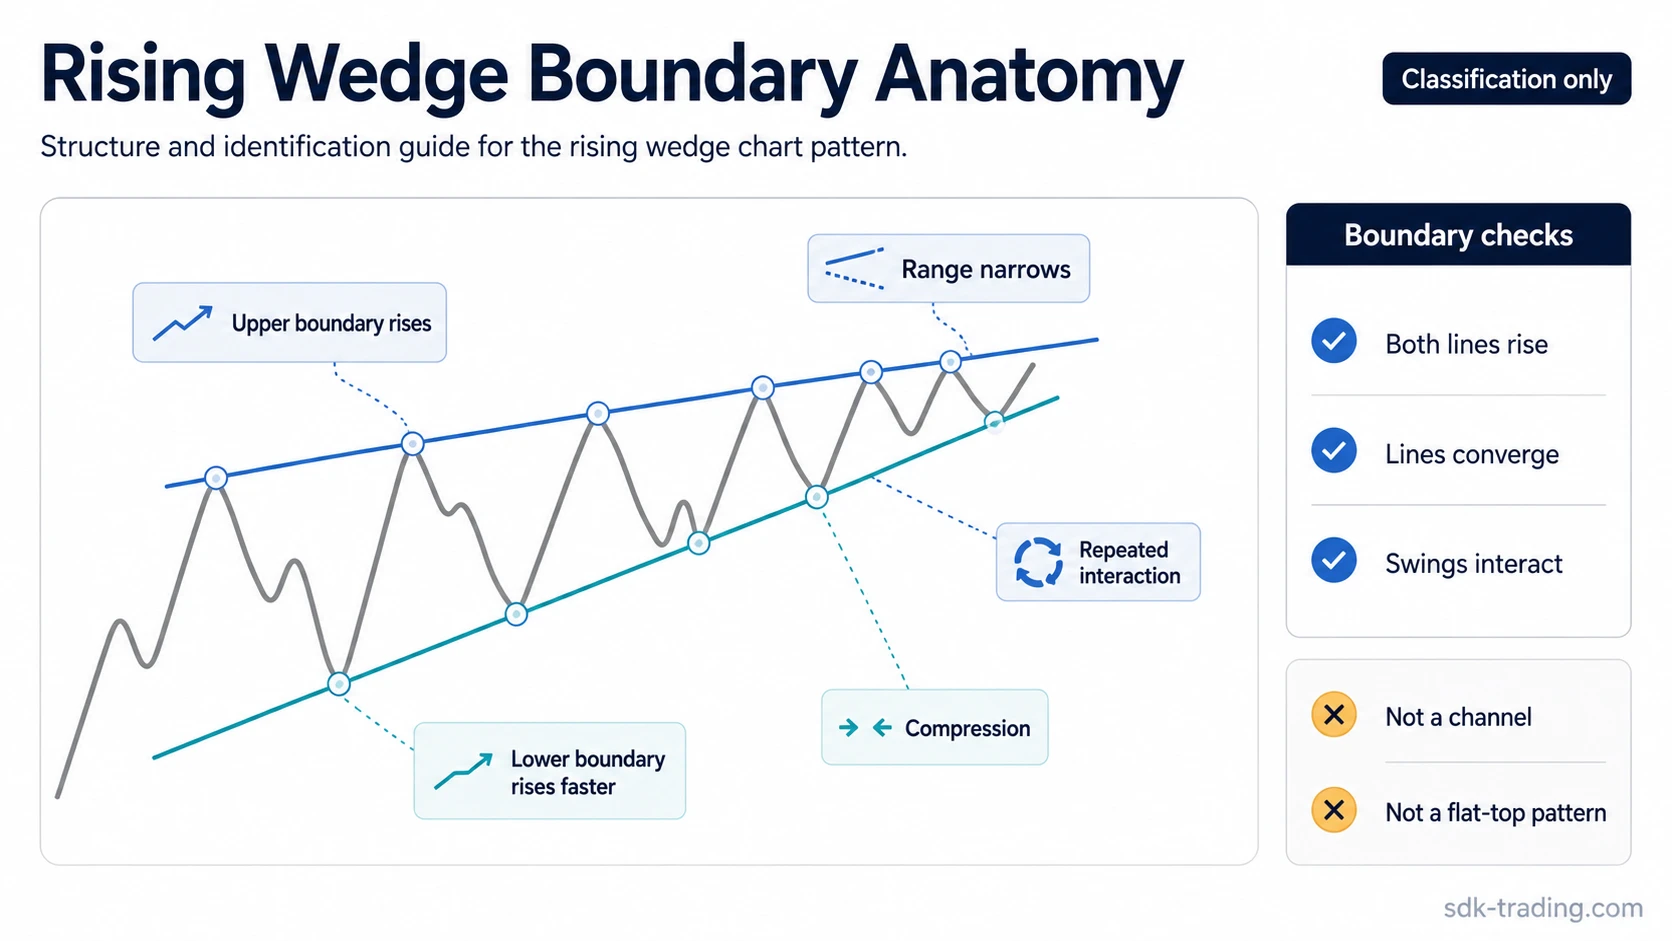
The structure usually shows higher highs and higher lows, but the lower boundary often rises faster than the upper boundary. That slope relationship separates a rising wedge from a simple upward channel, while the rising upper boundary separates it from an ascending triangle. The pattern describes compression and possible momentum loss; it does not define a trade, outcome, or fixed direction.
Definition: A rising wedge is an upward-sloping compression pattern formed by two rising trendlines that move toward each other. A cleaner reading has repeated interaction with both boundaries, narrowing space between swings, and a visible slope difference between the lower and upper line.
Key Points
- A rising wedge needs two upward-sloping boundaries, not just one rising line.
- The lower boundary usually climbs faster than the upper boundary, creating convergence.
- The pattern can appear after an advance or inside a larger correction, so direction is context-dependent.
- A weak reading often comes from parallel lines, a flat top, too few touches, or repeated line redrawing.
- A boundary break opens a new classification question; re-entry, failed reclaim, or expansion outside the structure shapes the next reading.
What Is a Rising Wedge?
A rising wedge belongs to the chart-pattern family of compression structures. Price continues to push upward, but each new swing has less room to expand because the upper and lower boundaries move closer together.
The pattern is often associated with fading upward momentum because buyers keep lifting the market while the advance becomes narrower. That does not make every rising wedge automatically bearish. The structure only says that the rally is compressing; the response around the boundaries decides whether the reading remains useful, weakens, or changes into another structure.
What a Rising Wedge Is Not
A rising wedge is not any rising market, any upward channel, or any sequence of higher highs and higher lows. The label needs convergence. Without narrowing space between the boundaries, the structure is usually better treated as a channel, trend leg, or loose rally.
| Structure | Boundary behavior | Why it differs from a rising wedge |
|---|---|---|
| Rising wedge | Both boundaries rise and move closer together | Upward movement compresses as the lower line advances faster than the upper line |
| Upward channel | Both boundaries rise but remain broadly parallel | Parallel spacing shows trend continuation structure rather than wedge compression |
| Ascending triangle | Upper boundary is flat or nearly flat while the lower boundary rises | The pattern tests a horizontal ceiling instead of two rising converging lines |
| Loose rising price action | Swings rise without stable boundaries | The pattern lacks enough repeated boundary interaction to support a wedge label |
A falling wedge uses the same compression logic in the opposite direction: both boundaries slope downward instead of upward.
How to Identify a Rising Wedge
A rising wedge becomes more defensible when several structural features appear together. One feature alone is usually too weak because a rising market can create many temporary lines that do not form a real pattern.
| Identification check | What to look for | Weak reading warning |
|---|---|---|
| Two rising boundaries | Both the upper and lower trendlines slope upward | Only one clear line is visible |
| Convergence | The distance between boundaries narrows over time | The lines stay parallel or widen |
| Slope-quality filter | The lower boundary rises faster than the upper boundary | The upper boundary is flat, unclear, or repeatedly redrawn |
| Repeated swings | Price interacts with both sides more than once | The label depends on one or two isolated candles |
| Compression behavior | Swings become tighter as price advances | The move keeps expanding cleanly without compression |
The best structural test is simple: remove the label and look only at the boundaries. If the rising lines do not clearly converge, the wedge reading is probably premature.
Why the Rising Wedge Structure Forms
A rising wedge can form when price keeps advancing but each push produces less separation from the prior swing. Buyers may still be active, yet the market has less room to expand before meeting resistance along the upper boundary.
The lower boundary is important because it often rises faster than the upper boundary. That creates pressure inside the structure. The pattern becomes less about the fact that price is moving higher and more about whether the move still has enough expansion behind it.
Volume may add context if activity fades during the compression or expands around a boundary break, but volume alone does not validate the pattern. Boundary quality, swing interaction, and acceptance outside the former boundary carry more classification weight than a single volume reading.
Clean, Weak, and Invalid Rising Wedge Readings
A useful rising wedge classification separates the label from the quality of the structure. The same drawing can look convincing at first and then weaken if price stops respecting the boundaries or if the lines have to be adjusted repeatedly.
| Reading quality | Typical structure | Diagnostic interpretation |
|---|---|---|
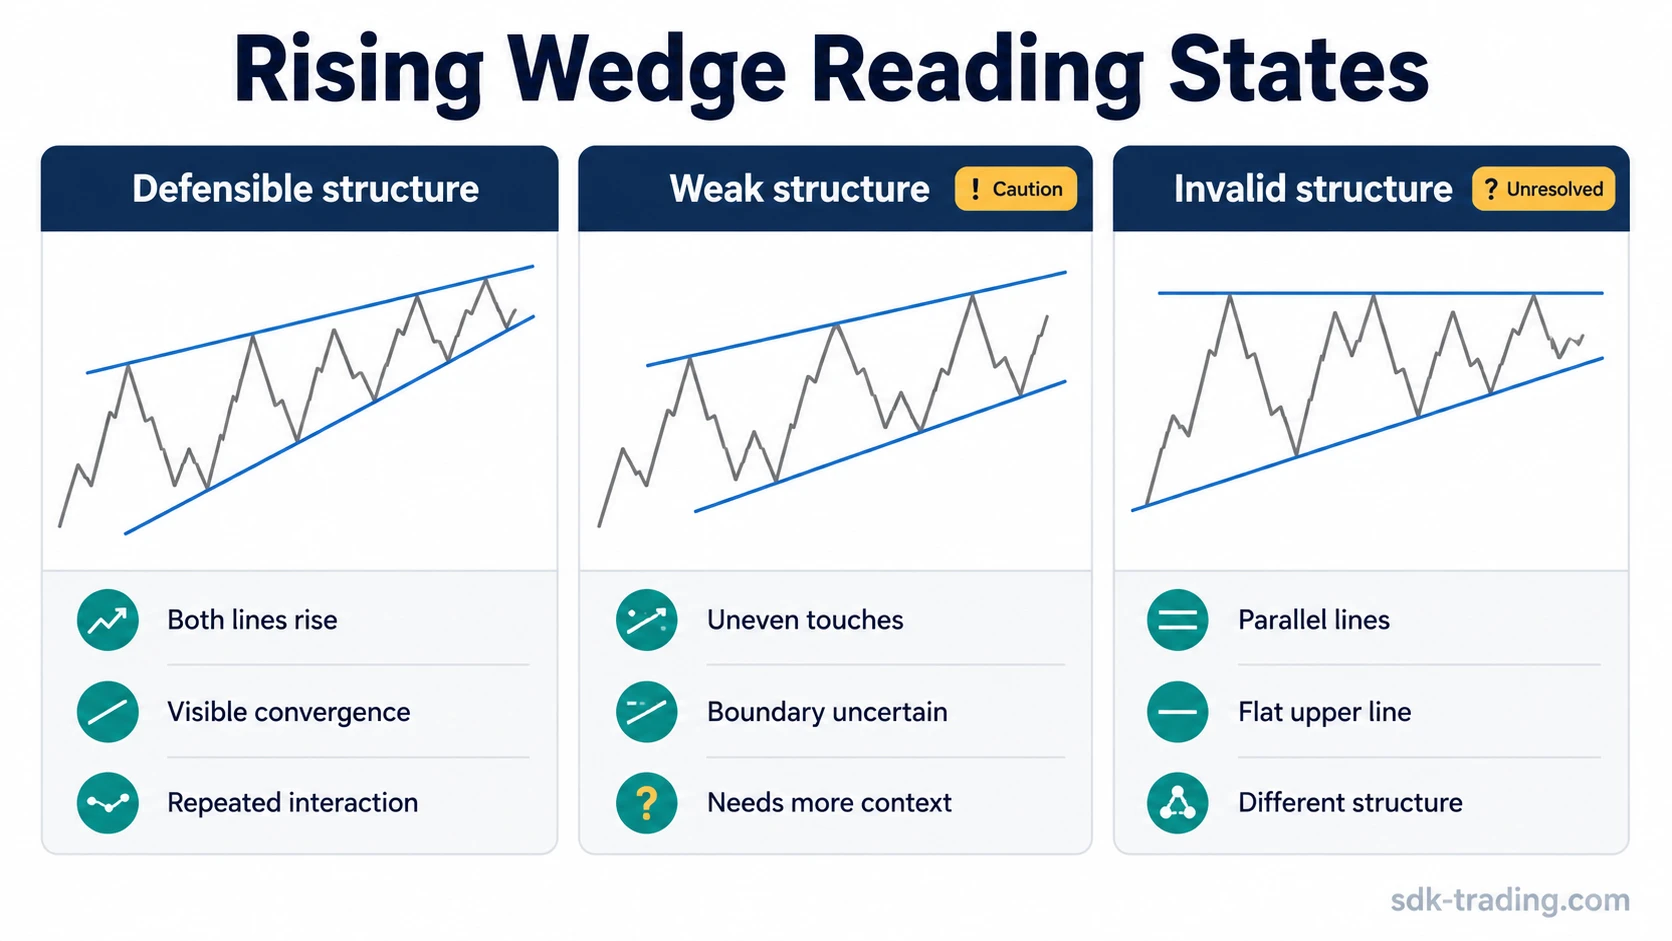
| Clean rising wedge | Two rising converging boundaries, repeated swing interaction, lower line rising faster than the upper line | The label is structurally defensible, but direction still depends on how price behaves around the boundaries |
| Weak rising wedge | Some convergence appears, but touches are uneven, the pattern is noisy, or one boundary is uncertain | The idea may be worth monitoring, but the structure is not clean enough to carry much interpretive weight |
| Invalid rising wedge | Lines are parallel, the upper boundary is flat, there is no narrowing range, or too few valid touches exist | The structure should be classified as another pattern or left unresolved instead of forced into a wedge label |
Diagnostic note: A boundary break shows that the structure is changing. It does not prove the quality of the next move. Re-entry into the wedge, failure to hold the new area, or expansion into a wider pattern can all change the interpretation.
Break Direction and Context
Rising wedges are commonly discussed with bearish reversal context, especially after a strong advance. That association should stay conditional. The pattern can also appear as a continuation or corrective structure inside a larger trend, and the first break may fail to hold.
A downward break can suggest that the compression is resolving lower, but the follow-through still matters. If price quickly re-enters the wedge or fails to expand away from the boundary, the initial break remains unresolved. If price accepts below the lower boundary and recovery attempts stall near the broken line, the wedge reading becomes more coherent as a failed upward-compression structure.
An upward break is also possible. It may show that the compression did not produce rejection, or that the structure was mislabeled. A clean upward expansion can turn attention away from wedge failure and toward a different market structure.
Rising Wedge Example in Context
Price advances into a prior resistance area and starts forming higher highs and higher lows. The upper boundary still rises, but each push above the prior swing becomes smaller. The lower boundary climbs more aggressively, compressing the range from below.
The reading is tempting because price is still moving higher while the structure narrows. It remains incomplete if the boundaries have only one or two touches or if the upper line has to be redrawn after every new swing.
A stronger case develops when several swings interact with both sides and the lower boundary breaks with price failing to reclaim the former compression area. A weaker case develops when price slips outside the line, quickly re-enters, and continues to move sideways or upward without accepting the break. The classification remains structural: does price accept outside the wedge, re-enter the range, or expand into a different formation?
Rising Wedge vs Nearby Chart Patterns
Rising wedge confusion usually comes from nearby structures that also involve rising prices or narrowing movement. The cleanest distinction is boundary behavior, not the direction of the next candle.
| Comparison | Main distinction | Classification cue |
|---|---|---|
| Rising wedge vs upward channel | A channel has broadly parallel boundaries | A wedge needs visible convergence |
| Rising wedge vs ascending triangle | An ascending triangle has a flat or near-flat upper boundary | A rising wedge has both boundaries sloping upward |
| Rising wedge vs falling wedge | The direction of both boundaries is opposite | Rising wedge slopes upward; falling wedge slopes downward |
| Rising wedge vs broad wedge family | The family includes multiple compression patterns | One specific rising structure must still show upward convergence |
For broader wedge-family classification, wedge patterns explained separates rising and falling wedge logic from other compression patterns.
Common Rising Wedge Mistakes
One common mistake is labeling every upward channel as a rising wedge. If the boundaries remain parallel, the structure lacks the compression that defines a wedge.
Another mistake is ignoring the slope relationship. The lower boundary usually needs to advance faster than the upper boundary. Without that pressure from below, the structure may be a normal rising channel or a looser trend leg.
A third mistake is treating the first boundary break as proof. A break can fail, re-enter, or expand into another formation. The better question is whether price accepts outside the structure or returns into the prior range.
Repeated line redrawing is also a warning sign. If the pattern only works after the boundaries are adjusted again and again, the market may not be forming a clean wedge at all.
When the Rising Wedge Reading Becomes Unresolved
A rising wedge reading becomes unresolved when price action no longer confirms the boundaries but also does not clearly break into another structure. This can happen when the lower boundary is pierced briefly, price re-enters the wedge, and later swings move sideways without clean acceptance above or below the structure.
Unresolved behavior matters because forcing a label can create false clarity. The structure may need more swings, a cleaner boundary response, or a comparison against an ascending triangle, channel, or broader wedge-family pattern before the classification becomes useful again.
FAQ
Is a rising wedge always bearish?
No. A rising wedge is often discussed as a bearish reversal pattern, but the structure itself only shows upward compression. Later boundary behavior decides whether the reading strengthens, weakens, or changes.
How many touches does a rising wedge need?
A cleaner reading usually needs repeated interaction with both the upper and lower boundaries. One or two isolated points are usually too weak to support a reliable wedge classification.
What is the difference between a rising wedge and an upward channel?
A rising wedge has two upward-sloping boundaries that converge. An upward channel has two rising boundaries that remain broadly parallel.
Can a rising wedge break upward?
Yes. An upward break can happen, especially if the structure was part of a larger continuation move or if the original wedge label was weak. The break still needs later acceptance behavior before the classification is clear.
Does volume confirm a rising wedge?
Volume can add context, but it does not confirm the pattern by itself. Boundary quality, convergence, swing interaction, and later acceptance behavior carry the main classification weight.