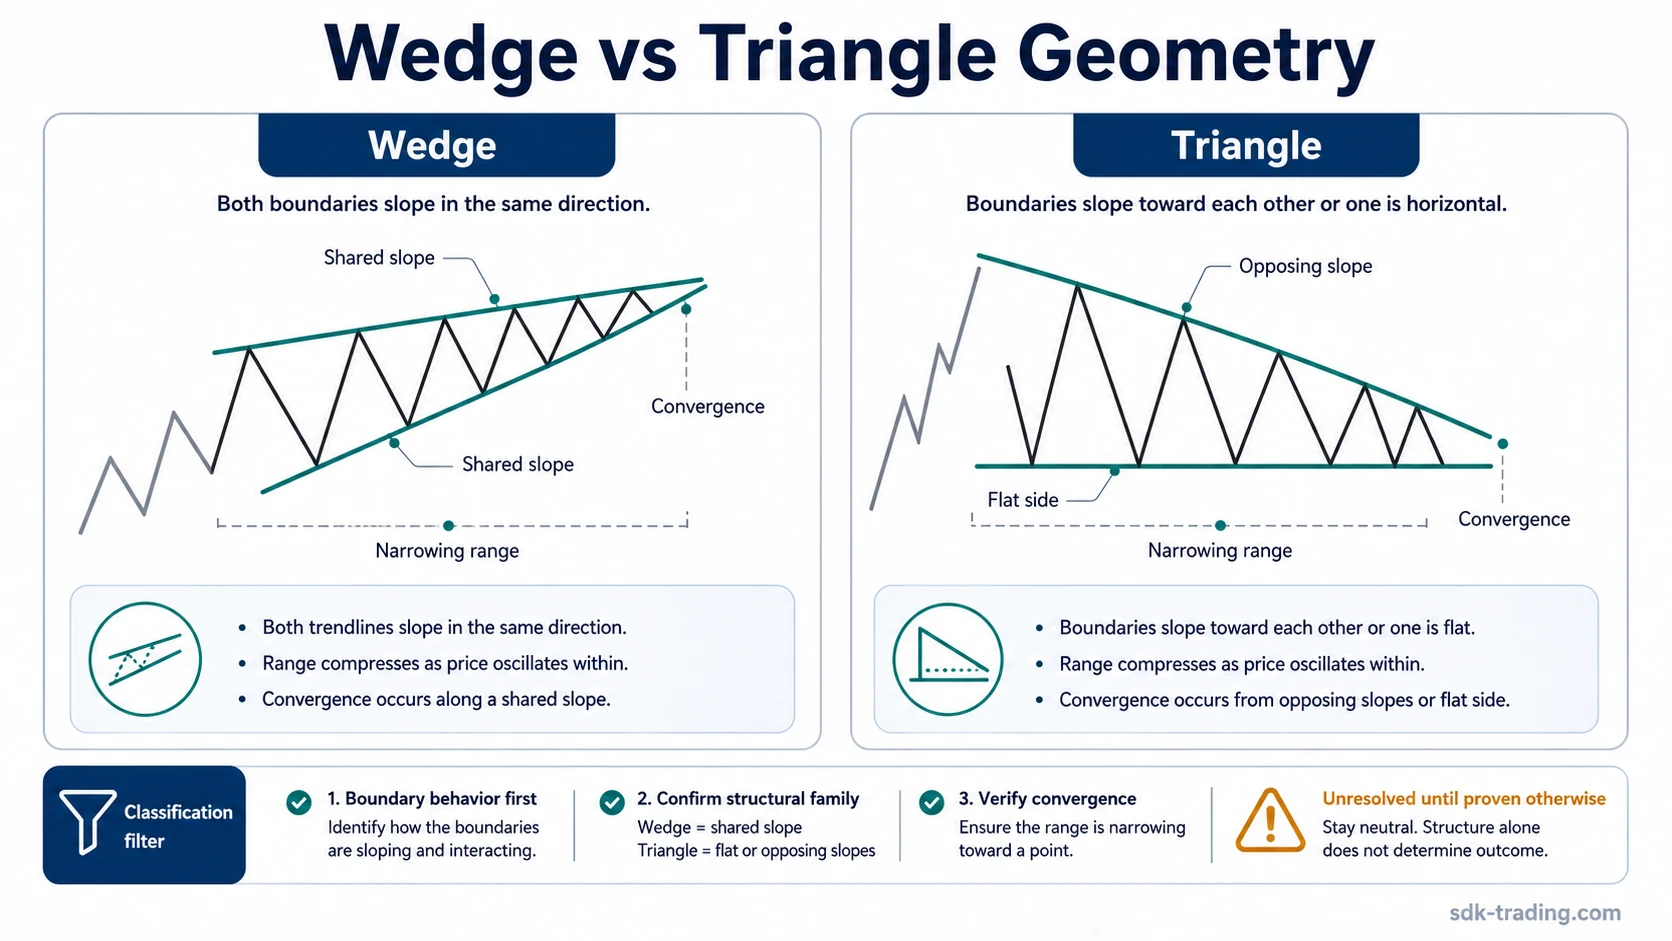
In chart-pattern analysis, wedge vs triangle classification depends on how the boundaries compress: wedges usually narrow along a shared directional slope, while triangles narrow through opposing slopes or one horizontal side.
The confusion happens because both structures use converging lines and a narrowing price range. The cleaner distinction comes from boundary slope, horizontal-side behavior, swing sequence, and whether the trendlines can be drawn without forcing selective touchpoints.
Key Points
- Wedges usually compress while both boundaries lean in the same general direction.
- Triangles usually compress through opposing slopes or through one horizontal boundary.
- A clear horizontal side often supports a triangle reading more than a wedge reading.
- The label weakens when trendlines depend on selective touchpoints or shallow, unclear slope differences.
- The pattern name does not predict direction by itself; later behavior and broader chart context still matter.
Wedge vs Triangle: The Fastest Difference
A wedge is usually read as a sloping compression structure. Both boundaries tend to lean upward or downward while the distance between swing highs and swing lows contracts.
A triangle is usually read as a compression structure where the two sides either lean toward each other from opposing directions or one side remains close to horizontal while the other side pushes into it.
Definition: In chart-pattern analysis, the practical wedge vs triangle distinction is the relationship between the two boundaries. A wedge normally has a shared slope direction. A triangle normally has opposing boundary pressure or a horizontal side.
Wedge vs Triangle Criteria
The label becomes clearer when the same criteria point in the same direction. One line feature is not enough; slope, touch quality, swing behavior, and boundary respect need to work together.
| Criterion | Wedge reading | Triangle reading | Common misread |
|---|---|---|---|
| Boundary slope | Both boundaries lean upward or both lean downward. | Boundaries lean toward each other from opposing directions, or one side is flat. | Calling every converging pattern a wedge. |
| Horizontal boundary | A strong horizontal side is less typical for a clean wedge reading. | A flat upper or lower side often supports an ascending or descending triangle reading. | Ignoring the flat side because the structure still narrows. |
| Convergence | The range narrows as both sloping boundaries move in the same general direction. | The range narrows as price compresses between opposing pressure or against a flat boundary. | Drawing convergence from only two convenient points. |
| Swing sequence | Rising wedges often form higher highs and higher lows with compression; falling wedges often form lower highs and lower lows with compression. | Ascending triangles often press into a flat upper area; descending triangles often press into a flat lower area; symmetrical triangles narrow from both sides. | Using only the final break instead of the full swing sequence. |
| Boundary quality | Repeated interaction with both sloping boundaries makes the wedge label easier to justify. | Repeated interaction with the flat side or opposing sides makes the triangle label easier to justify. | Forcing a label when one boundary has weak respect. |
| Use this lens when | The main question is whether price is compressing along a shared upward or downward slope. | The main question is whether price is compressing into a flat side or between opposing slopes. | Choosing the label before checking boundary behavior. |
Why Wedges and Triangles Are Confused
Wedges and triangles are confused because both can look like price being squeezed into a smaller area. A chart can show lower volatility, shorter swings, and converging trendlines without making the correct label obvious.
The mistake is treating convergence as the whole pattern. Convergence only says the range is contracting. The pattern label depends on how that contraction is shaped.
Common mistake: A narrowing chart is not automatically a wedge. If one boundary is flat, or if the two boundaries oppose each other cleanly, the structure may fit a triangle reading better.
Same Chart, Different Label
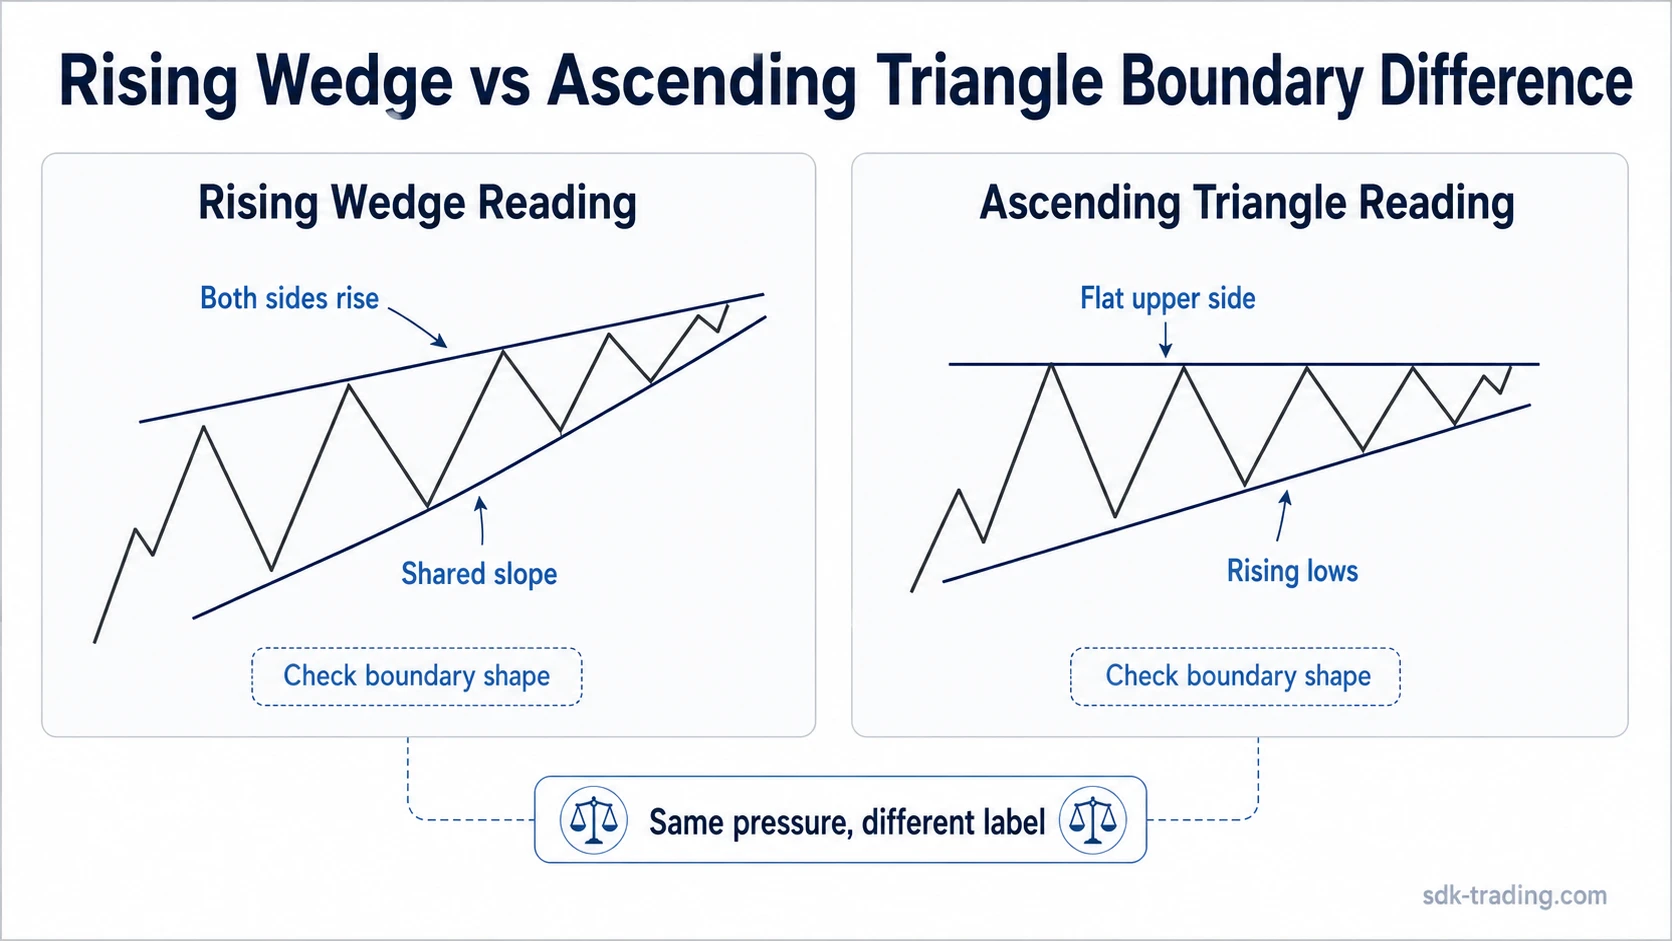
Price can compress after a directional move and still produce two different readings depending on boundary behavior. A chart with rising lows and rising highs, where both lines lean upward and the range narrows, can support a rising wedge reading if both boundaries remain sloped and respected.
A similar compression with a flat upper boundary and rising lows can support an ascending triangle reading instead. The chart still narrows, but the horizontal side changes the classification. The fastest decision filter is whether the structure keeps a shared slope on both sides or develops a clear flat side.
Example of a basic wedge vs triangle reading: Price advances into a prior resistance area and begins forming shorter swings. If the upper boundary keeps rising with the lower boundary, the structure may be read as a wedge. If the upper boundary stays flat while lows continue pressing upward, the structure may be read as a triangle. If the trendlines require skipping obvious highs or lows, the classification remains weak.
Boundary Geometry: Wedge, Triangle, and Ambiguous Cases
Boundary geometry is the main diagnostic layer. The slope relationship tells whether the structure is compressing along one directional track or into a boundary from opposing pressure.
Wedge boundary behavior:
A wedge reading is easier to justify when both boundaries share the same slope direction and price interacts with each side more than once. A rising wedge compresses upward when both boundaries rise while the range narrows.
A falling wedge compresses downward when both boundaries fall while the distance between swings contracts.
Triangle boundary behavior:
A triangle reading becomes stronger when one side is horizontal or when both sides lean toward each other from opposing directions. A flat boundary changes the interpretation because price is repeatedly interacting with the same area instead of moving along two similarly sloped lines.
Ambiguous boundary behavior:
Some structures sit between the two labels. Shallow slopes, uneven touchpoints, and late-stage redraws can make either label less reliable. In those cases, the safer reading is to describe the visible compression and wait for cleaner boundary evidence rather than forcing a pattern name.
Edge Cases: Rising Wedge, Falling Wedge, and Symmetrical Triangle
The narrow comparison that often causes the most confusion is rising wedge versus ascending triangle. Both may form during upward pressure. The distinction usually turns on whether the upper side slopes upward with the lower side or remains close to horizontal while rising lows press into it.
Falling wedge versus descending triangle creates the opposite version of the same problem. A falling wedge normally has both boundaries sloping downward. A descending triangle usually has a flatter lower side with lower highs pressing toward it.
A symmetrical triangle can look close to a wedge when both sides are angled and the structure is compact. The difference is that a symmetrical triangle usually compresses from opposing sides, while a wedge normally leans in one shared direction.
When the Classification Becomes Weak
The wedge or triangle label weakens when the structure depends more on the drawing than on the price action. A clean label should not require ignoring obvious swing points or repeatedly redrawing the pattern after each new candle.
Classification weakens when: the boundaries have too few touches, one side is drawn through several important swings, the slope difference is too small to defend, or the pattern only appears after selective points are removed.
Volume can add context, especially when activity expands near a boundary or fades during compression, but volume does not solve the label by itself. Boundary quality remains the first classification test.
What the Pattern Label Does Not Decide
The label does not decide market direction, trade quality, timing, or outcome. A wedge may appear before reversal, continuation, or failed follow-through depending on the broader chart context. A triangle may also resolve in more than one way.
The useful function of the label is classification. It helps separate one compression shape from another so later chart behavior can be interpreted with cleaner structure.
FAQ
What is the main difference between a wedge and a triangle pattern?
The main difference is boundary geometry. A wedge usually narrows while both boundaries lean in the same direction. A triangle usually narrows through opposing slopes or through one horizontal boundary.
Can a wedge have a horizontal boundary?
A clear horizontal boundary usually makes a triangle reading fit better than a wedge reading. A wedge reading is stronger when both boundaries slope in the same general direction.
Why does a symmetrical triangle look like a wedge?
Both structures can have converging boundaries and a narrowing range. A symmetrical triangle normally compresses from opposing sides, while a wedge normally leans upward or downward along a shared slope.
Is a wedge always reversal and a triangle always continuation?
No. The pattern label alone does not decide direction. Later price behavior, boundary acceptance or rejection, and broader chart context determine how defensible the reading becomes.