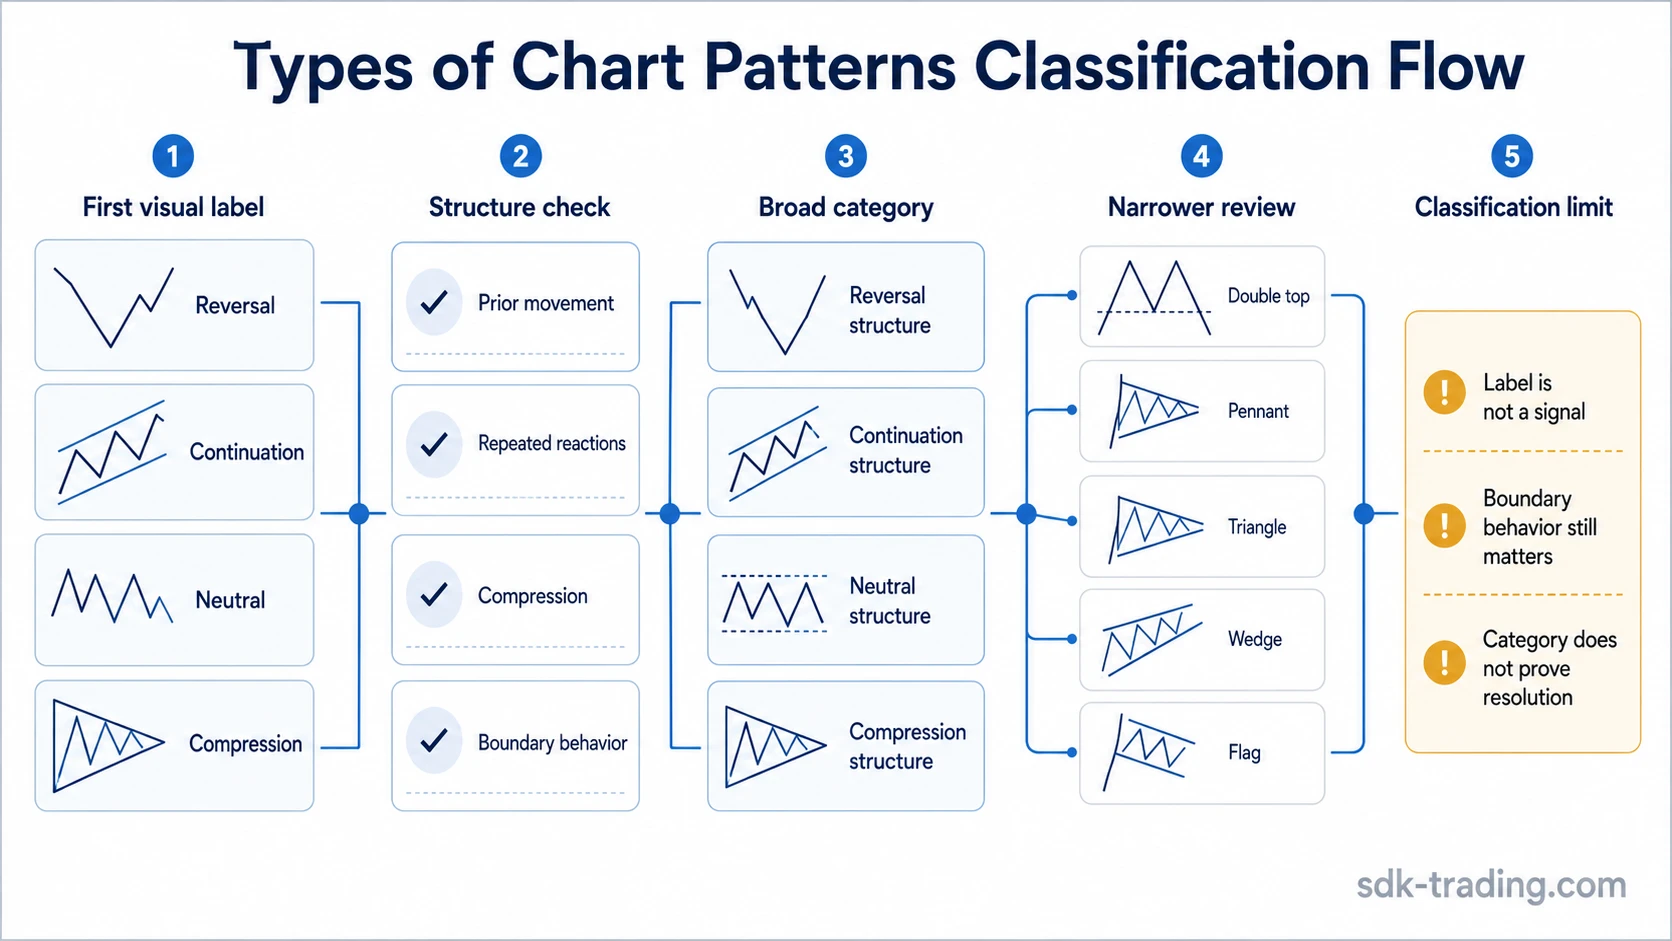
Types of chart patterns are broad structural categories used in technical analysis to classify recurring price formations before reviewing a narrower pattern. The main categories are reversal patterns, continuation patterns, neutral or bilateral patterns, and compression or consolidation structures.
A category label is only the first step. A shape becomes more useful to classify after the surrounding structure is checked: the prior movement, repeated reactions, compression, boundary behavior, and whether later price action accepts or rejects a move outside the structure.
What Types of Chart Patterns Mean in Trading
Chart pattern types group similar price structures into broad families. The category describes the kind of structure being reviewed; it does not prove what price will do next and does not replace the narrower pattern review.
For example, a compact pause after a directional movement may first belong to the continuation family. Only after the slope, boundary shape, compression, and later boundary behavior are checked can the structure be reviewed as a narrower pattern such as a flag, wedge, triangle, or pennant-like formation.
The sequence should move from broad visual label to structural conditions, then to a narrower pattern family only when the evidence is specific enough.
Main Types of Chart Patterns
The broad types of chart patterns work best as classification groups. Each group narrows the review, but none of them is a complete reading by itself.
| Chart pattern type | What it classifies | What to check before narrowing the label |
|---|---|---|
| Reversal patterns | Structures that appear after an established move and may suggest a possible change in control. | Prior trend direction, failed continuation, boundary reactions, and whether the later structure supports a reversal reading. |
| Continuation patterns | Structures that appear as pauses, compressions, or consolidations within an existing movement. | Compression quality, slope, depth of pullback, repeated reactions, and whether the structure remains part of the prior movement. |
| Neutral or bilateral patterns | Structures where the first label does not clearly assign direction or control. | Whether price accepts one side of the structure, fails at a boundary, or keeps rotating inside the same area. |
| Compression and consolidation patterns | Structures where range, volatility, or swing size contracts before a clearer classification is possible. | Number of reactions, symmetry or asymmetry, boundary slope, and whether later behavior confirms the structure. |
| Candlestick-pattern boundary | Single-candle or multi-candle formations that are separate from broader chart-pattern structures. | Whether the question is about candle shape or about a wider price structure built from multiple swings. |
How to Choose the Next Pattern to Review
The next pattern to review depends on the first structural clue. A label such as reversal, continuation, neutral, or compression should narrow the review rather than end it.
| If the first label looks like… | What category to check | Which narrower concept to review next | What not to assume from the label alone |
|---|---|---|---|
| A compact pause after a directional movement | Continuation or compression | Review a narrow compression pattern such as a pennant. | Do not assume the pause has accepted a new direction before the boundaries are tested. |
| Two failed pushes into a similar upper area | Reversal | Compare the structure with a two-peak reversal structure such as a double top. | Do not treat two similar highs as enough without reviewing the reaction between them and the later boundary behavior. |
| Three repeated tests of a similar upper area | Reversal or range exhaustion | Check whether the sequence fits a repeated-test reversal structure such as a triple top. | Do not assume the third test has the same meaning if the structure keeps accepting the area. |
| A sharp downward move followed by a fast recovery | Reversal or failed lower acceptance | Review whether the structure resembles a rapid recovery formation such as a V-bottom. | Do not classify every fast rebound as a completed reversal without later structure. |
| A sharp upward move followed by a fast loss of structure | Reversal or failed upper acceptance | Check whether the structure resembles a rapid rejection formation such as a V-top. | Do not assume the initial rejection is enough unless later behavior supports the classification. |
| A rising, narrowing structure with weaker expansion | Wedge or compression | Compare it with a narrowing upward structure such as a rising wedge. | Do not draw wedge lines after the fact if the swings did not form a usable boundary first. |
A narrow pattern name becomes more defensible when the structure has enough observable detail. Before that point, the safer label is usually the broader category.
Chart Patterns vs Chart Types and Candlestick Patterns
Chart patterns are not the same as chart types. A chart type is the display format, such as a candlestick chart, line chart, or bar chart. A chart pattern is the structure that appears within the displayed price data.
Candlestick patterns are also separate from broader chart patterns. A candlestick pattern focuses on one candle or a small candle sequence. A chart pattern usually depends on a wider structure built from multiple swings, boundaries, reactions, and later behavior.
Pattern identification is another separate step. Category classification asks what family the structure may belong to. Identification asks whether the structure has enough qualifying evidence to carry a narrower name.
Failures and psychology are narrower interpretation layers. They can change how a pattern is read, but they should not replace the first classification step.
Common Classification Mistakes
A common mistake is treating resemblance as structure. A price path may look familiar only after lines are adjusted around it. Stronger classification starts from boundaries that were visible before the final label was chosen.
Another mistake is treating a category as a signal. Reversal, continuation, and neutral labels describe the type of structure under review. They do not say that price has already resolved the structure.
Forcing lines after the fact also weakens classification. If the boundary only works after several exceptions are ignored, the structure may belong to a different category or may not be clear enough to classify.
Confusing chart type with chart pattern creates another error. A candlestick chart is only a display method; the pattern is the repeated structural behavior inside that display.
Classification is more defensible when prior movement, compression, repeated reactions, boundary behavior, and later acceptance or failure point to the same broad family.
FAQ
How many types of chart patterns are there in trading?
Most trading chart patterns are grouped into reversal, continuation, neutral or bilateral, and compression or consolidation categories. Individual patterns then sit inside those broader groups.
Are candlestick patterns the same as chart patterns?
No. Candlestick patterns focus on one candle or a small candle sequence. Chart patterns usually describe a wider price structure built from multiple swings, reactions, and boundaries.
What is the difference between chart types and chart patterns?
A chart type is the format used to display price data, while a chart pattern is a recurring structure that appears inside that displayed data.