A V top pattern in trading is a sharp single-apex reversal structure where a fast advance compresses into a narrow high and then turns into a fast decline. The shape becomes more meaningful when the peak is narrow, retesting near the high is limited, and downside displacement separates the move from an ordinary pullback.
Definition: A V top pattern is a reversal chart pattern built around one compressed upper pivot, not a gradual rollover or a series of repeated resistance tests.
Key Points
- A V top pattern forms around one sharp upper pivot after a prior advance.
- The cleanest reading combines time compression, a narrow apex, and fast downside displacement.
- The pattern is weaker when the high broadens, price repeatedly retests the upper area, or the decline stalls quickly.
- A V-shaped look is not enough by itself; later structure decides whether the reading remains valid.
- The pattern is a classification tool whose value comes from failed continuation, location, and follow-through.
What Is a V Top Pattern?
A V top pattern is a bearish reversal structure in technical analysis where price rises quickly, forms a narrow upper pivot, and then falls quickly enough to show a clear change in behavior. The pattern is called a V top because the price path often resembles an inverted V, but the useful classification depends on structure rather than letter shape alone.
The main idea is compression. A slow rounded high can still be a reversal, but it is not the same structure. A V top needs a fast transition from upward movement into downward movement, with little time spent building a broad upper range.
V Top Anatomy
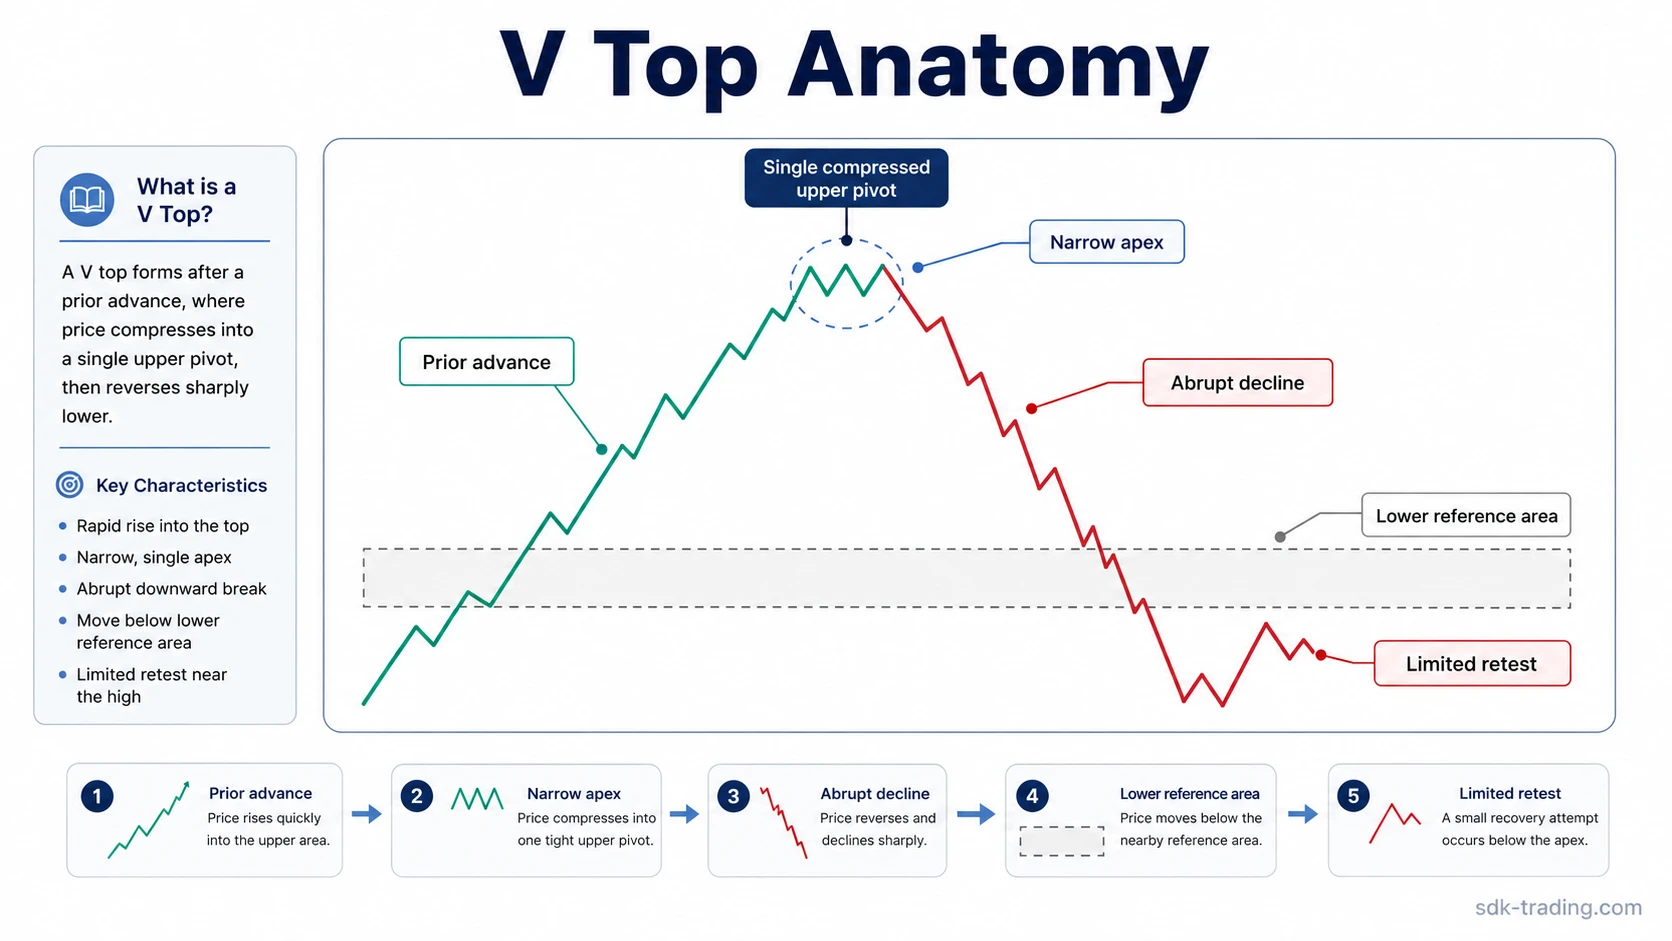
A complete V top reading usually has four parts: a prior advance, a narrow apex, an abrupt decline, and a lower reference area that shows whether downside displacement has appeared. The apex is the compressed high. The decline is the test of whether the market rejects that high quickly or only pauses before another attempt.
| Component | What to Look For | Why It Matters |
|---|---|---|
| Prior advance | Price rises into the upper area before the pattern appears. | A V top needs an upward leg to reverse from. |
| Narrow apex | The high forms quickly rather than spreading across many tests. | A compressed apex separates V-top logic from broader top formations. |
| Abrupt decline | Price leaves the high with speed instead of drifting sideways. | The decline shows whether control changed quickly after the high. |
| Lower reference area | Price moves below a nearby swing, range base, or short-term structure. | Displacement helps separate a reversal reading from a normal pullback. |
| Limited retest | Price does not repeatedly return to the same high. | Repeated high tests can shift the structure toward double or triple top logic. |
How to Identify a V Top Pattern
Identification starts with the sequence, not with the finished label. A strong candidate begins with a fast advance into a high, then shows a narrow turning point and a decline that removes nearby support or short-term structure. If the decline is shallow, slow, or immediately recovered, the pattern remains unresolved.
- Look for a fast advance into a compact upper pivot.
- Check whether the high is narrow rather than repeatedly tested.
- Watch whether price declines quickly from the apex.
- Compare the decline with the nearby lower boundary or prior short-term structure.
- Treat early visual resemblance as provisional until displacement appears.
Classification note: The shape is usually visible before the reading is reliable. A V top becomes more defensible only after later price behavior shows that the upper area was rejected rather than merely paused.
Clean, Weak, and Invalid V Top Readings
The same sharp high can produce different readings depending on what happens after the apex. The classification is strongest when price leaves the high quickly and does not keep rebuilding acceptance near the upper area.
| Reading | Structure | Typical Interpretation |
|---|---|---|
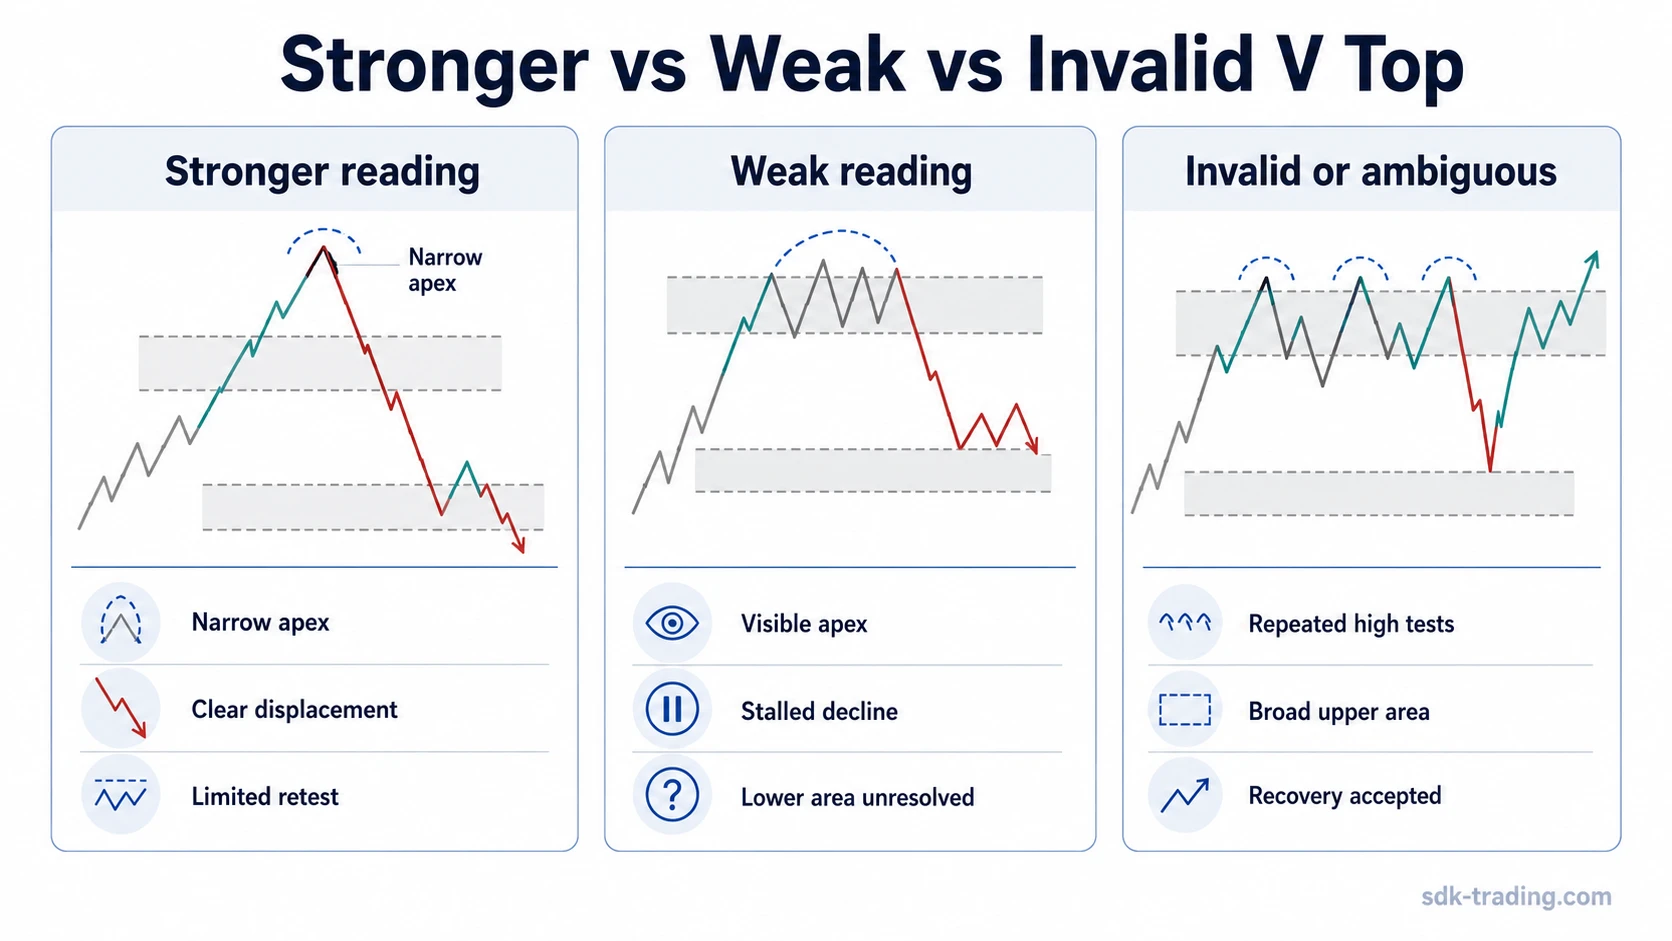
| Clean V top | Fast advance, narrow apex, abrupt decline, limited retest, clear downside displacement. | The market rejected the upper area quickly enough for a V-top classification. |
| Weak V top | The apex is visible, but the decline stalls, retesting expands, or the lower boundary remains intact. | The structure may still be reversing, but the V-top label is less precise. |
| Invalid or ambiguous reading | Price repeatedly returns to the high, forms a broad upper range, or quickly recovers the decline. | The structure may belong closer to another top pattern or remain unresolved. |
Why V Tops Are Difficult to Classify Early
V tops are often clearer after the fact because the apex itself does not prove that the market has reversed. A fast move away from the high can look decisive, but the reading weakens if price quickly reclaims the upper area or builds a new range near the same high.
A common mistake is treating the first sharp drop as a completed pattern. The safer classification waits for structure: whether the decline removes a nearby support area, whether recovery attempts fail below the apex, and whether the upper pivot remains a narrow rejection rather than a repeated testing zone.
V Top vs Nearby Reversal Patterns
A double top uses two major tests of a similar resistance area, while a V top is built around one compressed upper pivot.
A rounding top develops through gradual curvature and slower loss of momentum, while a V top depends on a faster transition from advance to decline.
A triple top requires three separated resistance tests, while a V top loses precision if the upper area is tested repeatedly.
A V bottom is the opposite directional structure: a sharp lower pivot followed by a fast recovery. The classification logic is similar in compression, but the directional context is reversed.
Example Scenario: Sharp High or Broader Top?
A market advances quickly into a prior reaction area, prints one narrow high, and then falls through the latest short-term swing. A later recovery attempt reaches below the apex and stalls. That sequence supports a cleaner V-top reading because the high remains compressed and the decline changes the nearby structure.
The reading becomes weaker if price keeps returning to the same high, builds several small peaks, or holds the lower boundary after the first decline. In that case, the structure may be closer to a double top, triple top, rounding top, or an unresolved range.
FAQ
What is a V top pattern in trading?
A V top pattern is a reversal chart pattern where a fast advance forms one narrow upper pivot and then turns into a fast decline. The pattern depends on compression, rejection near the high, and downside displacement.
How do you identify a V top pattern?
Look for a prior advance, a narrow apex, a fast decline from the high, limited retesting, and a move that removes nearby short-term structure. The shape alone is not enough.
When is a V top reading weak?
A V top reading is weak when the apex broadens, the decline stalls, price repeatedly retests the high, or the lower boundary remains accepted after the first drop.
Is a V top the same as a double top?
No. A V top is built around one compressed upper pivot, while a double top depends on two major tests of a similar resistance area.