A triple top is a bearish reversal chart pattern in technical analysis that forms after a prior advance when price tests a similar resistance area three separate times, fails to sustain acceptance above it, and later reacts around a lower boundary formed by the pullbacks.
Definition: A triple top is a three-peak resistance structure. The pattern becomes more defensible when the third test shows weakening acceptance above resistance and later price behavior accepts below the lower boundary between the pullbacks.
The first two highs establish the area being tested. The third high tests whether that area is still being defended or whether the market can absorb supply and continue higher. Without a clear lower boundary and later behavior around it, the structure remains a potential triple top rather than a completed reading.
Key Points
- A triple top needs three separated tests near the same resistance area after a prior advance.
- The lower boundary matters because it separates a potential structure from a stronger breakdown reading.
- Sustained acceptance above the resistance area weakens or invalidates the triple top interpretation.
- Weak readings often come from forcing three highs onto sideways congestion with unclear pullbacks.
What Is a Triple Top?
A triple top is a reversal pattern built around repeated failure near an upper resistance area. It usually appears after an advance, when buyers push into a similar zone three times but do not create sustained acceptance above it.
The pattern is not defined by three perfectly equal highs. A practical reading allows a resistance area rather than a single exact price, because real charts often test zones with slightly different highs. The important question is whether the market repeatedly rejects the same upper area and then accepts below the lower boundary formed by the intervening pullbacks.
Volume can support the reading, but it should stay secondary. A third test with weaker participation, a failed push above resistance, or a stronger reaction away from the upper area can add context, but structure and boundary behavior carry the main classification weight.
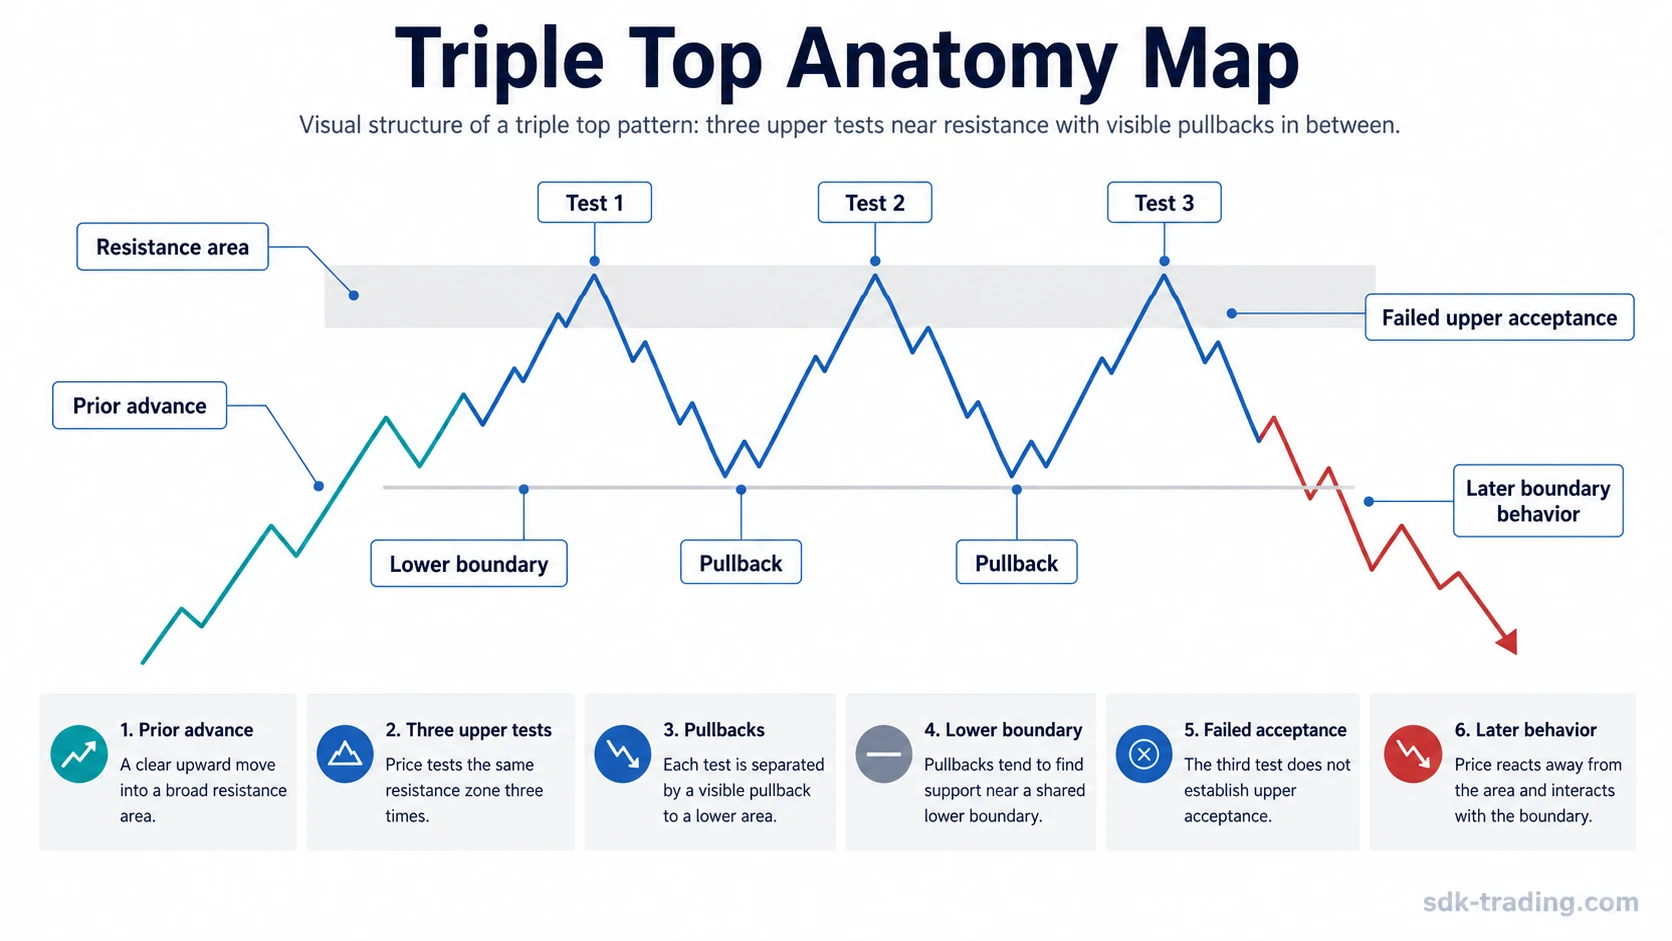
How a Triple Top Forms
A triple top begins with a prior advance into a resistance area. The first peak marks the initial rejection zone. The second peak tests whether buyers can overcome that area. The third peak tests whether resistance still holds after the market has spent more time near the same upper boundary.
The pullbacks between the three peaks create the lower boundary. That boundary is sometimes called a neckline, but the more useful idea is acceptance. A brief move below the boundary can be only a probe; the reading becomes stronger when price cannot reclaim that area cleanly and the prior range begins to lose support.
The third test is the quality check. If price breaks above the upper area and holds there, the triple top reading loses force. If price pushes into the area and quickly fails, the structure shows persistent resistance and possible range fatigue.
Triple Top Structure Checklist
A cleaner triple top has enough spacing, separation, and boundary behavior to distinguish it from ordinary sideways movement.
| Structure element | What to look for | Why it matters |
|---|---|---|
| Prior advance | Price rises into the area before the three tests begin. | The pattern is a reversal structure, so the earlier advance gives the upper tests their context. |
| Three upper tests | Price reaches a similar resistance area three separate times. | The repeated tests show level persistence rather than a single failed high. |
| Visible pullbacks | Each peak is separated by a pullback rather than compressed into one noisy cluster. | Separation helps prevent overfitting ordinary congestion into a pattern label. |
| Lower boundary | The intervening lows form a recognizable area that price later tests. | The boundary is where the reading shifts from potential structure to stronger classification evidence. |
| Third-test behavior | The third push struggles to hold above the upper area or is quickly rejected. | The third test helps judge whether resistance is still persistent or has been absorbed. |
| Acceptance below boundary | Price moves below the lower boundary and fails to reclaim it cleanly. | Acceptance below the range strengthens the bearish reversal reading without turning it into a trade instruction. |
What Confirms or Invalidates a Triple Top?
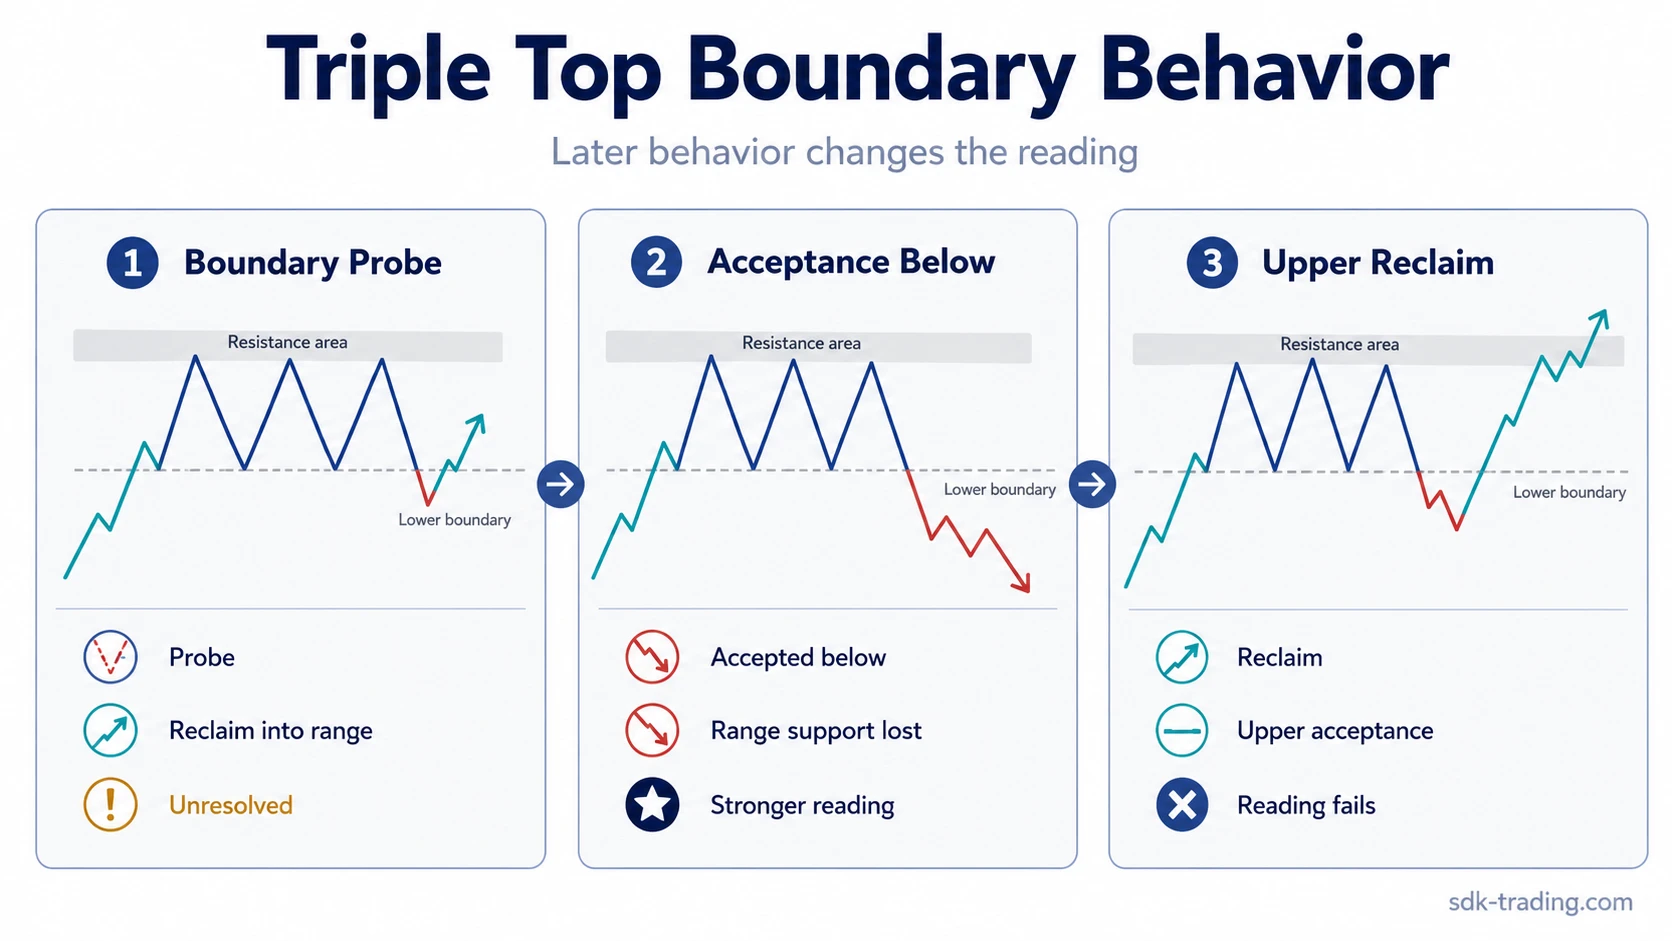
A triple top reading strengthens when price fails near the upper resistance area and later accepts below the lower boundary. The lower boundary should not be treated as a fixed trigger line. It works as evidence that the market has shifted from repeated resistance testing into lower acceptance.
- Potential reading: three separated highs appear near the same resistance area, but lower-boundary behavior is still unresolved.
- Stronger reading: price fails near the upper area and later accepts below the lower boundary without a clean reclaim.
- Invalid reading: price sustains acceptance above the resistance area or the three highs dissolve into broad congestion.
The reading weakens when price keeps returning to the upper area without a decisive rejection, when the pullbacks are too shallow to form a meaningful boundary, or when the three highs are simply part of a broad range. It fails when price sustains acceptance above the resistance area that the pattern depends on.
Boundary logic: The upper area tests resistance persistence. The lower boundary tests whether the range has lost support. A stronger reading needs both sides of that structure to behave coherently.
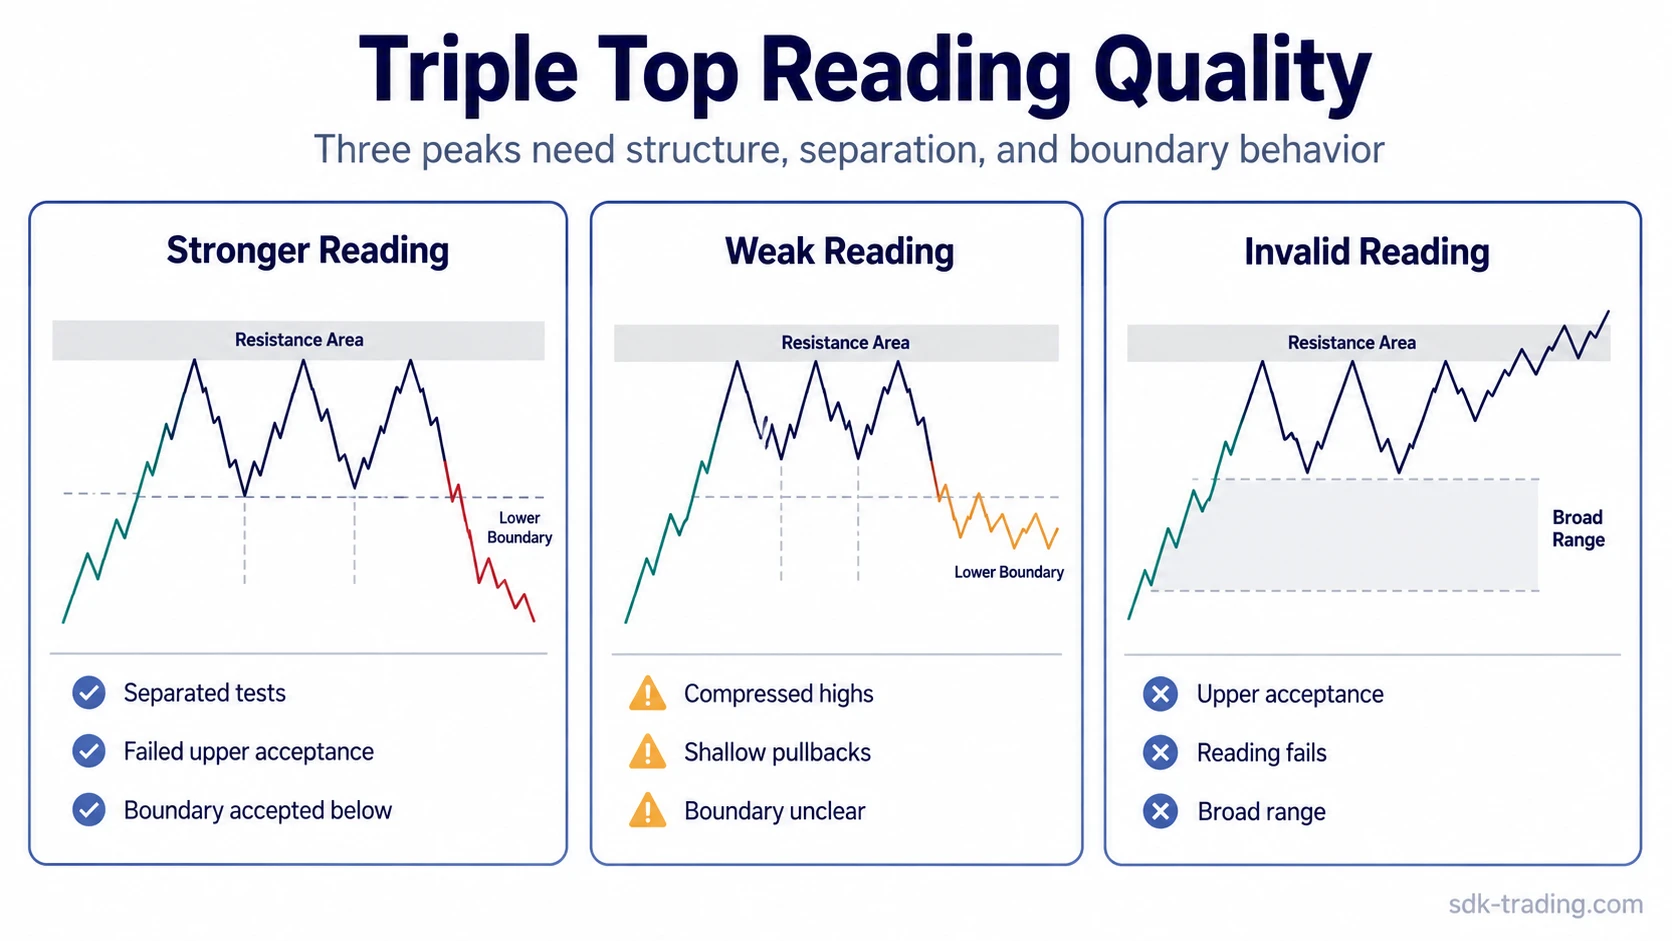
Clean, Weak, and Invalid Triple Top Readings
The same three-peak label can describe very different chart quality. Separating clean, weak, and invalid readings reduces the risk of forcing a pattern onto price action that does not support it.
| Reading type | Chart behavior | Interpretation |
|---|---|---|
| Clean triple top | Three separated tests near resistance, clear pullbacks, failed upper acceptance, and later acceptance below the lower boundary. | The structure supports a bearish reversal classification. |
| Weak triple top | Three highs are visible, but spacing is poor, the lower boundary is unclear, or price keeps re-entering the range. | The pattern remains tentative because the market has not shown clean rejection and lower acceptance. |
| Invalid triple top | Price accepts above the resistance area or the supposed three peaks become part of a larger sideways range. | The original triple top reading no longer describes the active structure well. |
Common Triple Top Misreadings
A common mistake is counting any three nearby highs as a triple top. The label becomes fragile when the highs are compressed, the pullbacks are not visible, or the supposed lower boundary is only a minor fluctuation inside congestion.
Another weak reading appears when the third test is treated as automatic reversal evidence. The third test only asks whether resistance is still holding. If price breaks above the upper area and holds there, the market is showing acceptance rather than failure.
Volume can also be overread. Lower volume on the third peak may fit the idea of fading demand, but volume alone cannot classify the structure. Price location, rejection behavior, boundary behavior, and later reclaim attempts matter more than a single volume comparison.
Common mistake: The pattern becomes overfitted when the three highs are chosen first and the boundary is justified later. A stronger reading starts with a visible resistance area, separated tests, and a lower boundary that price actually reacts to.
Triple Top vs Similar Reversal Patterns
A double top has two major tests of resistance, while a triple top adds a third test that can reveal whether the upper area is still defended or being absorbed.
A rounding top is built around a gradual rollover, while a triple top depends on repeated tests near a more horizontal resistance area.
A triple bottom is the mirror structure after a decline, where repeated tests occur near support instead of resistance.
| Pattern | Main structure | Main distinction |
|---|---|---|
| Triple top | Three tests near resistance after an advance | Focuses on repeated upper rejection and lower-boundary acceptance |
| Double top | Two tests near resistance after an advance | Has fewer resistance tests and less emphasis on third-test fatigue |
| Rounding top | Gradual rollover from rising to falling structure | Does not require three distinct horizontal resistance tests |
| Triple bottom | Three tests near support after a decline | Mirrors the triple top on the support side of the chart |
A Practical Triple Top Scenario
Price advances into a prior resistance area and reacts lower. A second push reaches the same zone, but the market again fails to hold above it. After another pullback, a third push briefly trades into the upper area and stalls instead of building acceptance above resistance.
The structure becomes more defensible if the next move accepts below the lower boundary created by the pullbacks. The reading remains weak if price only dips below the boundary and quickly reclaims the range. It fails if price returns above the resistance area and holds there long enough to show that the upper supply has been absorbed.
Diagnostic focus: Identical peaks are less important than resistance persistence, visible pullbacks, a readable lower boundary, and later behavior around that boundary.
Triple Top Limitations
A triple top can be visually persuasive before it is structurally complete. Early labels are fragile because the market may still be building a range, absorbing resistance, or preparing to continue higher.
The pattern is also sensitive to scale. On a very low timeframe, three highs may be ordinary noise. On a higher timeframe, the same area may represent a more meaningful resistance test. The cleaner reading is usually the one where the three peaks, the pullbacks, and the lower boundary remain visible without forcing the chart.
Limitation: A triple top describes structure quality, not a completed bearish transition by itself. The interpretation should stay conditional on resistance behavior, lower-boundary acceptance, and any later reclaim of the range.
FAQ
What does a triple top mean in trading?
A triple top means price has tested a similar resistance area three times after a prior advance and has not sustained acceptance above it. The bearish reversal reading strengthens only when later price behavior accepts below the lower boundary.
How do you identify a triple top pattern?
Look for a prior advance, three separated highs near the same resistance area, visible pullbacks between the highs, and a lower boundary formed by the intervening lows. A cleaner reading also needs failed acceptance above resistance and later acceptance below the boundary.
Does a triple top need three equal highs?
No. A triple top usually works better as a resistance-area reading than as a search for three identical prices. The highs should be close enough to show repeated testing of the same upper area.
What invalidates a triple top?
A triple top reading weakens or fails when price sustains acceptance above the resistance area, when the lower boundary is unclear, or when the three highs become part of broad sideways congestion.
What is the difference between a double top and a triple top?
A double top has two major resistance tests, while a triple top has three. The third test adds information about whether the resistance area remains persistent or whether it is being absorbed.