A triple bottom is a trading chart pattern that forms when price tests a similar support area three times after a decline or bearish phase, then later challenges the upper boundary created by the rebounds between those lows.
The structure is not complete only because three lows appear. A stronger triple bottom classification needs visible swing separation, repeated defense of the support area, and later behavior that shows whether the market accepts or rejects the upper boundary.
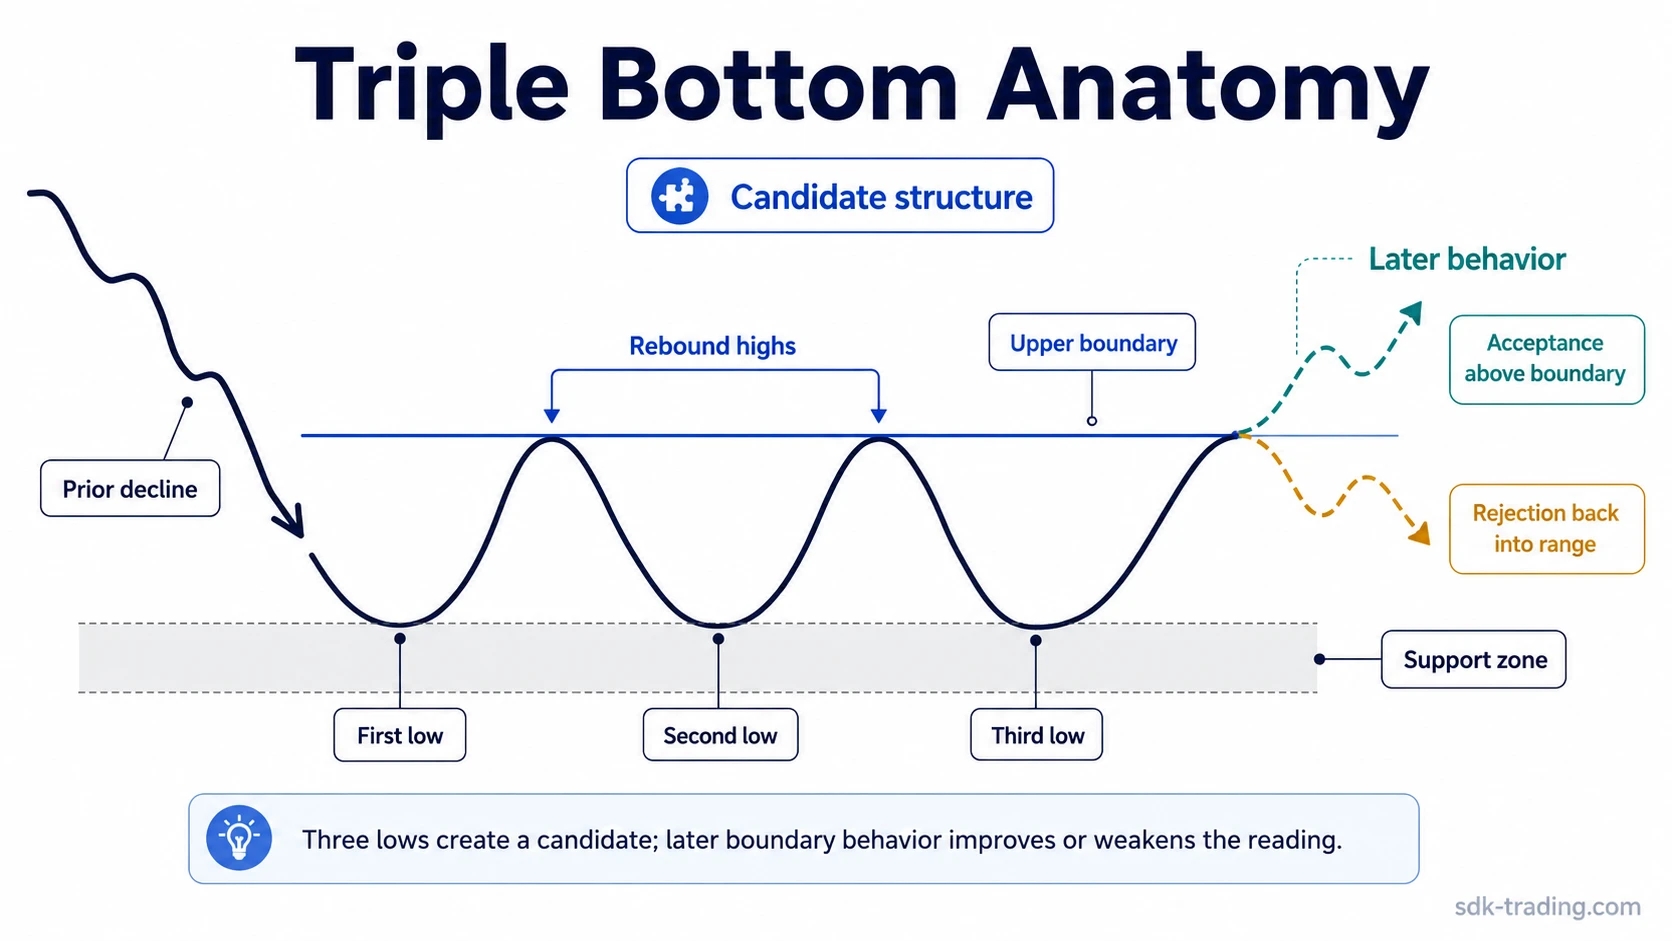
Definition: A triple bottom is a reversal chart pattern built around three comparable support tests, two intervening rebounds, and an upper boundary that later becomes the main acceptance or failure area.
Key Points
- A triple bottom forms around three lows near the same support zone after a prior decline or bearish phase.
- The rebounds between the lows create an upper boundary, often called a neckline in chart-pattern analysis.
- Three lows alone do not confirm the pattern if the swings are too compressed, the upper boundary is unclear, or price remains trapped inside range behavior.
- The structure becomes more defensible when price later accepts above the upper boundary; it remains less resolved if that acceptance fails.
- A support loss can invalidate the triple bottom reading, but it should be treated as interpretation failure, not as stop-loss instruction.
What Is a Triple Bottom?
A triple bottom is a bottoming structure in technical analysis. It usually appears after a decline, when selling pressure repeatedly pushes price toward a similar support area but does not establish lower acceptance beneath it.
The pattern is read through structure first. The three troughs need to be close enough to show repeated support testing, but separated enough to avoid labeling ordinary congestion as a triple bottom. The two rebound highs between the troughs form the upper boundary that later tests whether the structure is only a range or a more defensible reversal pattern.
Qualified language matters. A triple bottom can suggest that downside pressure is losing control, but the reading still depends on support behavior, neckline acceptance, and failed continuation lower.
Triple Bottom Structure and Components
The core structure is a sequence of support tests, rebounds, and later boundary behavior. Each part contributes to the pattern classification only when it fits the broader sequence.
| Component | What to observe | Why it matters |
|---|---|---|
| Prior decline or bearish phase | Price moves lower before the three support tests begin. | Without prior downside pressure, the structure may be range behavior rather than a reversal pattern. |
| First low | Price reaches a support area and rebounds. | The first low creates the initial reference zone, but it does not define the pattern alone. |
| First rebound | Price rises away from the support area. | The rebound begins to form the upper boundary that later needs to be tested. |
| Second low | Price returns near the first support area and holds roughly the same zone. | The second test shows that the market is revisiting the same level instead of immediately continuing lower. |
| Second rebound | Price rises again and creates another reaction high. | The reaction highs define the upper boundary more clearly when they form in a similar area. |
| Third low | Price tests the support zone again without establishing lower acceptance. | The third test is the defining feature of the triple bottom, but it still needs later boundary behavior to improve the classification. |
| Upper-boundary acceptance | Price moves above the rebound-high area and holds that area instead of immediately rejecting it. | Acceptance supports a stronger classification because the market has moved beyond the range created by the three lows. |
| Support failure | Price accepts below the support floor after the three-test structure. | The triple bottom reading weakens or fails because the repeated support area no longer holds as a structural boundary. |
| Volume context | Volume expands, contracts, or shifts around the lows and upper boundary. | Volume can add context, but it does not confirm the pattern by itself. |
How to Identify a Triple Bottom
A triple bottom is easier to identify when the chart has a clear sequence rather than three random touches. The basic reading starts with a prior decline, then looks for three lows near the same support zone, separated by visible rebounds.
The support area does not need to be a perfect horizontal line. Real charts often form zones, not exact prices. The more important test is whether the three troughs belong to the same structural area and whether each rebound is large enough to create a meaningful swing rather than a flat cluster of candles.
Identification also depends on the upper boundary. If the rebound highs are too uneven or too shallow, the pattern remains harder to classify. If price later breaks above that boundary but immediately falls back into the range, acceptance remains unresolved.
Diagnostic note: The third support test creates the triple-bottom candidate. Later behavior around the upper boundary decides whether the candidate becomes a stronger pattern, stays weak, or fails.
Clean, Weak, and Invalid Triple Bottom Readings
The same three-low structure can produce different readings. A clean triple bottom, a weak triple bottom, and an invalid triple bottom differ mainly by spacing, boundary clarity, and what price does after testing the upper area.
| Reading | Structural condition | Interpretation boundary |
|---|---|---|
| Clean triple bottom | Three comparable lows, clear swing separation, visible rebounds, and later acceptance above the upper boundary. | The pattern classification is stronger, although it still needs acceptance above the upper boundary to stay defensible. |
| Weak triple bottom | Three nearby lows appear, but the swings are compressed, the upper boundary is unclear, or follow-through above the boundary is poor. | The structure remains unresolved or low quality because the market has not clearly left the range. |
| Invalid or failed triple bottom | Price accepts below the support floor, or an upper-boundary break fails and price returns decisively into lower structure. | The triple bottom reading loses support and another structure may describe the chart more accurately. |
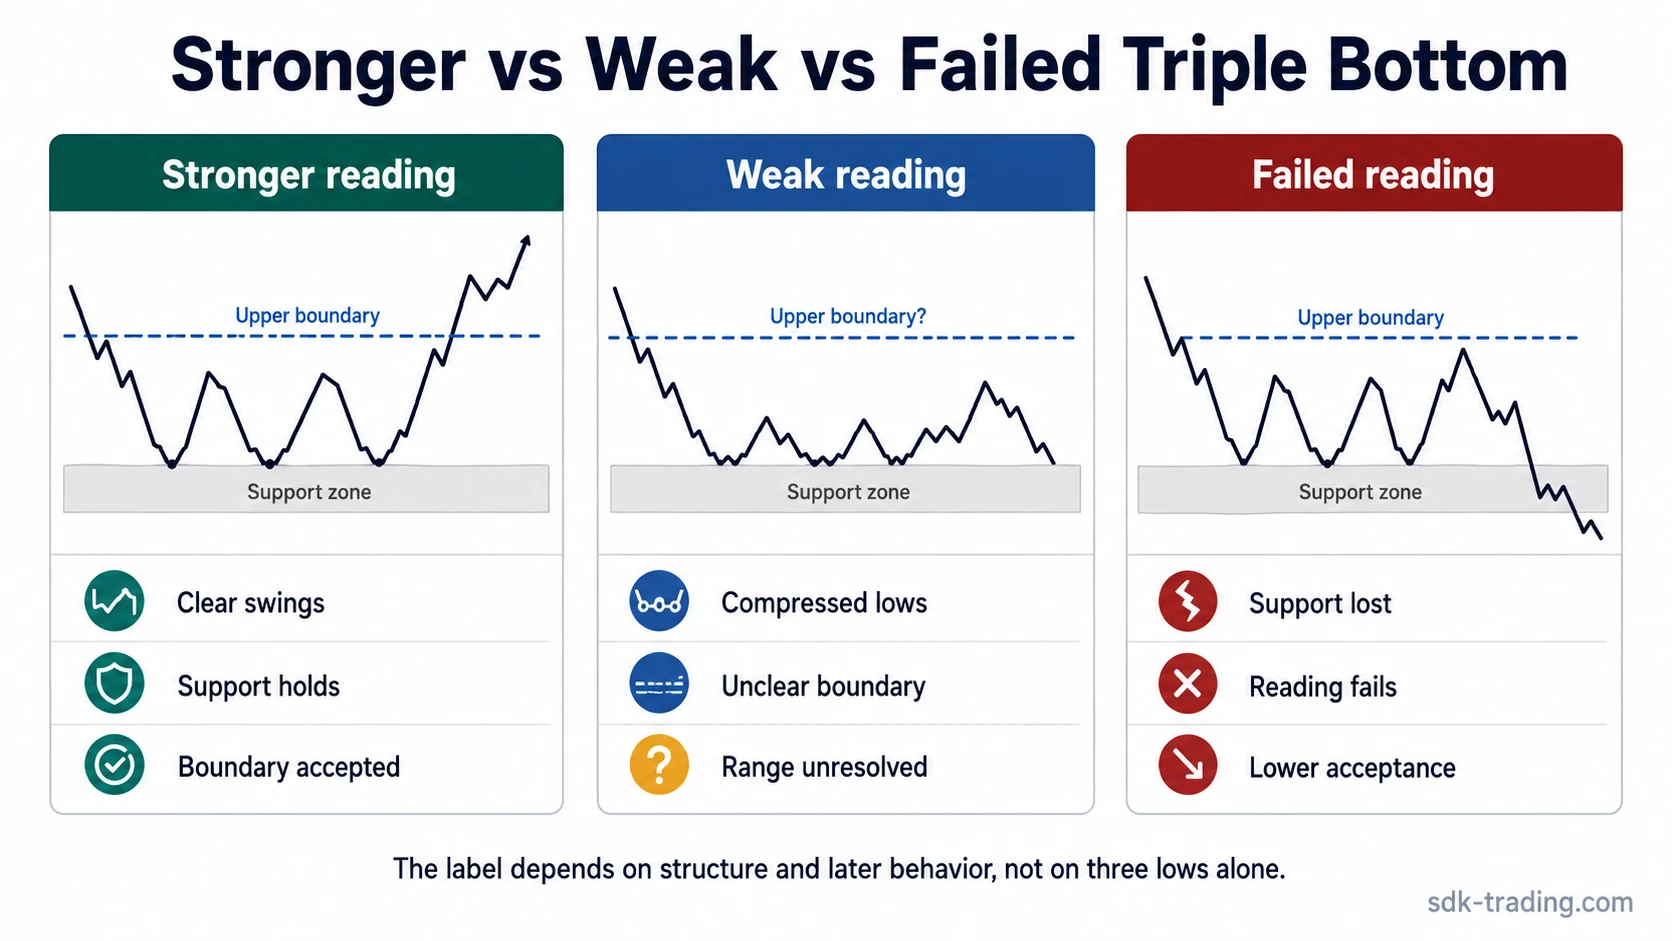
This diagnostic split keeps the pattern from becoming a mechanical label. The question is not only whether three lows exist. The stronger test is whether those lows create a meaningful support structure and whether later price behavior confirms or rejects that structure.
Why Three Lows Are Not Enough
Three nearby lows can appear inside a wide range without creating a clean triple bottom. If the rebounds are shallow, the upper boundary is poorly defined, and price never accepts above the range, the chart may be showing congestion rather than a confirmed reversal structure.
Limitation example: Price can test the same lower area three times while sellers and buyers remain balanced inside a broad range. If each recovery stalls early and the upper boundary is not reclaimed, the structure is better treated as unresolved range behavior than as a clean triple bottom.
Overfitting is a common mistake. A trader can draw three lows on many charts after the fact, but the label becomes more useful only when the lows, rebounds, support zone, and upper-boundary behavior work together.
Triple Bottom vs Double Bottom, Rounding Bottom, and Triple Top
A double bottom has two main support tests, while a triple bottom has three. The third test can add evidence of level persistence, but it can also introduce more range-fatigue risk if the structure keeps failing to leave the support area.
A rounding bottom is built around a broad curved recovery rather than repeated tests of the same support zone. The visual rhythm is different: a rounding bottom usually shows a gradual basin, while a triple bottom shows three distinct troughs.
A triple top is the mirror concept. It tests resistance from below three times, while a triple bottom tests support from above three times.
Inverse head and shoulders can also look similar at first glance. The difference is the middle trough. If the middle low is clearly deeper and the two outside troughs sit higher like shoulders, inverse head and shoulders may be the cleaner label than triple bottom.
Volume, Confirmation, and Failure Conditions
Volume can help interpret a triple bottom, but it should stay secondary to structure. Declining volume near repeated support tests may add context for reduced downside pressure, while stronger activity near the upper boundary can show that the market is testing whether the range is being accepted higher. Neither condition proves the outcome by itself.
Confirmation is best treated as classification evidence. A move above the upper boundary can improve the triple bottom reading only if price holds that area well enough to show acceptance. A brief move above the boundary followed by immediate rejection keeps the structure less resolved.
Failure conditions are also structural. If price accepts below the support zone after the three lows, the pattern reading breaks down. That does not create an automatic trading decision; it simply means the chart no longer supports the same triple bottom interpretation.
Common Mistakes When Reading a Triple Bottom
| Mistake | Why it creates a weak reading | Cleaner check |
|---|---|---|
| Calling any three lows a triple bottom | Random or compressed lows can appear inside ordinary range behavior. | Check whether the lows are separated by meaningful rebounds and belong to the same support zone. |
| Ignoring the prior decline | Without prior downside pressure, the structure may not be a reversal pattern. | Look for a bearish phase before treating the structure as a bottoming pattern. |
| Treating the first boundary break as proof | A brief break can fail quickly and return price to the range. | Classify the break by whether price accepts the upper boundary or rejects it back into the range. |
| Forcing symmetry | Real chart structures often form zones and uneven swings. | Focus on support persistence, swing separation, and boundary behavior rather than perfect geometry. |
| Confusing it with inverse head and shoulders | A deeper middle trough changes the pattern logic. | Check whether the three lows are comparable or whether the middle low dominates as a head. |
Triple Bottom Classification Scenario
Price declines into a support zone, rebounds, then returns to the same area two more times over separate swings. The third low holds the zone, but the next recovery stalls below the prior rebound highs. At that point, the chart has a possible triple bottom structure, not a clean completed reading.
The structure becomes more defensible only when price moves through the upper boundary and holds that area. If the move above the boundary quickly rejects, or if price accepts below the support floor, the label remains unresolved or breaks down. At that stage, the chart depends on the full sequence: support tests, rebound highs, boundary behavior, and whether lower acceptance appears.
Triple Bottom Reading Checklist
A clean reading depends on multiple conditions working together. The checklist keeps the analysis focused on observable structure rather than prediction.
- Was there a prior decline or bearish phase before the three lows?
- Are the three lows close enough to form one support zone?
- Are the lows separated by meaningful rebounds rather than crowded candle noise?
- Do the rebound highs create a usable upper boundary?
- Does price later accept above that boundary, reject it, or remain unresolved?
- Does price hold the support floor, or does lower acceptance invalidate the reading?
- Does volume add context without replacing the structure?
Triple Bottom FAQ
What does a triple bottom mean in trading?
A triple bottom means price has tested a similar support area three times after a decline or bearish phase. The reading suggests that downside pressure may be weakening, but it remains conditional until the upper boundary behavior supports the structure.
How do you identify a triple bottom chart pattern?
Identify a triple bottom by looking for a prior decline, three lows near the same support zone, two intervening rebounds, a visible upper boundary, and later price behavior that either accepts or rejects that boundary.
Is a triple bottom always bullish?
No. A triple bottom is often discussed as a bullish reversal pattern, but the reading can stay weak or fail if the upper boundary is not accepted or if price loses the support area.
What confirms a triple bottom?
A triple bottom reading becomes cleaner when price moves above the upper boundary and holds that area. Confirmation should be treated as pattern classification evidence, not as an automatic trading instruction.
How is a triple bottom different from a double bottom?
A double bottom has two main support tests, while a triple bottom has three. The extra test can show repeated support persistence, but it can also create range-fatigue risk if price fails to leave the structure.