A double bottom chart pattern is a technical-analysis reversal structure that forms after a decline when price tests a similar lower area twice, rebounds between the tests, and later shows whether the intervening high can be accepted or rejected.
Definition: A double bottom is a two-test bottoming structure. The first trough marks the initial lower-area test, the rebound creates an intervening high, and the second trough tests whether sellers can push price materially lower or whether the same area is being defended again.
The shape is often described as a W, but the outline alone is not enough. A stronger reading needs a prior decline, two visible tests of a broadly similar area, separation between the tests, and later behavior around the neckline. Without those conditions, the label can become a forced pattern name rather than a useful chart reading.
Key Points
- A double bottom is a two-test bottom structure that appears after a prior decline.
- The two lows should be broadly similar, but they do not need to be perfectly identical.
- The intervening high forms the main neckline reference for classification.
- The reading weakens if price fails to hold above that level or breaks materially below the second test.
What Is a Double Bottom Chart Pattern?
A double bottom chart pattern is a potential reversal structure in which a market declines, forms a first trough, rebounds, then returns to test a similar lower area a second time. The pattern asks whether the prior decline is losing acceptance near the lower area or whether sellers are still able to extend the move.
The second low carries the main evidence test. Holding near the first low keeps the two-test structure intact, while a materially lower break changes the chart into lower acceptance rather than a defended bottom. Later behavior around the intervening high then separates a still-unresolved base from a stronger double bottom reading.
Boundary: Two nearby lows are not enough by themselves. A double bottom needs a prior decline, a meaningful rebound between the lows, and later price behavior that clarifies whether the lower area was defended or broken.
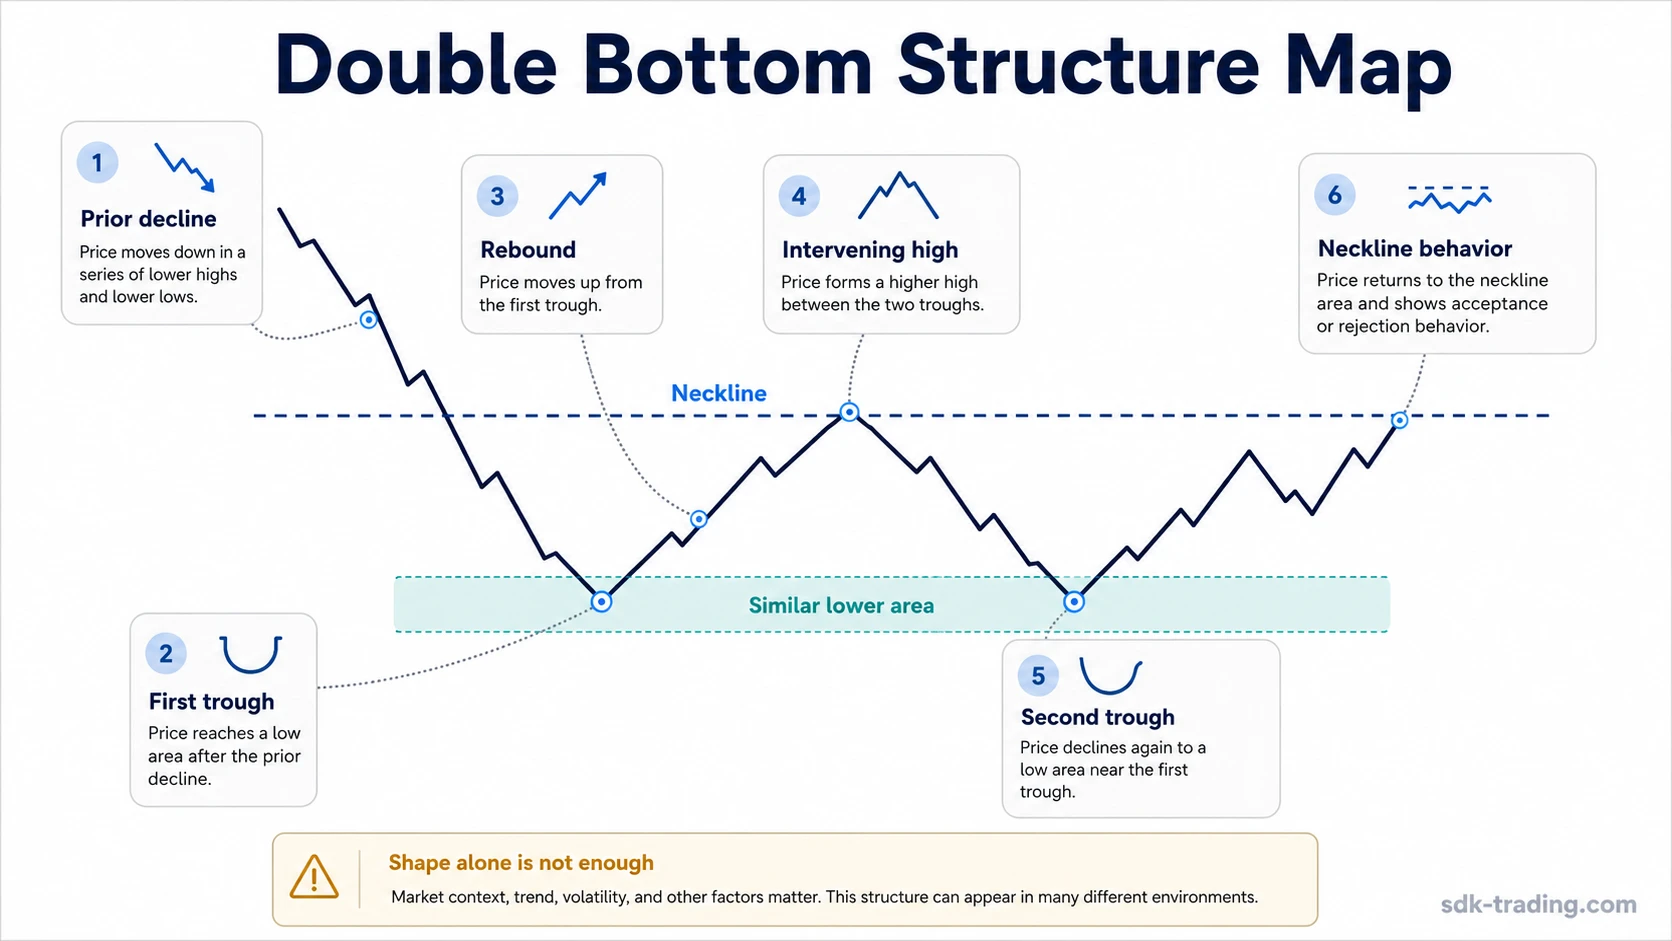
How a Double Bottom Forms
The structure begins with a decline into a lower area where selling pressure stops extending price cleanly. The first trough forms when price rebounds from that area. The rebound matters because it creates the intervening high that later becomes the neckline.
After the rebound, price moves back toward the lower area. The second trough tests whether the first low was only a pause in the decline or whether the same area is still attracting enough demand to prevent a materially lower break. The pattern remains unresolved until later behavior around the neckline shows acceptance or failure.
| Stage | What to Observe | Why It Matters |
|---|---|---|
| Prior decline | Price moves lower before the two-test structure appears. | Without a preceding decline, the pattern loses its reversal context. |
| First trough | Price stops falling and rebounds from a lower area. | This creates the first reference point for the support test. |
| Intervening high | Price rebounds enough to create a visible high between the lows. | This level becomes the neckline for later acceptance or rejection. |
| Second trough | Price returns toward the first-low area without breaking materially lower. | This tests whether the lower area is being defended again. |
| Neckline behavior | Price later approaches, rejects, or accepts above the intervening high. | This separates an unresolved two-test structure from a more defensible double bottom reading. |
How to Identify the Structure
A useful double bottom reading starts with structure, not with visual similarity. The two lows should sit in the same general support area, but exact equality is not required. Markets often test zones rather than precise prices, so a slightly higher or lower second trough can still fit if the lower area remains broadly intact.
Separation between the lows also matters. If the rebound is too small, the chart may be showing range noise rather than a two-test reversal structure. The intervening high should be visible enough to act as a reference point for later acceptance or failure.
| Identification Check | Cleaner Reading | Weaker Reading |
|---|---|---|
| Prior move | A clear decline precedes the structure. | The pattern appears inside a flat range with no clear prior decline. |
| Low similarity | The two troughs test a broadly similar lower area. | The second low breaks far below the first or sits too far away to read as the same test. |
| Rebound quality | The rebound creates a visible intervening high. | The rebound is too shallow to create a meaningful neckline. |
| Second-test quality | The second test holds without immediate lower acceptance. | The second test continues lower or stays heavy without recovery. |
| Neckline behavior | Price later accepts above the intervening high. | Price pierces the level briefly and falls back below it. |
| Volume evidence | Volume helps show whether effort near the lows is being absorbed or rejected. | Volume is treated as mechanical proof without checking the price result. |
Volume can improve the reading when it clarifies effort and result near the lows or near the neckline. It should not be treated as a mechanical confirmation rule. A high-volume second test that closes poorly and breaks lower has a different meaning from a high-volume test that rejects lower prices and later holds recovery.
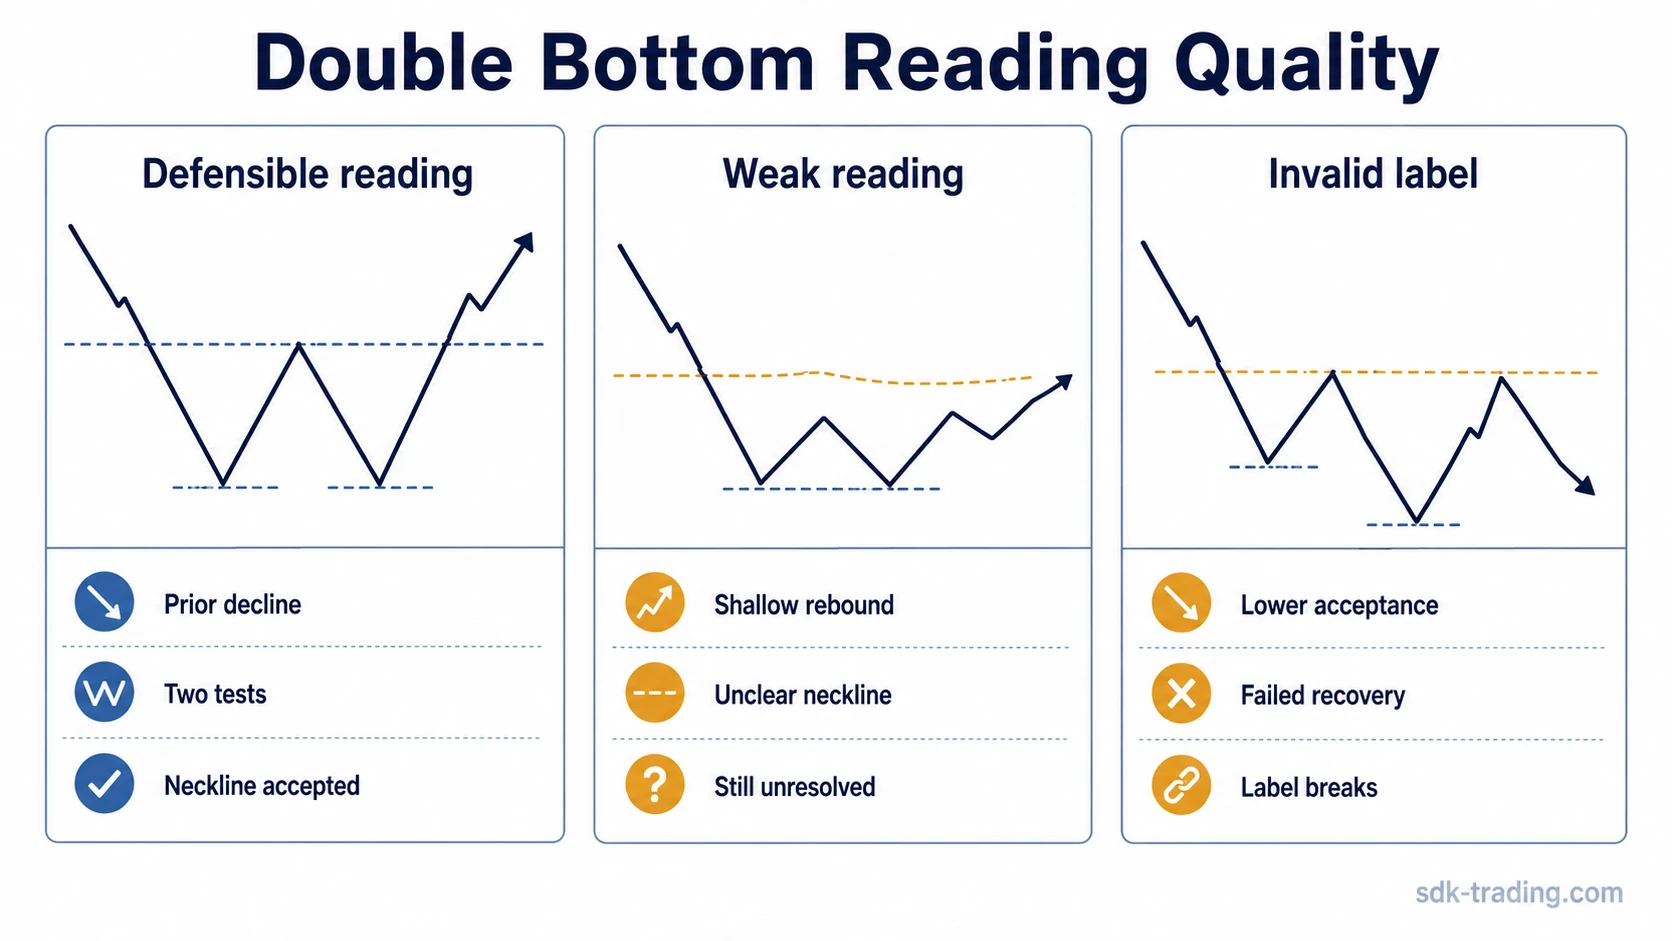
Clean, Weak, and Invalid Double Bottom Readings
The strongest value of the pattern comes from separating the quality of the reading. A clean double bottom, a weak double bottom, and an invalid label can look similar at first glance, especially before neckline behavior is known.
| Reading Type | Typical Structure | What Changes the Interpretation |
|---|---|---|
| Clean double bottom | Prior decline, two visible tests of a similar lower area, meaningful rebound between tests, and later acceptance above the neckline. | The second low holds the same area and the market later shows that the intervening high is no longer being rejected immediately. |
| Weak double bottom | The lows are visible, but the prior decline is unclear, the rebound is shallow, or the second test is messy. | The structure may still be watched, but the evidence is not strong enough to treat it as a clean reversal structure. |
| Invalid double bottom | The second low breaks materially below the first, the neckline attempt fails quickly, or the label only appears after forcing the chart to fit the pattern. | The market is showing lower acceptance or failed recovery rather than a defended two-test bottom. |
The classification keeps the label conditional. The structure improves only while the second test, the rebound, and the neckline behavior continue to support the same two-test bottom interpretation.
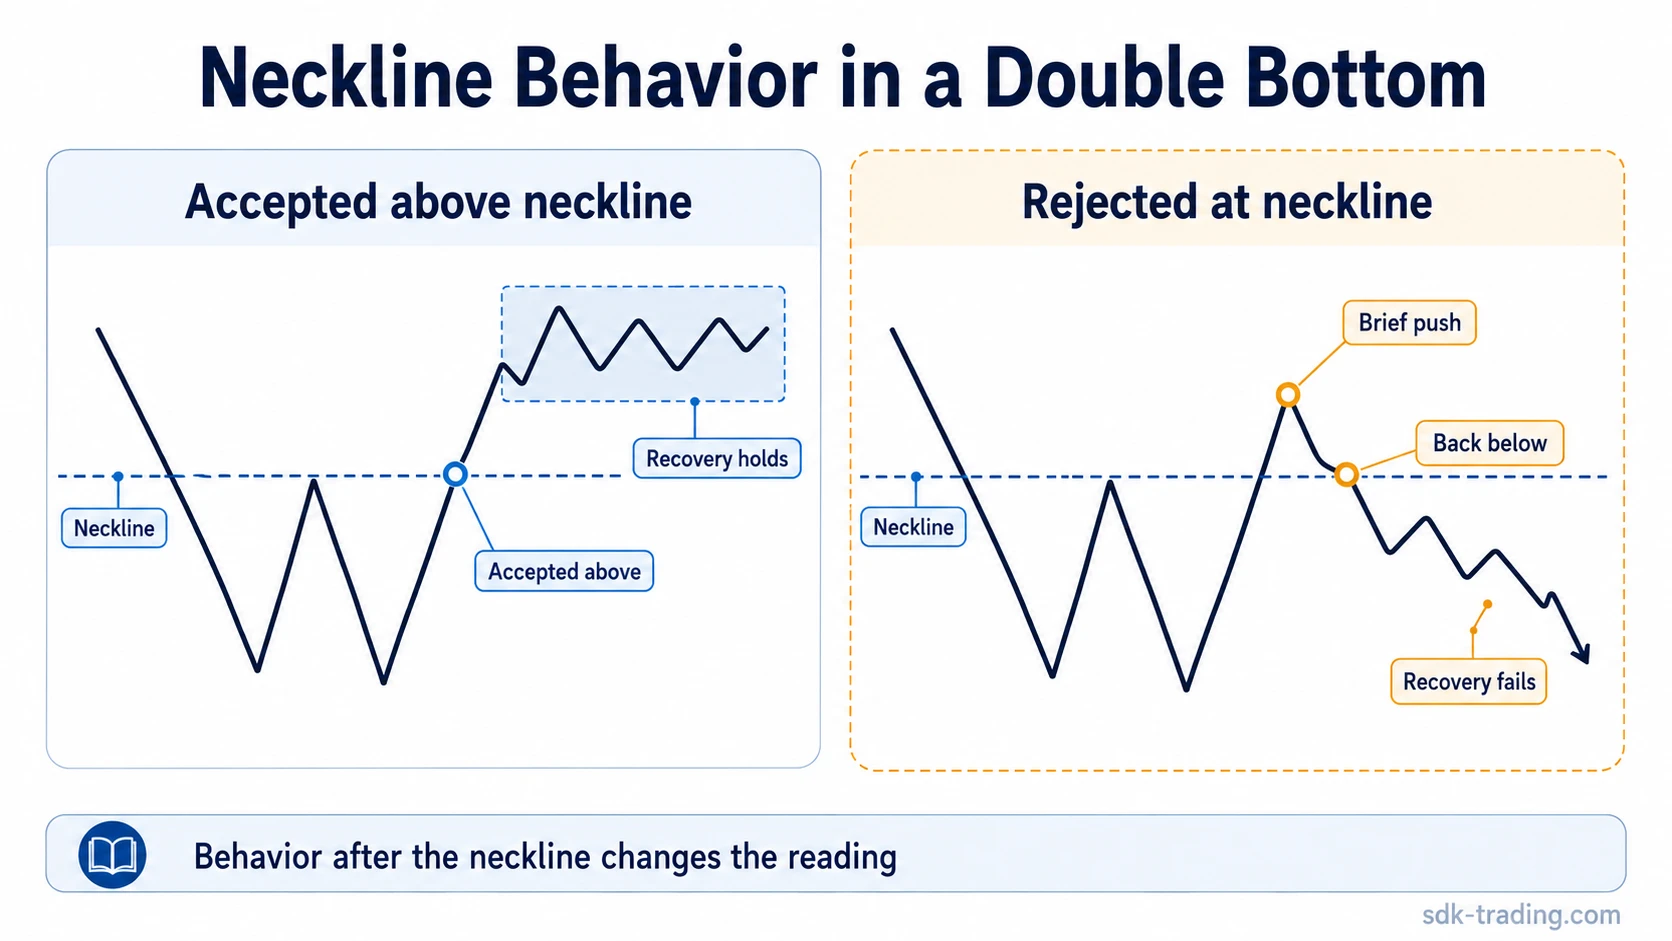
Why the Neckline Matters
The neckline is the intervening high between the first trough and the second trough. It matters because it is the main reference point for whether the market is only bouncing inside a decline or whether the two-test structure is gaining acceptance.
A move above the neckline is not automatically a complete reversal. The more important question is whether price can remain accepted above that area. A brief push above the neckline followed by quick rejection leaves the structure unresolved or failed, especially if price returns to the lower area with renewed pressure.
Limitation: A neckline break should be read as a classification event, not as a trading instruction. The chart reading improves only if later behavior supports acceptance rather than immediate rejection.
Failed neckline behavior is one reason double bottoms are often misread. A chart can briefly move above the intervening high, attract attention, and then fall back below it. That behavior changes the interpretation because the market has tested recovery and failed to maintain it.
Common Misreadings
The most common mistake is labeling any two nearby lows as a double bottom. A lower area can be tested twice inside a range, during a continuation pause, or during a still-active decline. The pattern becomes more meaningful only when the two-test structure has reversal context and later acceptance behavior.
Another mistake is demanding perfectly equal lows. Exact equality is not necessary. The better question is whether the second trough tests the same general lower area without producing a materially lower acceptance. A small difference between the lows can be normal; a decisive lower break changes the reading.
A third mistake is treating the first move above the neckline as final. Breakout attempts can fail. If price cannot hold above the intervening high, the chart may be showing a failed recovery rather than a completed double bottom.
Double Bottom Compared With Nearby Patterns
A double top is the mirrored structure: it forms after an advance when price tests a similar upper area twice and later shows whether the intervening low can be accepted or rejected. The double bottom is the lower-area version of that two-test logic.
A rounding bottom is different because the transition is curved and gradual rather than built around two separated troughs. A double bottom has a more segmented structure: first low, rebound, second low, then neckline behavior.
A triple bottom requires three tests of a similar lower area. The extra test changes the structure because the market has returned to the same support area one more time before resolving.
Nearby-pattern boundary: A double bottom is specifically a two-test bottoming structure. If the transition is rounded, the reading moves toward a rounding bottom. If the lower area is tested three times, the reading moves toward a triple bottom. If the structure has shoulder-head-shoulder asymmetry, it belongs to a different reversal pattern family.
Example of a Basic Double Bottom Reading
Price declines into a prior lower area and rebounds, creating a visible intervening high. Later, price returns toward the first trough but does not accept materially lower. The second test holds near the same area, and the next recovery attempt challenges the intervening high.
The structure is cleaner if price moves above the intervening high and does not immediately fall back below it. It stays weak when the rebound between the lows is too shallow to create a meaningful neckline, or when price briefly clears the neckline and then returns to the lower area. The label fails if price breaks materially below the second test and remains accepted lower.
The diagnostic point is the sequence, not the label. First identify the decline, the two tests, and the intervening high. Then compare later price behavior with the conditions that would keep the structure intact or damage it.
FAQ
What does a double bottom chart pattern mean?
A double bottom chart pattern means price has tested a similar lower area twice after a decline, with a rebound between the two lows. The structure gains weight when the second test holds and later price behavior stays above the intervening high.
Is a double bottom bullish?
A double bottom is usually read as a potential bullish reversal structure, but only conditionally. It does not prove that a reversal is underway; the interpretation depends on whether the second low holds and the neckline area is accepted rather than rejected.
Do the two lows in a double bottom need to be equal?
No. The two lows should test a broadly similar lower area, but exact equality is not required. A materially lower second low can weaken or invalidate the reading because it shows lower acceptance rather than a defended area.
How is a double bottom confirmed?
A double bottom is more defensible when price accepts above the intervening high between the two troughs. A brief move above that level is weaker if price quickly falls back below it.
What makes a double bottom fail?
A double bottom reading fails when the second low breaks materially below the first, when the neckline attempt is rejected quickly, or when the pattern only exists because the chart has been forced to fit the label.