A V-bottom chart pattern is a sharp reversal structure in technical analysis that forms after a steep decline, a compact turning low, and a fast recovery. The low alone does not complete the reading; the right side needs enough separation from the pivot, and later behavior around the upper reaction area decides whether the structure looks clean, weak, or failed.
Definition: A V-bottom is a trading chart pattern where price falls quickly, turns from a narrow low, and recovers sharply enough to create a V-shaped structure on the chart.
The diagnostic problem is not the V shape itself, but whether the recovery remains accepted after the first obvious test. A sharp bounce may look impressive, but the V-bottom reading becomes more defensible only when the decline, pivot, recovery leg, and later upper-area behavior belong to the same coherent sequence.
Key Points
- A V-bottom depends on speed and compression: steep left side, compact pivot, and strong right-side recovery.
- The first rebound is not enough by itself because a fast bounce can still fail near the prior reaction area.
- Clean readings show separation from the low and later acceptance around the upper boundary.
- Weak or failed readings often expand into a messy base, reject quickly, or lose the recovery structure.
What Is a V-Bottom Chart Pattern?
A V-bottom chart pattern describes a market turning from a fast decline into a fast recovery without building a long rounded base or repeating several separated support tests. The defining feature is the compressed pivot: price changes direction from a narrow low rather than spending many swings building a bottoming range.
The V shape is only the visible outline. The structure underneath matters more: sellers drive price lower, downside momentum stops abruptly, buyers recover enough ground to separate from the low, and the recovery then meets a prior reaction area. If that tested area rejects the move immediately, the pattern reading weakens.
This is why a V-bottom is different from a generic rebound. A rebound only says price moved up after falling. A V-bottom requires a sharper structural sequence, not just a strong candle or one emotional recovery day.
How a V-Bottom Forms
The mechanism begins with downside acceleration. Price drops quickly enough that the left side of the pattern looks steep rather than gradual. That decline can reflect liquidation, selling exhaustion, or a sudden shift in demand, but the public reading should stay focused on observable chart behavior rather than hidden cause.
The pivot comes next. A cleaner V-bottom usually has a compact low where price stops falling without several wide, separated support tests. The recovery leg then rises away from that pivot with enough strength to create visible right-side separation.
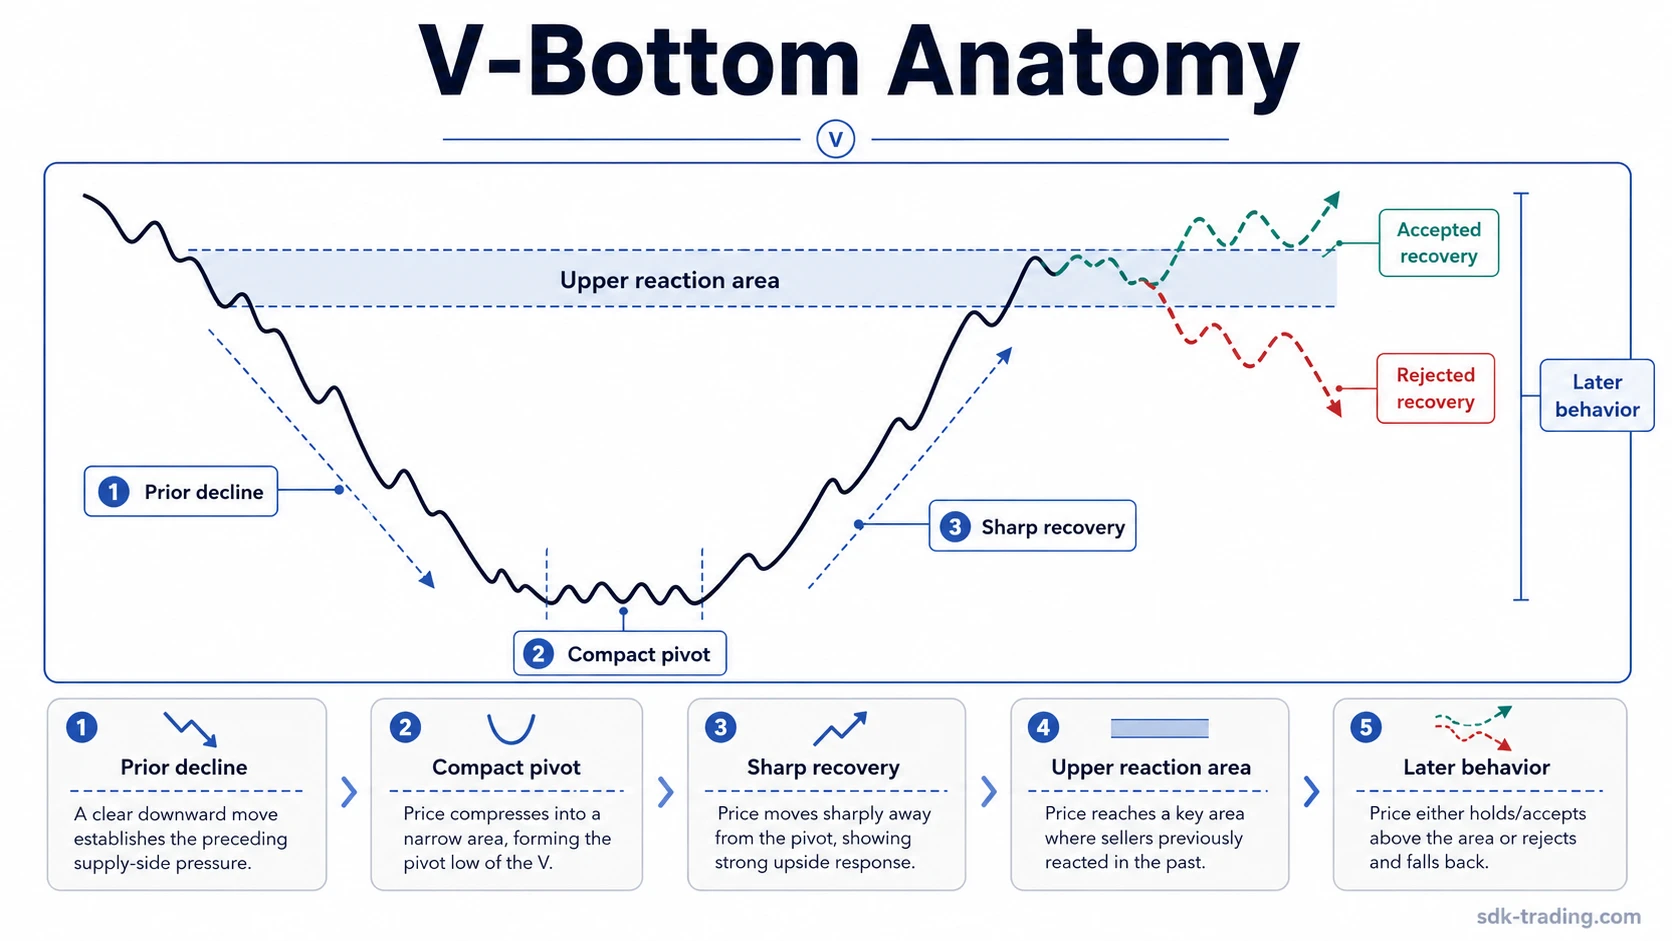
| Stage | Observable behavior | Why it matters |
|---|---|---|
| Prior decline | Price falls sharply into a lower area. | Creates the steep left side of the V structure. |
| Compact pivot | The low forms in a narrow area instead of a long base. | Separates a V-bottom from gradual bottoming patterns. |
| Right-side recovery | Price rebounds quickly away from the low. | Creates the visual V shape and tests whether demand can hold the turn. |
| Upper reaction area | The recovery reaches a prior reaction high, neckline-like zone, or supply area. | Shows whether the rebound is being accepted or rejected. |
| Acceptance or failure | Price holds, rejects, or falls back into the structure. | Helps classify the pattern as clean, weak, or failed. |
Observability note: A V-bottom is easier to label after the right side has developed. During the first bounce, the structure may still be only a fast recovery attempt.
How to Identify a V-Bottom
Identification starts with the shape, but it should not stop there. A clean V-bottom needs the decline, pivot, and rebound to work together as one structure. If the left side is slow, the pivot is wide, or the right side overlaps heavily, the reading becomes less precise.
- Steep left side: the decline should look abrupt compared with nearby price action.
- Compact low: the pivot should not look like a long accumulation range or repeated support test.
- Sharp recovery: the right side should separate from the low clearly enough to form a visible V shape.
- Upper reaction area: the rebound should be judged against the area where prior supply or resistance may appear.
- Later behavior: the reading improves if price does not immediately reject the recovery area and collapse back into the lower structure.
Volume can add context, but it should not carry the reading alone. A heavy-volume rebound that fails near the tested recovery area can still be a failed recovery rather than a clean V-bottom.
Clean, Weak, and Failed V-Bottom Readings
The cleanest V-bottom reading appears when the market creates a steep decline, tight pivot, and strong recovery, then avoids immediate rejection near the upper reaction area. Weaker versions keep part of the V shape but lose structural clarity. Failed versions usually show that the recovery could not hold acceptance above the lower structure.
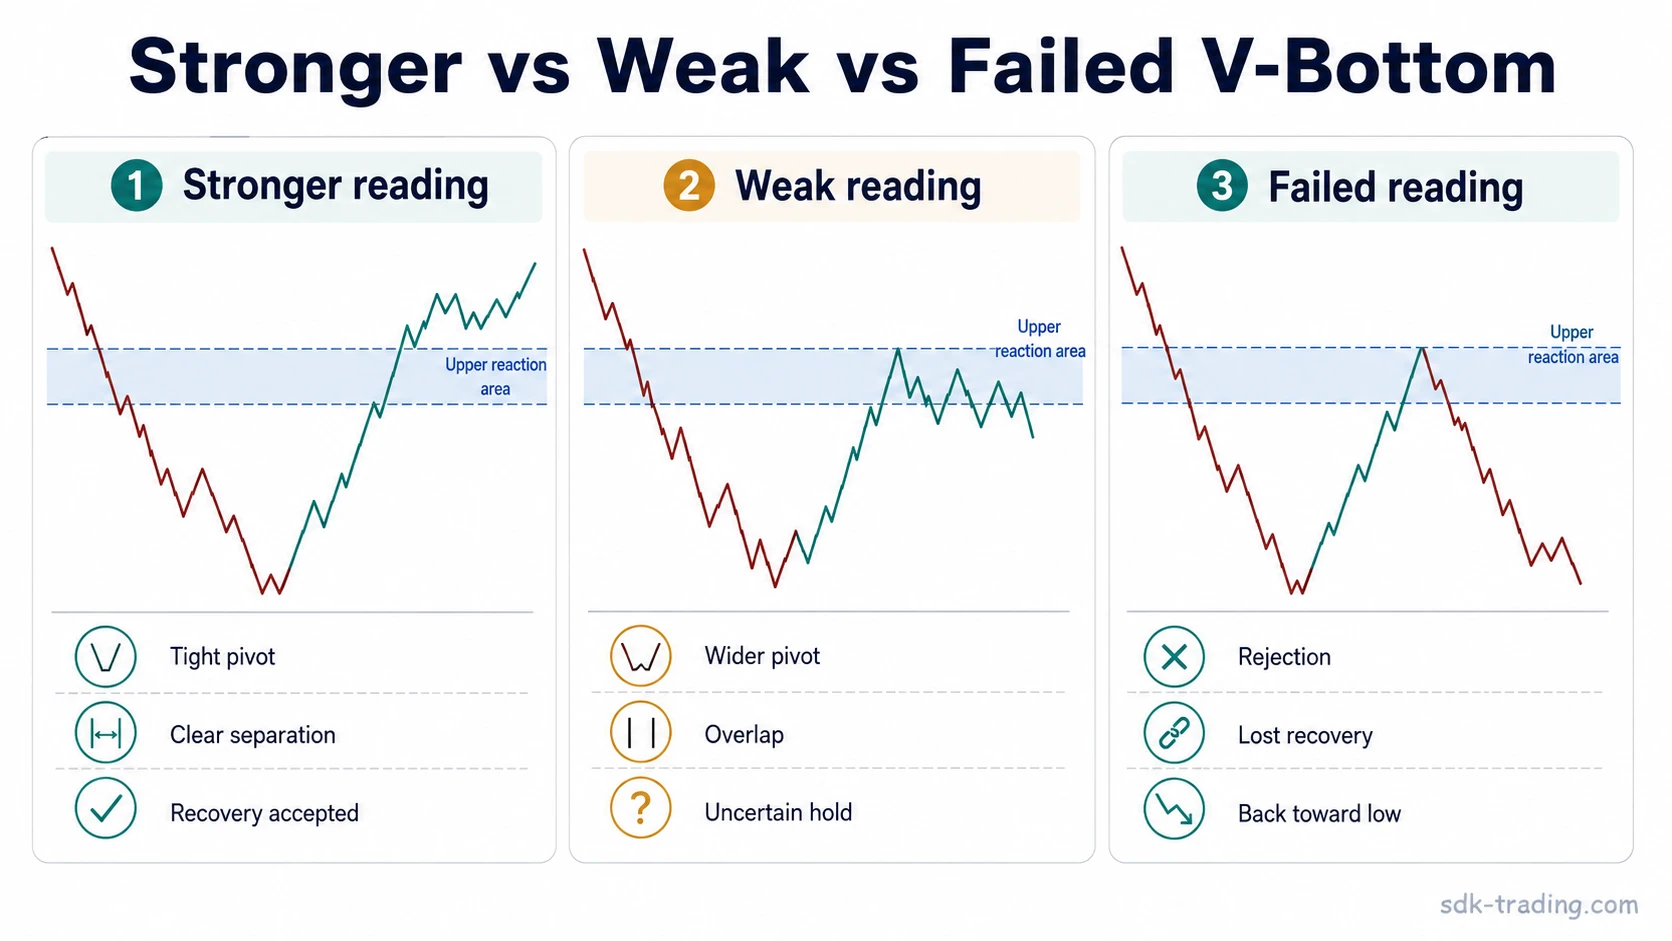
| Reading | Structure | Upper-area behavior | Interpretation boundary |
|---|---|---|---|
| Clean V-bottom | Steep decline, compact pivot, and clear right-side separation. | Recovery holds near or above the upper reaction area without immediate rejection. | The pattern reading is more defensible because the recovery structure stays intact. |
| Weak V-bottom | The bounce is sharp, but the pivot is messy, wide, or overlapped. | Price hesitates near the upper area or repeatedly falls back into the middle of the structure. | The chart may show a bounce, but the V-bottom label remains uncertain. |
| Failed V-bottom | The first rebound loses separation from the low or turns into a broader base. | The recovery rejects quickly and price returns toward the lower area. | The first V-shaped move was not accepted as a completed reversal structure. |
The important distinction is not whether price bounced sharply. The distinction is whether the sharp recovery remained structurally accepted after it reached the area where rejection could reasonably appear.
V-Bottom vs Rounding Bottom, Double Bottom, and Triple Bottom
A V-bottom can be confused with nearby bottoming patterns because all of them involve a market turning after decline. The difference is the path of the turn. A V-bottom compresses the pivot into a fast reversal structure, while other bottoming patterns usually need more time, more swings, or more separated tests.
| Pattern | Main structure | How it differs from a V-bottom |
|---|---|---|
| rounding bottom | Gradual basin with slow downside deceleration and gradual recovery. | It develops through a broad curve rather than a compressed low and sharp right side. |
| double bottom | Two separated tests of a support area. | It depends on repeated lows rather than one compact pivot. |
| triple bottom | Three separated support tests across a wider bottoming structure. | It requires repeated tests, while a V-bottom depends on speed and recovery separation. |
| V-top | Sharp upward move, compact top, and fast decline. | It is the opposite-direction version of a sharp reversal structure. |
If the bottoming structure becomes wide, slow, or repeatedly tested, the V-bottom label usually loses precision. The chart may still be forming a reversal pattern, but it is no longer the same structural reading.
Common Mistakes and Limitations
The most common mistake is calling the first sharp bounce a completed V-bottom before the chart has enough right-side evidence. A fast rally can look convincing while still failing at the first meaningful reaction area.
Common mistake: Treating speed as proof. Speed creates the V shape, but acceptance near the upper reaction area is what makes the reading more defensible.
Another limitation is volatility. A volatile market can create large V-shaped swings that look clean in hindsight but remain difficult to classify while they are forming. When the lower area expands into multiple overlapping swings, the structure may be closer to a base than a V-bottom.
- Too early: the recovery has not separated enough from the low.
- Too messy: the pivot expands into several overlapping swings.
- Too broad: the structure starts behaving like a base rather than a compact reversal.
- Too rejected: the upper reaction area pushes price quickly back into the lower structure.
A V-bottom reading should therefore stay conditional. The pattern can describe a sharp reversal structure, but it should not be treated as a prediction, a trade instruction, or proof that a durable reversal has already been established.
Simple V-Bottom Example in Context
Price falls quickly into a lower area after a clear downside push. The decline stops at a narrow low, then price recovers enough to retrace a large part of the drop. At that point, the chart has the outline of a possible V-bottom, but the reading is still incomplete.
The cleaner case develops if the recovery holds near the prior reaction area and does not immediately fall back into the lower half of the structure. The weaker case develops if the rebound stalls, overlaps heavily, and starts forming a wider base. The failed case appears if the recovery rejects quickly and price returns toward the low.
The scenario is diagnostic rather than tactical. It separates the shape from the acceptance test, which is the main difference between a fast bounce and a more defensible V-bottom reading.
FAQ
What is a V-bottom chart pattern?
A V-bottom chart pattern is a sharp reversal structure where price falls quickly, forms a compact low, and recovers rapidly enough to create a V-shaped move on the chart.
How do you identify a V-bottom?
A V-bottom is identified by a steep decline, a narrow pivot low, a strong right-side recovery, and later behavior that does not immediately reject the recovery near the upper reaction area.
Is a V-bottom always bullish?
A V-bottom is commonly classified as a bullish reversal structure, but the interpretation remains conditional. A fast rebound can fail if price rejects the upper area or falls back into the lower structure.
What makes a V-bottom weak or failed?
A V-bottom reading weakens when the pivot becomes messy, the recovery lacks separation, or price rejects quickly near the upper reaction area. It fails when the recovery cannot hold and price returns toward the lower area.
How is a V-bottom different from a rounding bottom?
A V-bottom forms through a steep decline, compact pivot, and fast recovery. A rounding bottom develops more gradually through a broad curved basin and slower right-side recovery.