A pennant chart pattern is a trading chart pattern that can form after a sharp directional move, when price pauses in a tight converging consolidation before testing whether the prior move can continue.
The outline is only the visible surface. A more defensible reading depends on the sequence behind it: a real prior impulse, a compact pause, compression toward an apex, and later price behavior that holds beyond the structure instead of quickly returning inside it.
Definition: A pennant chart pattern is a compact continuation-pattern structure made of a prior impulse and a small triangular consolidation. The consolidation usually narrows as highs and lows compress toward an apex.
Key Points
- A pennant needs a prior impulse; without it, the structure is closer to a generic triangle or range.
- The pause should be smaller and tighter than the move that came before it.
- Converging boundaries are central to the pattern; parallel boundaries fit flag behavior more closely.
- A boundary break needs follow-through outside the structure to support the reading.
- Weak impulse, broad chop, or fast rejection can make the pennant reading unreliable.
What Is a Pennant Chart Pattern?
A pennant chart pattern is a continuation-pattern reading built around compression. Price first moves sharply in one direction, then pauses in a small structure where each swing becomes more compressed than the last. The pause creates the pennant shape.
The pattern belongs to the same continuation family as flags and rectangles, but its identity comes from convergence. A flag usually pauses inside a channel-like structure. A rectangle usually holds a flatter range. A pennant contracts into a smaller triangular pause after an impulse.
The distinction is structural, not predictive. A pennant describes how price is pausing after momentum; it does not prove that the next move will continue.
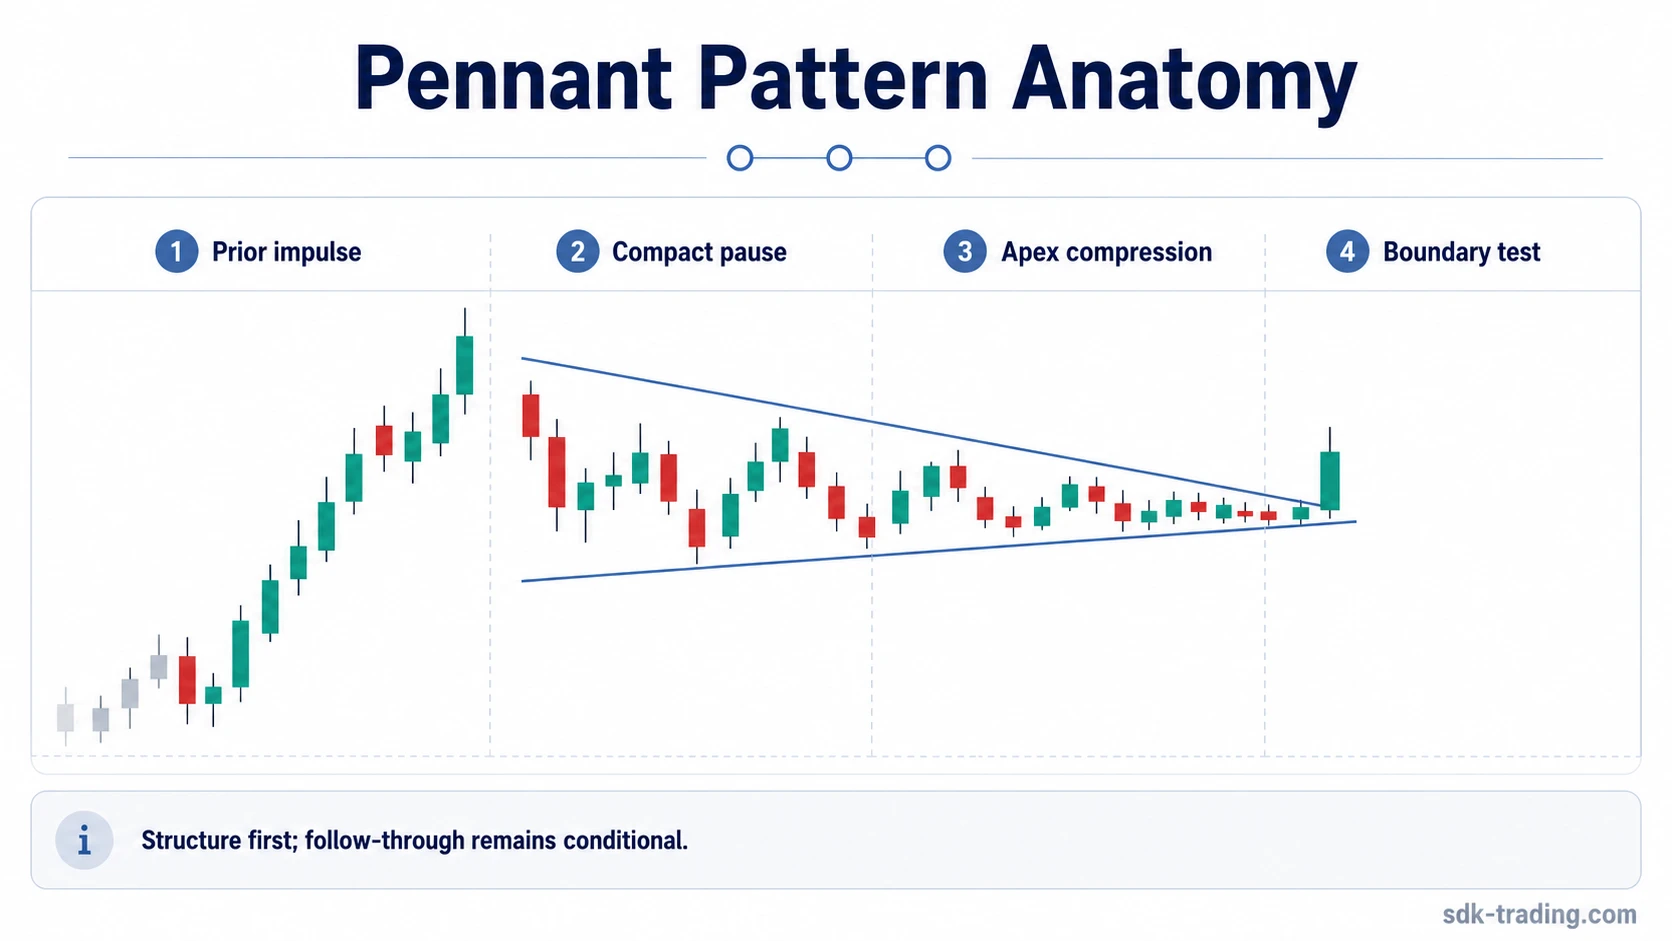
How a Pennant Pattern Forms
A pennant begins with a strong directional move. That move is often called the impulse or flagpole because it creates the context for the later pause. Without that first move, the later triangle-like shape has less reason to be read as a continuation structure.
After the impulse, price starts to compress. Highs and lows move closer together, participation may become less aggressive, and the structure narrows toward an apex. The market is no longer extending cleanly, but it has also not fully reversed the prior move.
The boundary test comes after compression. A move beyond the pennant boundary is only the first event; the reading gains quality when later candles stay outside the structure instead of snapping back into the consolidation.
| Formation stage | What to observe | Why it matters |
|---|---|---|
| Prior impulse | A clear directional move before the pause | Creates the continuation context that separates a pennant from an isolated triangle |
| Compact pause | A smaller consolidation that does not erase most of the prior move | Shows that the market is pausing rather than fully rotating into a broad range |
| Converging boundaries | Lower highs and higher lows compress toward an apex | Creates the pennant shape and separates it from channel-like flag behavior |
| Boundary test | Price moves beyond one side of the structure | Starts the follow-through question but does not settle it by itself |
Pennant Structure Test
A pennant reading is strongest when several structural checks align. The shape may look correct at first glance, but the reading weakens when the pause is too wide, too long, or disconnected from a meaningful prior move.
Pennant structure quality test: first check the impulse, then the size of the pause, then the convergence, then the behavior after the boundary test. The pattern is the surface; the structure is the reason it matters.
| Question | Stronger structure | Weaker structure |
|---|---|---|
| Was there a real prior impulse? | The move into the pause is clear and directional. | The move before the pause is slow, uneven, or already range-bound. |
| Is the pause compact? | The consolidation stays small compared with the prior move. | The pause becomes wide enough to erase much of the impulse. |
| Do the boundaries converge? | Highs and lows compress toward a visible apex. | The structure drifts sideways, expands, or forms a loose channel. |
| Is there compression rather than broad chop? | Swings narrow and price spends less time at the outer edges. | Price keeps whipping across the structure with little narrowing. |
| Does price hold beyond the boundary? | Later candles remain outside the structure or fail to return quickly inside it. | The break is immediately rejected and price falls back into the pause. |
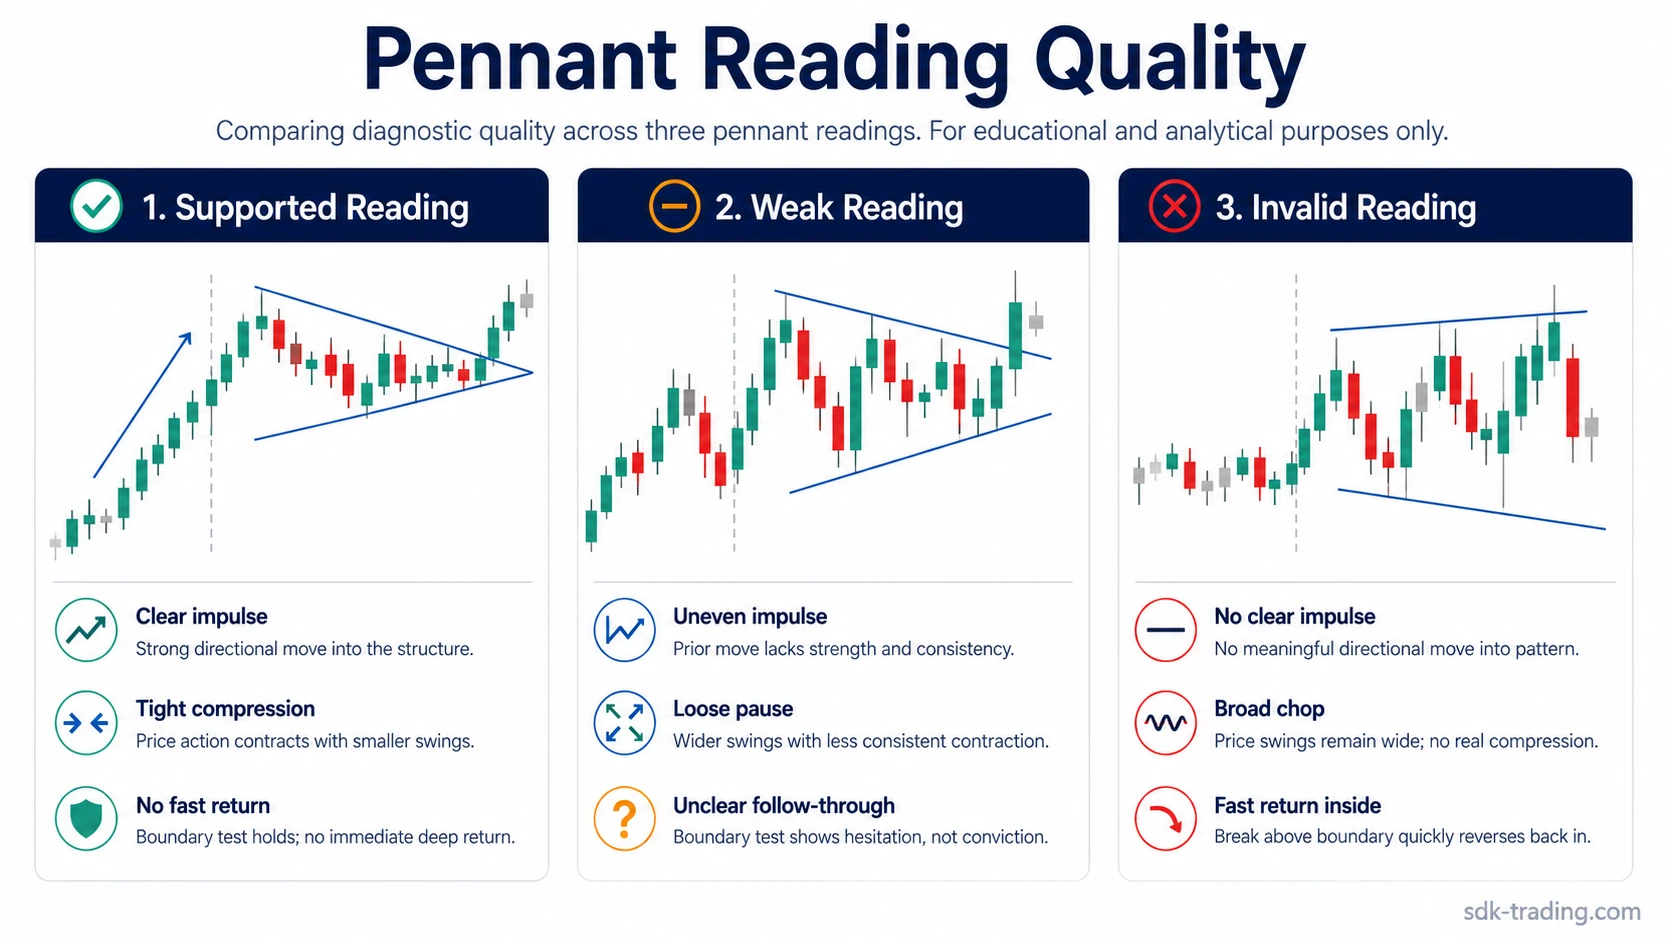
Clean, Weak, and Invalid Pennant Readings
Not every triangular pause after a move deserves the same interpretation. Separating clean, weak, and invalid readings prevents a visual outline from becoming a forced continuation story.
| Reading quality | What is visible | Why it matters | What weakens the reading |
|---|---|---|---|
| Clean pennant reading | A sharp prior impulse, compact converging pause, and compression toward an apex. | The structure fits the basic rhythm of impulse, pause, and boundary test. | The reading still needs follow-through outside the structure; shape alone is not proof. |
| Weak pennant reading | The outline narrows, but the prior move is uneven or the pause is loose. | The structure may be a consolidation, but the continuation context is less clear. | Wide swings, fading momentum, or repeated failed boundary tests reduce quality. |
| Invalid / not enough evidence | The structure has no clear impulse, no real compression, or quickly expands into chop. | The market is no longer showing a compact pennant rhythm. | A fast rejection after the boundary break or broad sideways trade argues against the reading. |
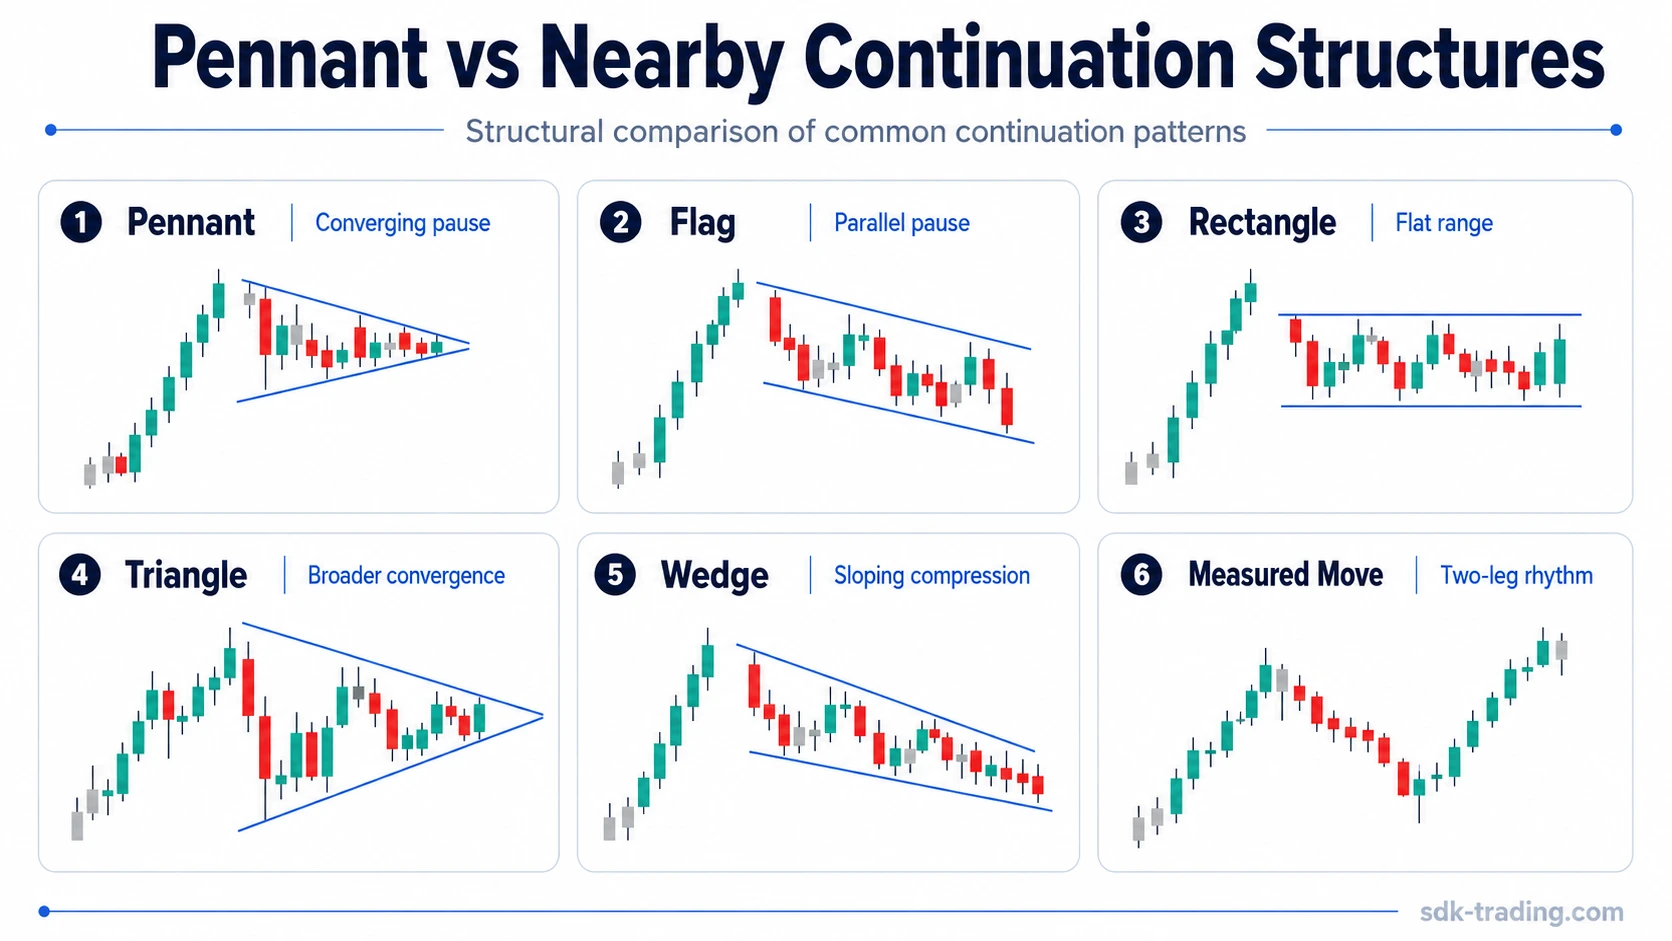
Pennant vs Flag, Triangle, Rectangle, and Wedge
A pennant is often confused with nearby continuation structures because several patterns involve a pause after a directional move. The difference is in the structure of the pause.
| Pattern | Typical pause structure | Main distinction from a pennant |
|---|---|---|
| Pennant | Small converging consolidation after an impulse | Compression toward an apex is central to the reading. |
| Flag | Channel-like pause with roughly parallel boundaries | The pause is more parallel or sloped, not triangular compression. |
| Rectangle | Sideways range between flatter support and resistance areas | The structure holds a horizontal range rather than narrowing into an apex. |
| Symmetrical triangle | Broader converging structure that may form without a sharp immediate impulse | The continuation context is less dependent on a flagpole-style move. |
| Wedge | Sloping converging structure | The slope and context can change the interpretation, so it should not be treated as the same pattern by shape alone. |
| Measured move | Two-leg rhythm separated by a correction or pause | The focus is the rhythm of legs, not compression into an endpoint. |
Bullish and Bearish Pennant Variants
A bullish variant forms after an upward impulse and a compact converging pause. A bullish pennant reading focuses on whether the market can sustain higher prices after that compression.
A bearish variant forms after a downward impulse and a compact converging pause. A bearish pennant reading focuses on whether the market can sustain lower prices after that compression.
The generic pennant structure stays the same in both cases: impulse first, then tight convergence, then a boundary test that needs later behavior to clarify the reading.
Common Mistakes When Reading Pennant Patterns
The most common mistake is treating any small triangle as a pennant. A triangle-like outline is only one part of the structure. The prior impulse, the compactness of the pause, and the later boundary behavior all matter.
Common mistake: calling the first boundary break a completed pennant reading before the market has shown whether price can stay outside the structure.
- Weak impulse: if the move into the pause is slow or overlapping, the continuation context is weaker.
- Oversized pause: if the consolidation retraces too much of the impulse, the pattern may be losing its compact character.
- Broad chop: if swings expand instead of compressing, the structure no longer behaves like a tight pennant.
- Immediate rejection: if the boundary break quickly returns inside the structure, follow-through has not appeared.
- Forced direction: bullish or bearish labels should come from the prior impulse and later behavior, not from preference.
Pennant Pattern Limitations
A pennant is not reliable from shape alone. Market context, structure quality, participation, and later boundary behavior all influence how defensible the reading is.
Volume or participation can add useful context when activity contracts during the pause and expands during a sustained move beyond the boundary. Even then, it should be treated as supportive evidence rather than proof that continuation will happen.
Limitation: a pennant-shaped outline can be misleading when the prior move is weak, the consolidation is too wide, or the boundary break is quickly rejected. The safer reading stays conditional until price behavior clarifies whether the structure is holding or failing.
Pennant Chart Pattern Example in Context
Price advances sharply, then pauses in a smaller range where each recovery high is lower and each pullback low is slightly higher. The structure tightens instead of drifting sideways, and the pause remains much smaller than the prior move.
The pennant reading is more defensible if price later moves beyond the upper boundary and does not immediately fall back inside the consolidation. The weaker case is a brief boundary clear that closes back inside the compression, followed by another stalled attempt near the same edge.
The diagnostic point is not that the pattern predicts the next move. Impulse, compression, and later boundary behavior should be evaluated together before the structure is treated as meaningful.
FAQ
What is a pennant chart pattern?
A pennant chart pattern is a compact continuation-pattern structure that forms after a sharp move, when price pauses in a small converging consolidation before testing a boundary.
How do you identify a pennant pattern?
Look for a clear prior impulse, a smaller converging pause, compression toward an apex, and later price behavior that shows whether the boundary break is accepted or rejected.
What is the difference between a flag and a pennant?
A flag usually has a channel-like pause with roughly parallel boundaries, while a pennant has a tighter triangular pause with converging boundaries.
Can a pennant pattern fail?
Yes. A pennant reading can fail or remain unresolved when the prior impulse is weak, the pause turns into broad chop, or a boundary break is quickly rejected.
Is a pennant a standalone trading signal?
No. A pennant is a structure for reading compression after an impulse. It should not be treated as a standalone signal without context and later acceptance or failure behavior.